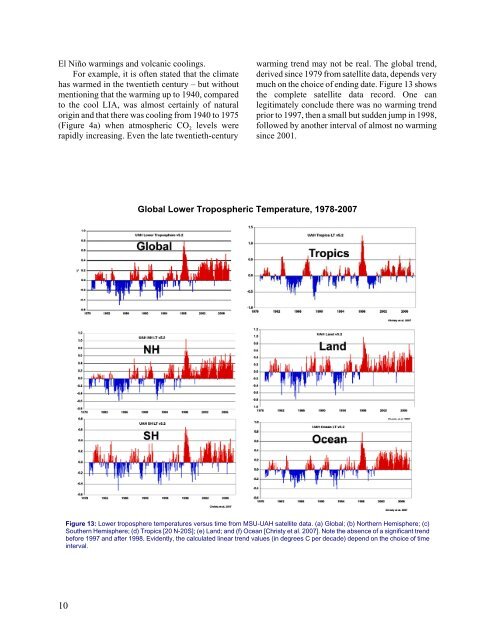
El Niño warmings and volcanic coolings.For example, it is often stated that <strong>the</strong> climatehas warmed in <strong>the</strong> twentieth century – but withoutmentioning that <strong>the</strong> warming up to 1940, comparedto <strong>the</strong> cool LIA, was almost certainly of naturalorigin and that <strong>the</strong>re was cooling from 1940 to 1975(Figure 4a) when atmospheric CO 2 levels wererapidly increasing. Even <strong>the</strong> late twentieth-centurywarming trend may not be real. The global trend,derived since 1979 from satellite data, depends verymuch on <strong>the</strong> choice of ending date. Figure 13 shows<strong>the</strong> complete satellite data record. One canlegitimately conclude <strong>the</strong>re was no warming trendprior to 1997, <strong>the</strong>n a small but sudden jump in 1998,followed by ano<strong>the</strong>r interval of almost no warmingsince 2001.Global Lower Tropospheric Temperature, 1978-2007Figure 13: Lower troposphere temperatures versus time from MSU-UAH satellite data. (a) Global; (b) Nor<strong>the</strong>rn Hemisphere; (c)Sou<strong>the</strong>rn Hemisphere; (d) Tropics [20 N-20S]; (e) Land; and (f) Ocean [Christy et al. 2007]. <strong>Not</strong>e <strong>the</strong> absence of a significant trendbefore 1997 and after 1998. Evidently, <strong>the</strong> calculated linear trend values (in degrees C per decade) depend on <strong>the</strong> choice of timeinterval.10
! Global warming prior to 1940 was notanthropogenic.Most agree that <strong>the</strong> pre-1940 warming signals arecovery from <strong>the</strong> Little Ice Age and was not causedby GH gases but by natural factors, amongst whichsolar variability was probably most important. Yet<strong>the</strong> IPCC in 2001 [IPCC-TAR, p. 716] still quoteda paper that maintains <strong>the</strong> cause was anthropogenic.That analysis [Wigley et al. 1998] was based on anidiosyncratic statistical approach that has beencriticized as spurious. [Tsonis and Elsner 1999]Ano<strong>the</strong>r way to show that this analysis is wrongis to divide <strong>the</strong> data into pre-1935 and post-1935periods, and <strong>the</strong>n apply Wigley’s statistical method.The results for post-1935 correspond to thosederived from an unforced (i.e., no increase in GHgases) model calculation. This is contrary toexpectation and also suggests <strong>the</strong> pre-1935 warmingis not anthropogenic.Conclusion: The claim that man is <strong>the</strong> primarycause of <strong>the</strong> recent warming is not supported byscience. The scientific evidence cited by <strong>the</strong> IPCCis largely contradicted by observations andanalysis.3. Most of Modern Warming Is Due toNatural CausesIf human influences on global climate are minor,what are <strong>the</strong> major influences? There are manycauses of global climate change, each oneprominent depending on <strong>the</strong> time scale considered.On a time scale of decades to centuries, solarvariability may be <strong>the</strong> most important factor. Thereare also natural oscillations of internal origin,especially on a regional scale, that do not appear tobe connected to human causes ei<strong>the</strong>r.! Internal oscillations play a major role inclimate change, yet cannot be forecast.The most prominent natural climate oscillationsare <strong>the</strong> North Atlantic Oscillation (NAO), AtlanticMulti-Decadal Oscillation (AMO), Pacific DecadalOscillation (PDO), and <strong>the</strong> El Niño-Sou<strong>the</strong>rnOscillation (ENSO). The IPCC report describes<strong>the</strong>m well and assigns <strong>the</strong>m to internal oscillationsof <strong>the</strong> atmosphere-ocean system. It is significant,however, that <strong>the</strong>y cannot be forecast byconventional climate models although attempts arebeing made to incorporate <strong>the</strong>m into climateforecasts to improve forecasting skill [Smith 2007;Kerr 2007]. On <strong>the</strong> o<strong>the</strong>r hand, <strong>the</strong>se may be merelyattempts to provide ‘band-aid’ solutions to explain<strong>the</strong> absence of a warming trend since 1998.Tsonis et al. [2007] analyze large-scalecirculation pattern indices, like ENSO, PDO, NAO;<strong>the</strong>y obtain <strong>the</strong> 1976/77 climate shift as due to acombination of <strong>the</strong>se indices and show a future shiftaround 2035.! The role of solar influences on <strong>the</strong> climatecan no longer be neglected.The IPCC has been disingenuous about solarinfluences on <strong>the</strong> climate. Its first report completelyignored solar variability. The IPCC began to takenotice only after <strong>the</strong> pioneering work of Baliunasand Jastrow [1990] and <strong>the</strong> startling correlationbetween twentieth-century temperature andsolar-cycle length, published by Friis-Christensenand Lassen [1991]. Even <strong>the</strong>n, IPCC reports havepersisted up until now in concentrating on solarcyclechanges as ‘total solar irradiance’ (TSI),which are quite small, of <strong>the</strong> order of 0.1 percent[Lean et al. 1995; Willson and Mordvinov 2003].By disregarding or ignoring <strong>the</strong> very much largerchanges of solar ultraviolet [Haigh 1996, 2003] orof <strong>the</strong> solar wind and its magnetic-field effect oncosmic rays and thus on cloud coverage [Svensmark2007a], <strong>the</strong> IPCC has managed to trivialize <strong>the</strong>climate effects of solar variability.The AR4 report reduced <strong>the</strong> IPCC’s alreadytoo-lowsolar impact by about a factor of three sothat it became a mere ~1/13 of <strong>the</strong> anthropogenicinfluence. The IPCC does not discuss or evenreference basic research papers in this field (byVeizer, Shaviv, and, to some extent, Svensmark).Such an omission is difficult to justify in a reportthat claims to be <strong>the</strong> most definitive and inclusiveassessment of knowledge on climate change.However, this neglect may no longer beacceptable. The demonstration of solar influence onclimate is now overwhelming. One of <strong>the</strong> prizeexhibits is seen in Figure 14 [Neff et al. 2001],which summarizes data obtained from a stalagmitefrom a cave in Oman. The carbon-14 variations are11
- Page 1 and 2: Nature, Not Human Activity,Rules th
- Page 3 and 4: ForewordIn his speech at the United
- Page 5 and 6: group of activists wrote the all-im
- Page 7: that action must be taken to reduce
- Page 11: Nature, Not Human Activity, Rules t
- Page 15 and 16: Global and U.S. Mean Surface Temper
- Page 19: verification of the IPCC’s analys
- Page 23 and 24: Lockwood and Fröhlich [2007] have
- Page 25 and 26: Figure 16: A result from the U.S. N
- Page 27 and 28: Sea Level Since Last Glacial Maximu
- Page 29 and 30: It is likely that actual SL observa
- Page 31 and 32: Figure 21: CO 2 levels versus latit
- Page 33 and 34: lamed on global warming. The author
- Page 35 and 36: ates were linearly related to avera
- Page 37 and 38: Estimated Annual Impact on U.S. ofD
- Page 39 and 40: About the ContributorsAnderson, War
- Page 41 and 42: ReferencesAnonymous 1994. IPCC’s
- Page 43 and 44: Keatinge W.R. et al, 2000. Heat rel
- Page 45 and 46: Rahmstorf, S., et al. 2007. Recent
- Page 47 and 48: AcronymsAGW Anthropogenic Global Wa
- Page 49 and 50: Labohm, Hans, Simon Rozendaal, and