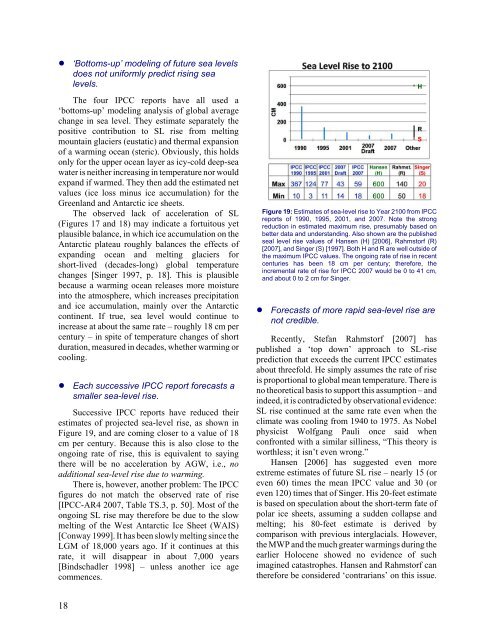
! ‘Bottoms-up’ modeling of future sea levelsdoes not uniformly predict rising sealevels.The four IPCC reports have all used a‘bottoms-up’ modeling analysis of global averagechange in sea level. They estimate separately <strong>the</strong>positive contribution to SL rise from meltingmountain glaciers (eustatic) and <strong>the</strong>rmal expansionof a warming ocean (steric). Obviously, this holdsonly for <strong>the</strong> upper ocean layer as icy-cold deep-seawater is nei<strong>the</strong>r increasing in temperature nor wouldexpand if warmed. They <strong>the</strong>n add <strong>the</strong> estimated netvalues (ice loss minus ice accumulation) for <strong>the</strong>Greenland and Antarctic ice sheets.The observed lack of acceleration of SL(Figures 17 and 18) may indicate a fortuitous yetplausible balance, in which ice accumulation on <strong>the</strong>Antarctic plateau roughly balances <strong>the</strong> effects ofexpanding ocean and melting glaciers forshort-lived (decades-long) global temperaturechanges [Singer 1997, p. 18]. This is plausiblebecause a warming ocean releases more moistureinto <strong>the</strong> atmosphere, which increases precipitationand ice accumulation, mainly over <strong>the</strong> Antarcticcontinent. If true, sea level would continue toincrease at about <strong>the</strong> same rate – roughly 18 cm percentury – in spite of temperature changes of shortduration, measured in decades, whe<strong>the</strong>r warming orcooling.! Each successive IPCC report forecasts asmaller sea-level rise.Successive IPCC reports have reduced <strong>the</strong>irestimates of projected sea-level rise, as shown inFigure 19, and are coming closer to a value of 18cm per century. Because this is also close to <strong>the</strong>ongoing rate of rise, this is equivalent to saying<strong>the</strong>re will be no acceleration by AGW, i.e., noadditional sea-level rise due to warming.There is, however, ano<strong>the</strong>r problem: The IPCCfigures do not match <strong>the</strong> observed rate of rise[IPCC-AR4 2007, Table TS.3, p. 50]. Most of <strong>the</strong>ongoing SL rise may <strong>the</strong>refore be due to <strong>the</strong> slowmelting of <strong>the</strong> West Antarctic Ice Sheet (WAIS)[Conway 1999]. It has been slowly melting since <strong>the</strong>LGM of 18,000 years ago. If it continues at thisrate, it will disappear in about 7,000 years[Bindschadler 1998] – unless ano<strong>the</strong>r ice agecommences.Figure 19: Estimates of sea-level rise to Year 2100 from IPCCreports of 1990, 1995, 2001, and 2007. <strong>Not</strong>e <strong>the</strong> strongreduction in estimated maximum rise, presumably based onbetter data and understanding. Also shown are <strong>the</strong> publishedseal level rise values of Hansen (H) [2006], Rahmstorf (R)[2007], and Singer (S) [1997]. Both H and R are well outside of<strong>the</strong> maximum IPCC values. The ongoing rate of rise in recentcenturies has been 18 cm per century; <strong>the</strong>refore, <strong>the</strong>incremental rate of rise for IPCC 2007 would be 0 to 41 cm,and about 0 to 2 cm for Singer.! Forecasts of more rapid sea-level rise arenot credible.Recently, Stefan Rahmstorf [2007] haspublished a ‘top down’ approach to SL-riseprediction that exceeds <strong>the</strong> current IPCC estimatesabout threefold. He simply assumes <strong>the</strong> rate of riseis proportional to global mean temperature. There isno <strong>the</strong>oretical basis to support this assumption – andindeed, it is contradicted by observational evidence:SL rise continued at <strong>the</strong> same rate even when <strong>the</strong>climate was cooling from 1940 to 1975. As Nobelphysicist Wolfgang Pauli once said whenconfronted with a similar silliness, “This <strong>the</strong>ory isworthless; it isn’t even wrong.”Hansen [2006] has suggested even moreextreme estimates of future SL rise – nearly 15 (oreven 60) times <strong>the</strong> mean IPCC value and 30 (oreven 120) times that of Singer. His 20-feet estimateis based on speculation about <strong>the</strong> short-term fate ofpolar ice sheets, assuming a sudden collapse andmelting; his 80-feet estimate is derived bycomparison with previous interglacials. However,<strong>the</strong> MWP and <strong>the</strong> much greater warmings during <strong>the</strong>earlier Holocene showed no evidence of suchimagined catastrophes. Hansen and Rahmstorf can<strong>the</strong>refore be considered ‘contrarians’ on this issue.18
It is likely that actual SL observations within<strong>the</strong> next few years will show such extreme estimatesto be wrong. It is ironic that Hansen, Rahmstorf, andsome o<strong>the</strong>rs have attacked <strong>the</strong> IPCC as being tooconservative [Rahmstorf et al. 2007] and relying onconsensus [Oppenheimer et al. 2007].6. Do Anthropogenic GreenhouseGases Heat <strong>the</strong> Oceans?In 2005, Hansen announced he had found <strong>the</strong>‘smoking gun’ for anthropogenic warming bycomparing <strong>the</strong> published increasing rate of oceanheat storage (during a selected time period) with anassumed energy imbalance at <strong>the</strong> top of <strong>the</strong>atmosphere [Hansen 2005]. There are many thingswrong with this analysis.Obviously, sea surface temperature (SST) has toincrease before heat can be stored in <strong>the</strong> deep ocean.We know SST increased pre-1940, thus presumablyadding stored heat to <strong>the</strong> ocean, yet few reallybelieve <strong>the</strong> cause of that warming wasanthropogenic, because it occurred well before <strong>the</strong>large-scale use of fossil fuels. Hansen’s analysis hasbeen additionally invalidated by <strong>the</strong> finding that <strong>the</strong>heat storage data are over-estimated by a largefactor [Gouretski and Koltemann 2007] and byrecent observations that heat storage stoppedincreasing in <strong>the</strong> past few years [Lyman 2006,Willis 2007].A more fundamental issue is <strong>the</strong> degree towhich greenhouse effects contribute to SST.According to basic physics, <strong>the</strong> ‘complex refractiveindex’ of water in <strong>the</strong> infrared (IR) region results inIR radiation being absorbed within a thickness of<strong>the</strong> order of only 10 microns. However, <strong>the</strong> GHeffect depends on IR radiation, downwelling from<strong>the</strong> atmosphere towards <strong>the</strong> surface, being absorbed,and <strong>the</strong>n adding to <strong>the</strong> normal heating by <strong>the</strong> Sun’svisible radiation (Figure 20). But if thisdownwelling radiation (DWR), emanating fromatmospheric GH gases and from clouds, iscompletely absorbed in <strong>the</strong> ‘skin’ of <strong>the</strong> ocean, whathappens to <strong>the</strong> absorbed energy? How much isre-radiated? How much is used to increaseevaporation?The problem is to find out how much of <strong>the</strong>energy is transmitted to <strong>the</strong> bulk layer beneath <strong>the</strong>skin in order to help warm <strong>the</strong> ocean [Singer 2005a,b; Singer 2006]. Peter Minnett [2006] believes hisdata show that all of <strong>the</strong> DWR energy contributes tosea surface temperature (SST); o<strong>the</strong>rs are less sure.One doesn’t see any way of answering <strong>the</strong>sequestions definitively, except perhaps by directmeasurements under different conditions of sea stateand surface ripples.One would measure <strong>the</strong> DWR, <strong>the</strong> upwelling IRfrom <strong>the</strong> skin, and <strong>the</strong> detailed temperaturedistribution just below <strong>the</strong> skin, and record <strong>the</strong>changes as <strong>the</strong> amount of DWR varies. Since wecannot wait for a change in CO 2 , we could measure<strong>the</strong> effect of a cloud or o<strong>the</strong>r IR-emitting surface onour experimental setup.Energy Inputs to Sea SurfaceFigure 20: Cartoon showing <strong>the</strong> absorption of downwellinginfrared radiation (from greenhouse gases and clouds) withina ~10-micron ‘skin’ of <strong>the</strong> ocean. It is not known how much ofthis greenhouse energy contributes to sea surfacetemperature, and how much goes into re-radiation andevaporation. <strong>Not</strong>e <strong>the</strong> buoys are located in <strong>the</strong> warmest part of<strong>the</strong> ‘mixed layer’ of <strong>the</strong> ocean; <strong>the</strong>refore, <strong>the</strong> increasingadmixture of buoy data since 1980 could result in a calculatedrise of sea surface temperature that is an artifact of <strong>the</strong> datahandling procedure.In response to <strong>the</strong> claim that <strong>the</strong> observed rise inocean temperatures provides an empirical solutionto this problem, we must consider <strong>the</strong> possibilitythat <strong>the</strong> observed temperature rise is partly anartifact of <strong>the</strong> method of measurement. Aspreviously observed, in <strong>the</strong> past 25 years, drifterbuoys have become predominant in supplying SSTdata. But <strong>the</strong>y measure temperatures within a fewcentimeters of <strong>the</strong> surface, where solar heating is amaximum (during <strong>the</strong> day) whereas ships (<strong>the</strong>previous method of measuring ocean temperatures)measure temperatures a few meters below <strong>the</strong>19
- Page 1 and 2: Nature, Not Human Activity,Rules th
- Page 3 and 4: ForewordIn his speech at the United
- Page 5 and 6: group of activists wrote the all-im
- Page 7: that action must be taken to reduce
- Page 11: Nature, Not Human Activity, Rules t
- Page 15 and 16: Global and U.S. Mean Surface Temper
- Page 19 and 20: verification of the IPCC’s analys
- Page 21 and 22: ! Global warming prior to 1940 was
- Page 23 and 24: Lockwood and Fröhlich [2007] have
- Page 25 and 26: Figure 16: A result from the U.S. N
- Page 27: Sea Level Since Last Glacial Maximu
- Page 31 and 32: Figure 21: CO 2 levels versus latit
- Page 33 and 34: lamed on global warming. The author
- Page 35 and 36: ates were linearly related to avera
- Page 37 and 38: Estimated Annual Impact on U.S. ofD
- Page 39 and 40: About the ContributorsAnderson, War
- Page 41 and 42: ReferencesAnonymous 1994. IPCC’s
- Page 43 and 44: Keatinge W.R. et al, 2000. Heat rel
- Page 45 and 46: Rahmstorf, S., et al. 2007. Recent
- Page 47 and 48: AcronymsAGW Anthropogenic Global Wa
- Page 49 and 50: Labohm, Hans, Simon Rozendaal, and