Gabrielle Thongs - CDEMA
Gabrielle Thongs - CDEMA
Gabrielle Thongs - CDEMA

You also want an ePaper? Increase the reach of your titles
YUMPU automatically turns print PDFs into web optimized ePapers that Google loves.
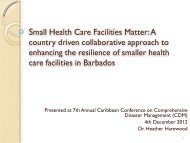
Building Self‐reliance in GIS‐based RiskMapping in the Caribbean OverseasCountries and Territories (OCTs):Approaches and Lessons Learnt<strong>Gabrielle</strong> <strong>Thongs</strong> MSc,Jacob Opadeyi, PhD, and Melanie Harris.UWI, St Augustine&Lavern Rogers-RyanPhysical Planning Department, Montserrat 1
The Caribbean’s Vulnerability• The Caribbean region is vulnerable to a number ofnatural disasters.• The diversity of this region’s spatial location,population density and distribution, geology,topography and climate have resulted in elevatedvulnerability levels to hurricanes, floods, droughts,earthquakes, tsunamis, and landslides.• The impacts of each these natural disasters events haveresulted in the decrease of economic growth andinjury or death of citizens of the Caribbean.
The Caribbean’s Vulnerability• As the complexity, frequency, and severity of thesedisasters gradually increase, there is a growingrealization that it is insufficient to address the risksolely in the response and recovery phases.• The momentum for change was spurred largely bythe cost of disasters of the last decade.• Being able to analyse, and anticipate the effects ofdisasters through modelling is a key component inreducing susceptibility.
Basic PointsGIS & Disaster Management• GIS technology provides a robust approach to hazardmapping, vulnerability assessment and risk mapping throughthe integration of data, models and local knowledge.• The technical know‐how in the design, development and useof GIS technology is yet not readily available to disastermanagers in the British and Dutch Caribbean Overseasterritories (COTs).• Through the R3i projects, a concerted effort was made toensure that GIS capacity building and enhancement is aconcrete outcome of the project
Learning by Doing Approach –R3i Model• In order to achieve this outcome, an innovativeteaching approach of learning‐by‐doing wasdeveloped.• A mix of in‐country and regional learning moduleswere designed and delivered to the disastermanagers.• Learning was put into practice by actual projectsdesigned to build self‐reliance.
Capacity Building Goals• Increased capacity in hazard mapping andassociated vulnerability assessments, to furtherbe incorporated into spatial information systemsto inform planning and development processes• Local capacities to develop and implementmitigation strategies be strengthened throughthe provision of tools (spatial data infrastructureand models) and best practices to supportcomprehensive disaster risk management.
Capacity Building Goals• To provide relevant national agencies withresponsibilities for disaster risk management(preparation, mitigation, response andrecovery) with risk information tools and data(hazard maps and vulnerability assessments)and a GIS framework for use in their dailywork, and develop their capacity to managerisk information data
The ApproachesLearning bydoingMulti‐agency,multidiscplinaryRegional andcountry leveltrainingCountry‐specificexamples andexercises
Results from Hazard Identification & PrioritizationWorkshop
Results from Hazard Identification & PrioritizationWorkshop
Results from Hazard Identification & PrioritizationWorkshop
Data Required to Build the Hazard ModelData Required to Build the Hazard ModelHazard Data required to Build Model AvailableRoads√Rivers√Flood past occurrence data√SoilsxFloodLand CoverxRainfall Flow RatexRainfall Intensity & VelocityxCross section survey of riversx3d topographical survey of flood plainsxHigh resolution digital elevation modelsxRoads√Rivers√Sea Level Rise BathymetryxTidal dataxHigh resolution DEMx
Data Required to Build the Hazard ModelHazard Data required to Build Model AvailableRoads√Rivers√Tsunamis BathymetryxTidal dataxHigh resolution DEMxRoads√Rivers√Storm Surge BathymetryxTidal dataxHigh resolution DEMx
5. Building GISApplications inSUpport ofDIsaster RiskManagement1. Introductionto GIS conceptsand applicationsin hazardmapping andvulnerabilityassessmentSelf‐reliancein GIS‐basedRiskMapping2. Field datacollectionusingintegratedGPS/GISsystems4. Featureextractionfrom satelliteimagery3. Editingandmanagingspatial data15
Introduction to GIS Concepts and its Applications in HazardMappingParticipants –20 participants 9 islandsLearning Outcomes• To expose participants to the use of GIS concepts andapplication in Disaster Risk Management.• To explore how GIS applications are built in supportof landslide/flood risk modelling.• To provide participants with an appreciation ofresources required and challenges in the use ofgeoinformatics in support of hazard mapping andvulnerability assessment.
Regional Training Workshop 2:Field Data Collection Using Integrated GPS/GIS system• Participants ‐ Twenty‐two (22) participants fromten (10) islandsLearning Outcome• To expose participants to the use of GPS/GISequipment• To explore how participants how to use GPS/GISfor rapid field data collection on critical facilities• To provide participants with an appreciation ofhow to use GPS/GIS for incident mapping.
Regional Training Workshop 3:Editing and managing spatial dataTwenty‐five (25) participants from ten (10) islands• Learning Outcome• To expose participants to the use of GIS systems• To explore how to use GIS for building, managingand editing spatial data• To provide participants with an appreciation ofhow to use GIS for hazard mapping
Workshop Output:23
Regional Training Workshop 4: FeaturesExtraction from Satellite Images• Twenty‐five (25) participants from ten (10) islandsLearning Outcome• Understand the electromagnetic spectrum, and how itapplies to remote sensing.• Interpret the basic features and characteristics of earthsurfaces on satellite imagery.• Know how to extract and interpret information fromremotely sensed data.
Workshop Output26
Emergency Management and Response PlanningUsing GIS/GPSAt the end of the training, participants were able to:• Use Microsoft Access to build an Incidentsorienteddatabase• Use ArcCatalog and ArcPad to link the Accessdatabase to a Juno mobile unit• Use Juno to map incidents• Use ALOHA to evaluate calculate the evacuationzone necessary for an incident• Use Network Analysis to compute the bestevacuation route from an incident.
Workshop 5B: Coastal Risk AssessmentLearning Outcomes• Use Microsoft Access to build an Incidents‐oriented database• Use ArcCatalog and ArcPad to link the Access database to a Junomobile unit• Use Juno to map incidents• Identify vulnerable population• Identify susceptible coastal zones• Use ALOHA to evaluate calculate the evacuation zone necessary foran incident• Use Network Analysis to compute the best evacuation route andshelter from an incident.
The Challenges• The design and delivery of training workshops in a multiislandenvironment poses the following challenges:• Availability of adequate training facilities and equipment ineach island• Coping with learners with varying levels of skills• Identifying local knowledge champions who may beconsidered as a trainer to be used to propagate theknowledge transferred in their respective island.• The ability of participants to use the knowledge gainedimmediately after the training• The logistic night mare of organising regional workshops
Conclusion• In terms of reach, the R3i project was able toenhance the capacity of several persons fromthe participating states who on their own maynot be able to have access to the trainingworkshops offered.
Acknowledgement