Robust Object Segmentation using Split and Merge - East West ...
Robust Object Segmentation using Split and Merge - East West ...
Robust Object Segmentation using Split and Merge - East West ...

You also want an ePaper? Increase the reach of your titles
YUMPU automatically turns print PDFs into web optimized ePapers that Google loves.
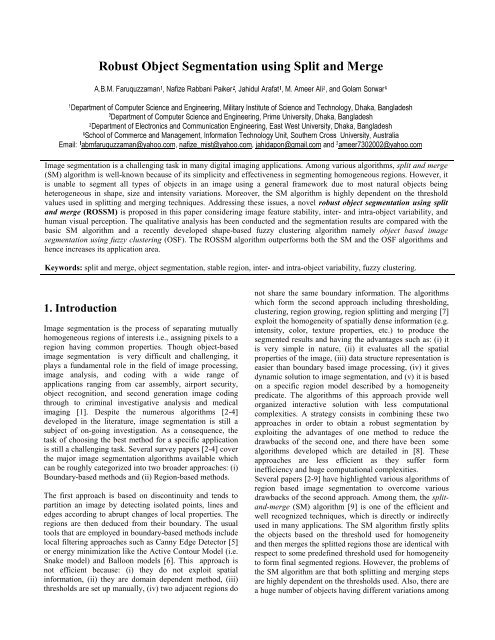
<strong>Robust</strong> <strong>Object</strong> <strong>Segmentation</strong> <strong>using</strong> <strong>Split</strong> <strong>and</strong> <strong>Merge</strong>$%0)DUXTX]]DPDQ 1DIL]H5DEEDQL3DLNHU -DKLGXO$UDIDW 0$PHHU$OL DQG*RODP6RUZDU 'HSDUWPHQWRI&RPSXWHU6FLHQFHDQG(QJLQHHULQJ0LOLWDU\,QVWLWXWHRI6FLHQFHDQG7HFKQRORJ\'KDND%DQJODGHVK 'HSDUWPHQWRI&RPSXWHU6FLHQFHDQG(QJLQHHULQJ3ULPH8QLYHUVLW\'KDND%DQJODGHVK 'HSDUWPHQWRI(OHFWURQLFVDQG&RPPXQLFDWLRQ(QJLQHHULQJ(DVW:HVW8QLYHUVLW\'KDND%DQJODGHVK 6FKRRORI&RPPHUFHDQG0DQDJHPHQW,QIRUPDWLRQ7HFKQRORJ\8QLW6RXWKHUQ&URVV8QLYHUVLW\$XVWUDOLD(PDLO DEPIDUXTX]]DPDQ#\DKRRFRP QDIL]HBPLVW#\DKRRFRP MDKLGDSRQ#JPDLOFRP DQG DPHHU#\DKRRFRPImage segmentation is a challenging task in many digital imaging applications. Among various algorithms, split <strong>and</strong> merge(SM) algorithm is well-known because of its simplicity <strong>and</strong> effectiveness in segmenting homogeneous regions. However, itis unable to segment all types of objects in an image <strong>using</strong> a general framework due to most natural objects beingheterogeneous in shape, size <strong>and</strong> intensity variations. Moreover, the SM algorithm is highly dependent on the thresholdvalues used in splitting <strong>and</strong> merging techniques. Addressing these issues, a novel robust object segmentation <strong>using</strong> split<strong>and</strong> merge (ROSSM) is proposed in this paper considering image feature stability, inter- <strong>and</strong> intra-object variability, <strong>and</strong>human visual perception. The qualitative analysis has been conducted <strong>and</strong> the segmentation results are compared with thebasic SM algorithm <strong>and</strong> a recently developed shape-based fuzzy clustering algorithm namely object based imagesegmentation <strong>using</strong> fuzzy clustering (OSF). The ROSSM algorithm outperforms both the SM <strong>and</strong> the OSF algorithms <strong>and</strong>hence increases its application area.Keywords: split <strong>and</strong> merge, object segmentation, stable region, inter- <strong>and</strong> intra-object variability, fuzzy clustering.1. IntroductionImage segmentation is the process of separating mutuallyhomogeneous regions of interests i.e., assigning pixels to aregion having common properties. Though object-basedimage segmentation is very difficult <strong>and</strong> challenging, itplays a fundamental role in the field of image processing,image analysis, <strong>and</strong> coding with a wide range ofapplications ranging from car assembly, airport security,object recognition, <strong>and</strong> second generation image codingthrough to criminal investigative analysis <strong>and</strong> medicalimaging [1]. Despite the numerous algorithms [2-4]developed in the literature, image segmentation is still asubject of on-going investigation. As a consequence, thetask of choosing the best method for a specific applicationis still a challenging task. Several survey papers [2-4] coverthe major image segmentation algorithms available whichcan be roughly categorized into two broader approaches: (i)Boundary-based methods <strong>and</strong> (ii) Region-based methods.The first approach is based on discontinuity <strong>and</strong> tends topartition an image by detecting isolated points, lines <strong>and</strong>edges according to abrupt changes of local properties. Theregions are then deduced from their boundary. The usualtools that are employed in boundary-based methods includelocal filtering approaches such as Canny Edge Detector [5]or energy minimization like the Active Contour Model (i.e.Snake model) <strong>and</strong> Balloon models [6]. This approach isnot efficient because: (i) they do not exploit spatialinformation, (ii) they are domain dependent method, (iii)thresholds are set up manually, (iv) two adjacent regions donot share the same boundary information. The algorithmswhich form the second approach including thresholding,clustering, region growing, region splitting <strong>and</strong> merging [7]exploit the homogeneity of spatially dense information (e.g.intensity, color, texture properties, etc.) to produce thesegmented results <strong>and</strong> having the advantages such as: (i) itis very simple in nature, (ii) it evaluates all the spatialproperties of the image, (iii) data structure representation iseasier than boundary based image processing, (iv) it givesdynamic solution to image segmentation, <strong>and</strong> (v) it is basedon a specific region model described by a homogeneitypredicate. The algorithms of this approach provide wellorganized interactive solution with less computationalcomplexities. A strategy consists in combining these twoapproaches in order to obtain a robust segmentation byexploiting the advantages of one method to reduce thedrawbacks of the second one, <strong>and</strong> there have been somealgorithms developed which are detailed in [8]. Theseapproaches are less efficient as they suffer forminefficiency <strong>and</strong> huge computational complexities.Several papers [2-9] have highlighted various algorithms ofregion based image segmentation to overcome variousdrawbacks of the second approach. Among them, the split<strong>and</strong>-merge(SM) algorithm [9] is one of the efficient <strong>and</strong>well recognized techniques, which is directly or indirectlyused in many applications. The SM algorithm firstly splitsthe objects based on the threshold used for homogeneity<strong>and</strong> then merges the splitted regions those are identical withrespect to some predefined threshold used for homogeneityto form final segmented regions. However, the problems ofthe SM algorithm are that both splitting <strong>and</strong> merging stepsare highly dependent on the thresholds used. Also, there area huge number of objects having different variations among
them. For these reasons, the SM algorithm is unable tosegment all types of objects in an image within its generalframework. To address the above mentioned limitations<strong>and</strong> with the aim of generalizing the SM algorithm, thispaper presents a new algorithm called robust objectsegmentation based on split <strong>and</strong> merge (ROSSM) takinginto account the image feature stability, inter- <strong>and</strong> intraobjectvariability, <strong>and</strong> human perception. In the ROSSMalgorithm, image feature stability is used for splitting theobjects <strong>and</strong> then image feature stability, inter- <strong>and</strong> intraobjectvariability, <strong>and</strong> human perception are considered formerging the splitted regions to form the final segmentedregions (objects). The experiments were conducted fordifferent images having different objects, <strong>and</strong> thesegmented results are compared with the basic SMalgorithm <strong>and</strong> a newly developed shape-based fuzzyclustering algorithm namely object based imagesegmentation <strong>using</strong> fuzzy clustering (OSF) algorithm. Thequalitative analysis shows that the ROSSM algorithmoutperforms both the SM <strong>and</strong> the OSF algorithms.This paper is organized as follows: the literature reviewrelated to the SM <strong>and</strong> the newly developed OSF algorithmsis detailed in Section 2. The supporting literature containingthe theorems applied to the proposed ROSSM algorithm isdescribed in Section 3 while the proposed ROSSMalgorithm is presented in Section 4. The experimentalresults are provided in Section 5 <strong>and</strong> finally Section 6shows some concluding remarks including limitations <strong>and</strong>the future research directions of the proposed ROSSMalgorithm.2. The <strong>Split</strong>-<strong>and</strong>-<strong>Merge</strong> (SM) AlgorithmThe split-<strong>and</strong>-merge (SM) algorithm being developed byPavilidis [9] in 1974 is still one of the most popularclassical image segmentation algorithms <strong>and</strong> widely useddirectly or indirectly in image processing <strong>and</strong> patternrecognition applications due to its simplicity, effectiveness,unsupervision <strong>and</strong> relative cost minimization. The SMalgorithm firstly splits the objects based on the thresholdused for homogeneity <strong>and</strong> then merges the splitted regionsthose are identical with respect to some predefinedthreshold used for homogeneity to form final segmentedregions. Let R <strong>and</strong> P be the entire image <strong>and</strong> the predicaterespectively. If R is a square image, an approach forsegmenting R consists of successively subdividing it intosmaller <strong>and</strong> smaller square regions so that, for any regionR i⊂ R, P(Ri ) = TRUE. That is, if P(R i )= FALSE; R i has tobe newly subdivided <strong>and</strong> so on. To satisfy the constraints in(a) to (c) given below only the predicate P is required forboth splitting <strong>and</strong> merging regions. The two adjacentregions R i <strong>and</strong> R k will be merged if P(R j∪ Rk )= TRUE.The basic SM algorithm can be summarized by thefollowing steps:(a) split any region R i into four almost equal regionswhere P(R i ) = FALSE.(b) merge any adjacent regions R i <strong>and</strong> R j for whichP(R i ∪ R j ) =TRUE.(c) stop when no further merging or splitting ispossible. Otherwise repeat steps (a) <strong>and</strong> (b).The major difficulties in the above mentioned SM algorithmare: (i) it is difficult to identify the suitable feature either tosplit a region into two or more sub-regions or to merge tworegions to form a final segmented region, (ii) it is highlydependent on the feature <strong>and</strong> the threshold used, (iii) the SMalgorithm only provides a locally optimal solution, but not aglobal one, (iv) there is no proper method for accuratefeature selection, (v) computational time complexity is high,(vi) parallel implementation is also difficult due tointerdependencies of splitted regions, <strong>and</strong> (vii) smoothnessof the image boundary in not maintained..Based on the SM algorithm proposed in [9] different modelhave been developed to address the some of the abovementioned limitations. SM modeling depends on themerging criteria for its constituent regions. A mergingcriterion consists of two parts including (i) a region model:describing each image region with a set of features, <strong>and</strong> (ii)a dissimilarity measure: defining a metric on the features ofthe region model. The range of possible region modelsincludes from simple models like uniform intensity valuesup to texture, shape or motion parameters. The better aregion model matches the real image-data, the longer theminimum edge-weights remain small <strong>and</strong> the steeper is therelative increase as soon as the segmentation has reached itsfinal state. This makes the segmentation process morerobust to the selection of the fixed threshold for the stoppingcondition. Few region models such as Mean Gray LevelDifference, Ward’s Criterion, Mean/Ward Mixture, Linear-Intensity Model <strong>and</strong> Border Criterion are discussed in[10]. For the sake of completeness, a comparative study ofthese models is presented in the next section.2.1 Comparison of Region ModelsWard-criterion considers the total error <strong>and</strong> the smalldifferences in very large regions outweigh largerdifferences in very small regions. The Mean criterion doesnot show this effect, because it does not take region sizeinto account. The Linear-Intensity can adapt its model toapproximate the gradient with sufficient accuracy.Furthermore, it is also capable of modeling the unsharpedge itself <strong>and</strong> does not lead to the over segmentation withmany narrow regions.Figure 1 shows the visual comparison of those models. Itcan be seen that neither model gives a better nor acceptableresult since each of them considers only one criterion whileobjects attributes or characteristics varies from image toimage. To get an efficient <strong>and</strong> robust result from thisdynamic image domain, an optimal consideration ofmultiple criteria for the same image can be considered as analternative.
Addressing the performance abilities <strong>and</strong> shortcomings ofthe aforementioned modified SM algorithm mentioned inSection 2, a new algorithm namely robust objectsegmentation based on split <strong>and</strong> merge (ROSSM) isproposed in this paper. The proposed ROSSM algorithmuses the concept of multistage SM technique discussed insection 2.3 to be robust in segmenting objects in an imagedynamically. It uses T-test for both splitting <strong>and</strong> mergingregions. Besides, it considers intra-region varianceminimization <strong>and</strong> intra-region variance maximizationthroughout the merging process to maintain the objectsidentity. It also takes into account the human visualperception limitation to maintain the realistic shapes of theidentified objects. These concepts are highlighted in thenext sections.3.1. Region Stability TestThere are many theorems to identify region stability such asZ-test, T-test <strong>and</strong> Chi-square test [16]. Among them, T-testis considered in this paper because of its universalacceptance <strong>and</strong> well recognition as statistical theorem toidentify the stability of a sample space from its samplevalues. Let S be a sample space <strong>and</strong> s be a set of samplessuch that s ∈ S . Applying T-test, it can be identifiedwhether the sample set s is stable within its sample space Sor not [16]. For large sample set (over 30 samples), the95% fiducial limits of population mean are given byX ± t0.05SE<strong>and</strong> 99% fiducial limits of population meanare given by ± t SE where the st<strong>and</strong>ard error of meanSE XX0. 01with0. 05σn= (1)t =1.96 <strong>and</strong> t0. 01=2.58 [16].For small sample set (less than 30 samples), the decisiondepends on the value of t which is given by the followingequation:X − µt = n(2)Swhere X = mean of the sample, µ = mean of thepopulation, n = size of the sample, <strong>and</strong> S = St<strong>and</strong>ardDeviation of the sample. The 95% fiducial limits ofSpopulation mean are given by X ± t 0. 05while then99% fiducial limits of population mean are given byX ±Snt 0.01. Depending on the degree of freedom, thevalue of t0.05varies from 12.71 to 2.04 <strong>and</strong> for t0.01from63.66 to 2.75 while the degree of freedom for small sampleis given by n-1 <strong>and</strong> for large sample it is infinity [16]. Thistheorem is used to compute the feature values in theROSSM algorithm for both split <strong>and</strong> merge stages. Thistheorem solves the problem of feature selection anomaliesof the SM algorithm as T-test ensures the region stability interms of any features such as pixel intensity.3.2. Intra-variance <strong>and</strong> Inter-variance TestThe optimization of the proposed ROSSM algorithm leadsto produce regions having less intra-variance <strong>and</strong> moreinter variances. Hence, the global solution can be achievedif the intra-<strong>and</strong> inter-variance test is applied.In the image segmentation domain, the number of clustersis not given a priori. Since, the number of clusters insegmentation algorithm is neither fixed nor manuallyprovided, the minimization of the intra-region variability<strong>and</strong> the maximization of the inter-region variability in theunion of two regions are considered [11]. However, boththe straight minimization of the intra-region variability <strong>and</strong>the maximization of the inter-region variability lead toundesirable trivial solutions being N regions or 1 regionrespectively. ROSSM minimizes the intra- regionvariability while at the same time constraining the interregionvariability in the union of two regions. The regionbehind such condition is - if two regions belong to singleobject, their intensities should be similar <strong>and</strong> as a resulttheir combined variability should be minimal. On the otherh<strong>and</strong>, when one of nearly intensified region disappears dueto merging, the verity of variance is increased while thenumber of the regions is decreased. This leads tomaximization of intra-region variability. Because of thisinterrelationship, the features perform well. In this way, theinter-region variability constraint defines the scale at whichtwo regions can be differentiated from each other. Tominimize the intra- region variability, the sum-of-squarederrorcriterion is used such that it fits better to the model.Further, it implements the joint intra-region variabilityconstraint as a minimum variance for the union of twoclusters. At the same time, joining two clusters maximizesthe inter-cluster variability. This leads to the followingregion growing model:min ∑RR i ∈ Rn Var(R )where niis the number of pixels in region i, Var(R i ) is thevariance of the region isubject to:1Var(Y) = ∑ || x −Y∀Ri, Rj, i ≠ j;MaxVar(R −{R , R } ∪ ( Rwhere MaxVar(R)=Var(Var(R k ))ijiii
neighbor <strong>and</strong> merging any two regions R i <strong>and</strong> R j decreasesthe inter-variance of the image. After application of this test,the stable regions that have minimum variance withinthemselves are obtained. At the same time, their inter-regionvariances are maximized. This test allows finding a globalsolution where the threshold is dynamically updated therebyto eliminate the problems of result anomalies due tothreshold change. However, there are some rare situations inwhich individual cluster can violate these constraints [11].3.3. Concept of Human PerceptionIf the change of any object or feature is less than or equal to0.5dB, human perception is unable to detect the change[17]. Now, let the larger region be R l <strong>and</strong> the smaller regionbe R s . Presence of R s collocated to R l creates distortion. Theregions R s with R l will be merged considering them belongsto the same object if they satisfy the following equation:Rl0.5=20logRs0.5⇒ anti-log( )20Rl⇒ 1.059=R( )=sRlRs⇒ R l =1.059R s (4)Referring (4), it can then be said that for any twoneighboring regions, if the size of one region is less than orequal to 6% of another one, human perception cannotdifferentiate these two regions. This concept can be used toallow the SM to identify any non-patterned shaped objectaccurately without any distortion.4. Proposed ModelTo enhance the performance of segmentation process <strong>and</strong> toaddress the drawbacks of the SM algorithm mentioned inSection 2, this section presents a newly developed robustobject segmentation based on split <strong>and</strong> merge (ROSSM)algorithm based on the basic idea of the SM algorithm. Themain two constituent parts of the ROSSM algorithm are: (i)split stage, <strong>and</strong> (ii) merge stage. Since the splitting is thefirst step of the proposed ROSSM algorithm, it is detailed inthe next section.4.1. <strong>Split</strong> StageIn the split stage, it recursively subdivides a larger regioninto almost equally four sub-regions based on the thresholdvalue which is calculated applying T-test <strong>and</strong> its 95%fiducially limit. This fiducially limit ensures the regionstability. Let R i be a larger region at any instant of splitstage. If the P(R i )=FALSE as mentioned in Section 2, itsub-divides the region R i into four almost equal sub-regionR j where j=1,2, …,4. The idea behind this method is thatsplit stage of it partitions the whole image into numeroussmall regions. The main characteristics of each splittedregion are that they are individually stable in nature asmentioned in Section 3. They may either be a full object ora small part of a full object (i.e. a leaf of 3 intensity levelmay be represented as 3 regions in this stage). In this stagean image is spitted into number of sub-regions, for exampleas shown in the Figure 3. After splitting the image into alarge number of smaller regions, it needs to merge thesplitted regions to form final segmented regions <strong>and</strong> themerge stage is detailed in the next section.(a)(b)Figure 3: (a) Original image, (b) <strong>Split</strong>ted regions of (a)4.2. <strong>Merge</strong> StageThe merge stage of the proposed ROSSM algorithmcontains three main constituent parts which are applied onlyon the connected regions <strong>and</strong> that are: (i) merging on thebasis of T-test, (ii) merging for inter-variance maximization<strong>and</strong> intra-variance minimization, <strong>and</strong> (iii) merging regionsconsidering human perception. Since the merging of regionson the basis of region stability is the first step of theproposed ROSSM algorithm, it is detailed in the nextsection.4.2.1. Merging on the basis of stability testAny two connected regions are qualified to be merged ifthey are both stable i.e., these two regions are within the99% fiducially limit of T-test. The idea behind this mergingis to combine those parts of an object which wereunexpectedly separated due to hard partitioning in the splitstage. Moreover, if two connected regions having aminimum combined intra variance are chosen for mergingto form a larger region, the merging would be more fruitful.This issue is already discussed in section 3.2. This processwill continue until any region satisfies to be merged underthe criteria of T-test. After completion of merging on thebasis of T-test, regions obtained are stable in nature. Theymay either be a full object or a stable part of an object. Atthis stage, there may exist some stable parts of objectswhich are not still merged. To merge these components ofobjects, the following technique is applied.4.2.2. Merging for Inter-variance Maximization <strong>and</strong>Intra-variance Minimization
As mentioned above, there may remain some stable regions,each of which is composed of pixels representing any stablepart of an object (e. g., a h<strong>and</strong>, hair, etc of a man). As thereexists a huge number of objects having different variationsamong them, these objects are only differentiable if theyhave different appearance <strong>and</strong> visually distinct from eachother. A stable region will be a part of an object if thecombined variance of the object <strong>and</strong> the correspondingregion is minimal in comparison with other neighboringobjects. Thereby, in the overall image, the inter-variance ofobject is maximal as they are distinctive from each others.This idea is applied on the remaining regions that need to bemerged. This task terminates when no more region can bemerged under this criteria. Thus it has almost identified realobjects that need to be segmented due to having distinctivevisual identity as an object. After applying merging <strong>using</strong> t-test <strong>and</strong> intra- <strong>and</strong> inter variance, there still may be someparts of object segmented as the separate objects <strong>and</strong> hencemerging <strong>using</strong> human visual perception is applied which ispresented in the next section.4.2.3. Merging regions considering human perceptionEven though the splitted regions are merged applying firstlyT-test <strong>and</strong> then inter- <strong>and</strong> intra-variance, this may producesome parts of an object as a separate region, <strong>and</strong> thatmotivated to consider the human perception for merging asthe final merging step of the proposed ROSSM algorithm.Referred to Section 3.3, it can be said that if the change ofany object or feature is less than or equal to 0.5dB, humanvisual perception is unable to detect the change [17].Considering the change of size in light of the abovetheorem, it can be stated that when any two connectedregions are found where the size of any one object is lessthan or equal to 6% of other, these two regions are mergedto form a single region as a segmented object. This conceptis applied at the last step of merging to merge smaller stableregions with their neighboring connected larger region toavoid hedge on the boundary of the identified objects. Thisresults in better shape <strong>and</strong> look of identified objects. At thesame time it prevents the ROSSM algorithm frommisleading to falsely identify a region as an object which isactually not an object. Now the formal ROSSM algorithm ispresented in the next section.4.3. The ROSSM algorithmThe proposed ROSSM algorithm is detailed in Algorithm 1.Formally presenting the ROSSM algorithm, let a segmentedimage (R) is defined by a set of regions R ={R 1, R 2 ,…..R n },where n>0 <strong>and</strong> each region R i is organized as R i ={X i, i}where X i ={x i1, x i2 ,x i3 ……….x id }, d>0, x ij is the intensity of athj pixel in the ith region <strong>and</strong> i ={n i ,µ i ,Var i }is a set ofnumber of pixels, mean <strong>and</strong> variance (calculated <strong>using</strong> (3))respectively of region i. Firstly, the image R (i.e., objects tobe segmented) is recursively splitted into its constituent subregionsbased on the theory presented in Section 3.1 if thepredicate P(R i ) is FALSE (Step 1) <strong>and</strong> the process will stopwhen no more regions can be splitted further. When thepredicate of a region R i is to be evaluated following tasksare performed:(1) The region R i is divided into 4 almost similarsized sub-regions based on their size. Let they areR i, R i2 , R i3, <strong>and</strong> R i4 .(2) For each sub region st<strong>and</strong>ard error (SE) iscalculated as:σSE = where σ is the st<strong>and</strong>ardndeviation <strong>and</strong> n is the number of pixels in that subregion.(3) For each sub-region the mean difference fromthe region’s mean value is calculated asdiff= i| µ − µ |where i= 1, 2,..., no of regions.SEdiff(4) For each sub-region it checks ≥1. 96 .Ifit is true then the region R i is not stable <strong>and</strong> subjectto be splitted.For all the splitted regions, the minimum weightedcombined variance of the region R j with its connectedregions are checked for merging by T-test. Number ofpixels in the region is used as the weight of combinedvariance, <strong>and</strong> after each merging operation region numbers,connectivity <strong>and</strong> their parameters are updated accordingly.All the new regions undergo the same process repeatedly tillany more region can be merged (Step 3) applying T-test fortesting the stability of regions as mentioned in Section 3.1.Here SE <strong>and</strong> diff is calculated for R k {R k =(R i UR j )}. IfSE< 2.58 is true, they are combinely stable <strong>and</strong> subjectdiffto be merged. The process will stop when no more regionscan be merged further. Now, the variance of each region iscalculated. If V i be the variance of region R i where i =1, 2,3,…d <strong>and</strong> d=number of the regions, then2⎛ ∑ Vj ⎞1 ⎜ j ⎟MaxVar = ∑ ⎜V− (Step 4). As theid⎟id⎝ ⎠merging process may generate some unexpected finalsegmented regions, further merging necessary for thesegmented regions produced in Step 3 considering intravarianceminimization <strong>and</strong> inter-variance maximization. Inthis process, a region R j is subjected to be merged with R i ifit increases the MaxVar value after merging (Step 6). Foreach the region R i , the algorithm checks for its minimumweighted combined variance of regions. R j connected to itfor merging by intra-variance minimization <strong>and</strong> intervariancemaximization test. A region R j is subjected to bemerged with R i if it increases the MaxVar value aftermerging. Let the set of remained region be R ={R i }wherei=1…d. If a sub region R k is going to be merged with R i ,they combinely form a region R x = (R k ∪ R i ). The new
egion is going to be R ={R i } where i=1,2,…,d-1. So thenew MaxVar after merging should be as:1NewMaxVar =d −1∑i( Vi−∑If NewMaxVar > MaxVar, R k <strong>and</strong> Ri will be merged. Themerging process will stop when no more regions can bemerged further. Even though the merging process iscompleted based on T-test <strong>and</strong> variance, the ROSSMalgorithm may still generate some unexpected regions i.e.,part of an object will be segmented as a separate object <strong>and</strong>hence, finally the merging is completed considering thehuman visual perception (Step 8) due to being unable todetect the change if it is within 0.5dB as mentioned inSection 3.3. If the size of R i is 6% or less of the size of R j , R iis merged with R j <strong>and</strong> hence after finishing this process, theROSSM algorithm produces the final segmented results.Algorithm 1: <strong>Robust</strong> object <strong>Segmentation</strong> based on <strong>Split</strong> <strong>and</strong> <strong>Merge</strong>(ROSSM)Precondition: <strong>Object</strong>s to be segmentedPost condition: final segmented regions R1. Recursively <strong>Split</strong> the objects if the predicate P(R i ) =FALSE ∀i2. FLAG=TRUE3. While FLAG3.1. FLAG=FALSE3.2. FOR i =1,2,3,…,Number_Of_<strong>Split</strong>tedRegions3.2.1. j PLQLPXPZHLJKWHGFRPELQHGvariance of regions connected to i)3.2.2. IF T-test(R i, R j, )= TRUE THEN<strong>Merge</strong> R i with R jFLAG=TRUE4. MaxVar YDULDQFHRILQGLYLGXDOUHJLRQVYDULDQFH5. FLAG=TRUE6. While FLAG6.1. FLAG=FALSE6.2. FOR i=1,2,3,…,RemainingRegions6.2.1. j PLQLPXPZHLJKWHGFRPELQHGvariance of regions connected to i)6.2.2. IF merging R i with R j increases theMaxVar value THEN<strong>Merge</strong> R i with R jFLAG=TRUEUpdate MaxVar <strong>using</strong> (5) like STEP 47. FLAG=TRUE8. While FLAG8.1. FLAG=FALSE8.2. FOR i=1,2,3,…,RemainingRegions8.2.1. FOR j DOOWKHUHJLRQVFRQQHFWHGWRi8.2.1.1. IF (|R i |~0.06*|R j |) THEN<strong>Merge</strong> R j with R iFLAG=TRUE5. Experimental ResultsIn analyzing the segmentation performance of the proposedROSSM algorithm, the results of ROSSM were comparedwith the newly developed OSF algorithm [1] <strong>and</strong> the basicjdVj2)(5)SM algorithm [5]. The SM, OSF, <strong>and</strong> the ROSSMalgorithms are implemented <strong>using</strong> MATLAB 7.1. Differentnatural <strong>and</strong> synthetic gray-scale images as well as medicalimages comprising arbitrary shapes <strong>and</strong> orientations havingup to 16 objects in an image were r<strong>and</strong>omly selected foranalysis. The background of each image was removed, sothat only foregrounds of the objects were segmented. Thisnecessitated the manual setting of all background pixels tozero with zero-valued foreground object pixels beingreplaced by 1 to avoid the possibility of foreground pixelsmerging with the background while not impacting uponvisual perception. Representative samples of the manuallysegmented reference regions together with their originalimages are shown in Figures 4 (a)-(b) to 8 (a)-(b). Toprovide an improved visual interpretation of the segmentedresults, both the reference <strong>and</strong> segmented regions aredisplayed in different colours rather than their originalgreyscale intensities. Due to the poorer performance of theSM algorithm in comparison to the OSF algorithm, thesegmentation results of SM are omitted in this paper [19].(a)(b)(c)(d)Figure 4: (a) Original birdbranch image, (b)Reference image of (a), (c)-(d) <strong>Segmentation</strong>results of the OSF <strong>and</strong> the proposed ROSSMalgorithm respectively.The first set of results relates to the birdbranch image isshown in Figure 4(a). It contains two objects, namely theBird (R1) <strong>and</strong> Branch (R2) with both the regions havingdifferent intensity with arbitrarily shaped. The referenceimage <strong>and</strong> the segmentation results of the OSF <strong>and</strong> theROSSM algorithms are shown in Figures 4(b), 4(c) <strong>and</strong>4(d) respectively. It is clear from the Figures (b) <strong>and</strong> (c) thatthe OSF algorithm misclassified some pixels of R2 into R1due to improper initialization <strong>and</strong> scaling of regions duringiterations. On the other h<strong>and</strong>, the ROSSM algorithm clearlyclassified both R1 <strong>and</strong> R2 objects shown in Figure 4(d). It isdue to the fact that T-test is able to detect stable regions <strong>and</strong>hence merging considering T-test, intra-<strong>and</strong> inter-variances,<strong>and</strong> human perception produces more accurate
segmentation results. This clearly proves the superiorsegmentation performance of the ROSSM algorithm overthe OSF algorithm.(a)(b)which again demonstrates the out performance of theproposed algorithm.The third set of results relates to the Lungs image in Figure6(a) having four objects with different shapes <strong>and</strong> sizes,where two objects are connected to each other <strong>and</strong> theothers are not. The segmentation results are given inFigures 6(c) <strong>and</strong> (d) for the OSF <strong>and</strong> the ROSSMrespectively. It is visually apparent that a large number ofmisclassified pixels are found in R1, R3 <strong>and</strong> R4 by the OSFalgorithm while the ROSSM algorithm (Figure 6(d))completely classified all the four regions <strong>and</strong> hence provesthe superior performance of the ROSSM algorithm.(c)(d)Figure 5: (a) Original Ring image, (b) Reference imageof (a), (c)-(d) <strong>Segmentation</strong> results of the OSF <strong>and</strong> theproposed ROSSM algorithm respectively.(a)(b)(c)(d)Figure 7: (a) Original RISS image, (b) Reference imageof (a), (c)-(d) <strong>Segmentation</strong> results of the OSF <strong>and</strong> theproposed ROSSM algorithm respectively.(a)(b)The fourth set of results relate to the RISS image in Figure7(a) which has eight character objects with all regionshaving arbitrarily shape. It is clear that some pixels of R ismisclassified in I in OSF algorithm shown in Figure 7(c).On the other h<strong>and</strong>, the ROSSM algorithm clearly classifiedall the characters shown in Figure 7(d). This again provesthe superior segmentation performance of the ROSSMalgorithm.(c)(d)Figure 6: (a) Original Lungs image, (b) Referenceimage of (a), (c)-(d) <strong>Segmentation</strong> results of OSF <strong>and</strong>the proposed ROSSM algorithm respectively.The second set of results relate to the Ring image in Figure5(a) having two objects, namely the Ring (R1) <strong>and</strong>Diamond (R2) representing independent objects havingdifferent sizes, shapes <strong>and</strong> intensities. The segmentationresults for the OSF algorithm are given in Figure 5(c) withthe reference regions in Figure 5(b). It is visually apparentthat both regions R1 <strong>and</strong> R2 contain lot of misclassifiedpixels due to same reasons mentioned in previous example.In contrast, the ROSSM algorithm classified both theregions R1 <strong>and</strong> R2 shown in Figure 5 (d) more accuratelyThe final <strong>and</strong> fifth set of results relate to the skeleton imagein Figure 8(a) which has 16 objects with all regions havingarbitrarily shape. It is clear from the Figures 8(b), (c) <strong>and</strong>(d) that the ROSSM algorithm more correctly classified all16 objects whereas misclassifications occurred with thesegmentation result provided by the OSF algorithm. Thisagain proves the superior segmentation performance of theROSSM algorithm.(a)(b)
(c)(d)Figure 8: (a) Original skeleton image, (b) Referenceimage of (a), (c)-(d) <strong>Segmentation</strong> results of the OSF<strong>and</strong> the proposed ROSSM algorithm respectively.Table 1: Statistics of qualitative performance of the OSF<strong>and</strong> the ROSSM algorithmsNomenclaturesOSFROSSMNo ofimagesNo ofimagesCorrectlySegmentedPartiallycorrectlysegmentedWronglysegmentedPercentageout of 211imagesPercentageout of 211images76 36.02% 152 72.04%62 29.38% 28 13.27%73 34.60% 31 14.69%To assess the robustness of the proposed ROSSMalgorithm, the experiments were conducted for 211different images having different objects containingdifferent shapes, sizes, orientations <strong>and</strong> features. Theexperimental results are shown in Table 1 where the OSFalgorithm produced correct segmentation results for 76images out of 211 images <strong>and</strong> hence the percentage ofsuccessfully segmenting images is 36.02% while theROSSM algorithm segments 152 images accurately with asuccess rate of 72.04%. The number of images for partiallycorrected <strong>and</strong> wrongly segmentation results for the OSF are62 <strong>and</strong> 73 respectively <strong>and</strong> for ROSSM algorithm for 28<strong>and</strong> 31 respectively. So, from this analysis, it can beconcluded that the ROSSM algorithm performs much betterin image segmentation than that of SM algorithm as well asthe OSF algorithm.6. ConclusionsThe <strong>Split</strong> <strong>and</strong> merge (SM) algorithm is well-knownalgorithm in digital image processing due to its simplicity,effectiveness, unsupervision <strong>and</strong> relative cost minimization,however, it is unable to achieve global optimum. Theproposed robust object segmentation based on split <strong>and</strong>merge (ROSSM) considers region stability as the key issuefor splitting while the region stability, region variances, <strong>and</strong>human perception as key issues for multi stage merging. Inthe ROSSM algorithm, the thresholds used for merging arecalculated dynamically based on inter-<strong>and</strong> intra-variancesof regions. As a consequence, the ROSSM algorithm is ableto segment all type objects in an image. The experimentalresults have shown that the ROSSM algorithm hasoutperformed the SM algorithm <strong>and</strong> a shape-based fuzzyclustering algorithm namely object based imagesegmentation <strong>using</strong> fuzzy clustering (OSF). This increasesthe application area of the SM algorithm where thesegmentation is critical. The main problem of the proposedROSSM algorithm is that it is unable to segment similar<strong>and</strong> connected objects well due to considering pixelintensity while they may be identified as different objectsconsidering the spatial location <strong>and</strong> also if multipleattributes were considered the objects could be classifiedmore accurately. In the splitting stage a region is dividedinto four almost equal sub-regions if the threshold valuepermits. This hard partitioning splits the image region intonumerous unwanted sub-regions which need to rejoin(merge) in the merging stage that requires noticeable timefor merging. An efficient soft clustering which can dividethe base region into stable <strong>and</strong> an optimal numbers ofregions instead of simply dividing it into four regionswould be a further development.Reference[1] M. Ameer Ali, Laurence S Dooley <strong>and</strong> Gour CKarmakar, <strong>Object</strong> based Image <strong>Segmentation</strong> UsingFuzzy Clustering, ICASSP 2006.[2] K. Haris, et al., Hybrid Image <strong>Segmentation</strong> UsingWatersheds <strong>and</strong> Fast Region Merging, IEEETransactions on Image Processing, Vol. 7 (12),pp.1684–1699, 1998.[3] D. Chaudhuri, B.B. Chaudhuri <strong>and</strong> C.A. Murthy, ANew <strong>Split</strong>–<strong>and</strong>-<strong>Merge</strong> Clustering Technique, PatternRecognition Letters, Vol. 13, pp. 399-409, 1998.[4] T. Pavlidis, Structural Pattern Recognition, SpringerVerlag, New York: Berlin Heidelberg, 1977.[5] J.F. Canny, A computational approach to edgedetection, IEEE Transaction Pattern Analysis <strong>and</strong>Machine Intelligence, Vol. 8 (6), pp. 679–698, 1986.[6] R. Ronfard, Region-based strategies for activecontour models, International Journal of ComputerVision, Vol. 13(2), pp. 229–251, 1994.[7] G.M. Hunter, K.S. Steiglitz, Operations on ImagesUsing Quad-Tree, IEEE Transaction PatternAnalysis <strong>and</strong> Machine Intelligence, Vol. 1 (2), pp.145–153, 1979.[8] C. Revol, M. Jourlin, A new minimum varianceregion growing algorithm for image segmentation,Pattern Recognition Letters, Vol. 18, pp. 249–258,1997.[9] S.L. Horowitz, T. Pavlidis, Picture segmentation by adirected split-<strong>and</strong>-merge procedure, Proceedings ofthe 2nd International Joint Conference on PatternRecognition, pp. 424–433, 1974.[10] T. Brox, D. Firin <strong>and</strong> H. N. Peter, Multistage regionmerging for image segmentation, 22 nd Symposiumon Information theory in to Benelux, pp. 189-196,Enschede, 2001.
[11] C.J. Veeman, M.J.T. Reinders, <strong>and</strong> E. Backer, acellular co-evolutionary algorithm for imagesegmentation.,IEEE Transactions on ImageProcessing, Vol.12(3), pp.304-316, 2003.[12] M. D. G. Montoya, C. Gil <strong>and</strong> I. Garcia, The loadunbalancing problem for region growing imagesegmentation algorithms, Journal of ParallelDistribution <strong>and</strong> Computations, Vol. 63, pp.387-395,2003.[13] T. Aach, U.Franke <strong>and</strong> R.Mester, Top-down imagesegmentation <strong>using</strong> object detection <strong>and</strong> contourrelaxation, Proceedings ICASSP 89, pp. 1703 –1706, 1989.[14] F. Cheevasuvit, H. Maitre <strong>and</strong> D.V. Madjar, A robustmethod for picture segmentation based on a split <strong>and</strong>merge procedure, Computer Vision, Graphics <strong>and</strong>Image Processing, Vol. 34, pp. 268-281, 1986.[15] Z. Zhang, C. Chen, J. Sun <strong>and</strong> K.L. Chan, EMalgorithms for Gaussian mixtures with split-<strong>and</strong>mergeoperation, Pattern Recognition, Vol. 36, pp.1973-1983, 2003.[16] S.P.Gupta, Advanced Practical Statistic, New Delhi;S.chad <strong>and</strong> Company Ltd, pp. 632-633, 2000-2001.[17] M. Ameer Ali, Laurence S Dooley, <strong>and</strong> Gour CKarmakar, Automatic Feature Set Selection forMerging Image <strong>Segmentation</strong> Results <strong>using</strong> FuzzyClustering, International Conference on Computer<strong>and</strong> Information Technology, pp. 337-342, 2005.[18] A. B. M. Farquzzaman, N. R. Paiker, J. Arafat, M. A.Ali <strong>and</strong> G. Sorwar, <strong>Robust</strong> Image <strong>Segmentation</strong>Based on <strong>Split</strong> <strong>and</strong> <strong>Merge</strong>, IEEE TENCON 2008,India, 2008.