Day 4: Critical Thinking and Data Analysis
Day 4: Critical Thinking and Data Analysis
Day 4: Critical Thinking and Data Analysis

Create successful ePaper yourself
Turn your PDF publications into a flip-book with our unique Google optimized e-Paper software.
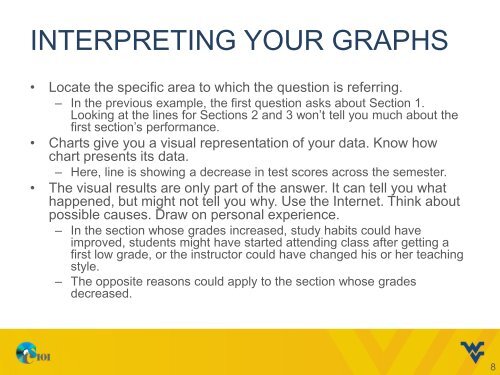
INTERPRETING YOUR GRAPHS• Locate the specific area to which the question is referring.– In the previous example, the first question asks about Section 1.Looking at the lines for Sections 2 <strong>and</strong> 3 won’t tell you much about thefirst section’s performance.• Charts give you a visual representation of your data. Know howchart presents its data.– Here, line is showing a decrease in test scores across the semester.• The visual results are only part of the answer. It can tell you whathappened, but might not tell you why. Use the Internet. Think aboutpossible causes. Draw on personal experience.– In the section whose grades increased, study habits could haveimproved, students might have started attending class after getting afirst low grade, or the instructor could have changed his or her teachingstyle.– The opposite reasons could apply to the section whose gradesdecreased.8