Does portfolio manager ownership affect fund performance ... - LTA
Does portfolio manager ownership affect fund performance ... - LTA
Does portfolio manager ownership affect fund performance ... - LTA

You also want an ePaper? Increase the reach of your titles
YUMPU automatically turns print PDFs into web optimized ePapers that Google loves.
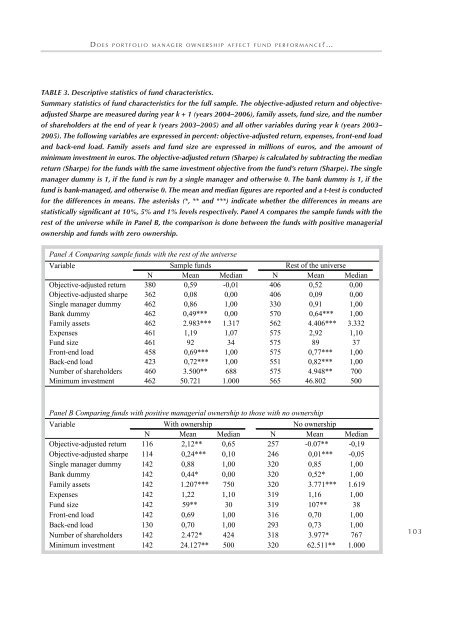
D o e s p o r t f o l i o m a n a g e r o w n e r s h i p a f f e c t f u n d p e r f o r m a n c e ? …Table 3. Descriptive statistics of <strong>fund</strong> characteristics.Summary statistics of <strong>fund</strong> characteristics for the full sample. The objective-adjusted return and objectiveadjustedSharpe are measured during year k + 1 (years 2004–2006), family assets, <strong>fund</strong> size, and the numberof shareholders at the end of year k (years 2003–2005) and all other variables during year k (years 2003–2005). The following variables are expressed in percent: objective-adjusted return, expenses, front-end loadand back-end load. Family assets and <strong>fund</strong> size are expressed in millions of euros, and the amount ofminimum investment in euros. The objective-adjusted return (Sharpe) is calculated by subtracting the medianreturn (Sharpe) for the <strong>fund</strong>s with the same investment objective from the <strong>fund</strong>’s return (Sharpe). The single<strong>manager</strong> dummy is 1, if the <strong>fund</strong> is run by a single <strong>manager</strong> and otherwise 0. The bank dummy is 1, if the<strong>fund</strong> is bank-managed, and otherwise 0. The mean and median figures are reported and a t-test is conductedfor the differences in means. The asterisks (*, ** and ***) indicate whether the differences in means arestatistically significant at 10%, 5% and 1% levels respectively. Panel A compares the sample <strong>fund</strong>s with therest of the universe while in Panel B, the comparison is done between the <strong>fund</strong>s with positive <strong>manager</strong>ial<strong>ownership</strong> and <strong>fund</strong>s with zero <strong>ownership</strong>.Panel A Comparing sample <strong>fund</strong>s with the rest of the universeVariableSample <strong>fund</strong>sRest of the universeN Mean Median N Mean MedianObjective-adjusted return 380 0,59 -0,01 406 0,52 0,00Objective-adjusted sharpe 362 0,08 0,00 406 0,09 0,00Single <strong>manager</strong> dummy 462 0,86 1,00 330 0,91 1,00Bank dummy 462 0,49*** 0,00 570 0,64*** 1,00Family assets 462 2.983*** 1.317 562 4.406*** 3.332Expenses 461 1,19 1,07 575 2,92 1,10Fund size 461 92 34 575 89 37Front-end load 458 0,69*** 1,00 575 0,77*** 1,00Back-end load 423 0,72*** 1,00 551 0,82*** 1,00Number of shareholders 460 3.500** 688 575 4.948** 700Minimum investment 462 50.721 1.000 565 46.802 500Panel B Comparing <strong>fund</strong>s with positive <strong>manager</strong>ial <strong>ownership</strong> to those with no <strong>ownership</strong>VariableWith <strong>ownership</strong>No <strong>ownership</strong>N Mean Median N Mean MedianObjective-adjusted return 116 2,12** 0,65 257 -0.07** -0,19Objective-adjusted sharpe 114 0,24*** 0,10 246 0,01*** -0,05Single <strong>manager</strong> dummy 142 0,88 1,00 320 0,85 1,00Bank dummy 142 0,44* 0,00 320 0,52* 1,00Family assets 142 1.207*** 750 320 3.771*** 1.619Expenses 142 1,22 1,10 319 1,16 1,00Fund size 142 59** 30 319 107** 38Front-end load 142 0,69 1,00 316 0,70 1,00Back-end load 130 0,70 1,00 293 0,73 1,00Number of shareholders 142 2.472* 424 318 3.977* 767Minimum investment 142 24.127** 500 320 62.511** 1.0001 0 3