Does portfolio manager ownership affect fund performance ... - LTA
Does portfolio manager ownership affect fund performance ... - LTA
Does portfolio manager ownership affect fund performance ... - LTA

You also want an ePaper? Increase the reach of your titles
YUMPU automatically turns print PDFs into web optimized ePapers that Google loves.
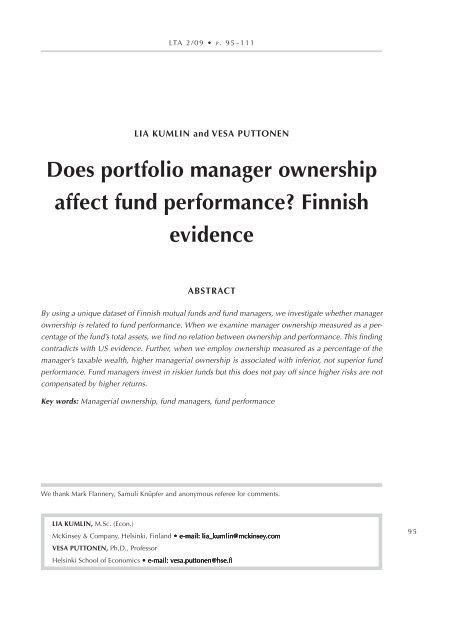
<strong>LTA</strong> 2 / 0 9 • p . 9 5 – 1 1 1Lia Kumlin and Vesa Puttonen<strong>Does</strong> <strong>portfolio</strong> <strong>manager</strong> <strong>ownership</strong><strong>affect</strong> <strong>fund</strong> <strong>performance</strong>? FinnishevidenceAbstractBy using a unique dataset of Finnish mutual <strong>fund</strong>s and <strong>fund</strong> <strong>manager</strong>s, we investigate whether <strong>manager</strong><strong>ownership</strong> is related to <strong>fund</strong> <strong>performance</strong>. When we examine <strong>manager</strong> <strong>ownership</strong> measured as a percentageof the <strong>fund</strong>’s total assets, we find no relation between <strong>ownership</strong> and <strong>performance</strong>. This findingcontradicts with US evidence. Further, when we employ <strong>ownership</strong> measured as a percentage of the<strong>manager</strong>’s taxable wealth, higher <strong>manager</strong>ial <strong>ownership</strong> is associated with inferior, not superior <strong>fund</strong><strong>performance</strong>. Fund <strong>manager</strong>s invest in riskier <strong>fund</strong>s but this does not pay off since higher risks are notcompensated by higher returns.Key words: Managerial <strong>ownership</strong>, <strong>fund</strong> <strong>manager</strong>s, <strong>fund</strong> <strong>performance</strong>We thank Mark Flannery, Samuli Knüpfer and anonymous referee for comments.lia kumlin, M.Sc. (Econ.)McKinsey & Company, Helsinki, Finland e-mail email email email liakmlinmckinsey.comliakmlinmckinsey.comliakmlinmckinsey.comlia_kumlin@mckinsey.comvesa puttonen, Ph.D., ProfessorHelsinki School of Economics email e-mail email email esa.ponenhse.esa.ponenhse.esa.ponenhse.vesa.puttonen@hse.fi9 5
<strong>LTA</strong> 2 / 0 9 • L . K u m l i n a n d V. P u t t o n e n1. Introduction9 6As a part of the increased regulation of mutual <strong>fund</strong> companies, the SEC has lately put a lot ofeffort to improve the transparency of the indstry in the U.S. One of the new regulations cameeffective on March 2005, since when all <strong>portfolio</strong> <strong>manager</strong>s have been required to disclose howmuch of their personal wealth is invested in the <strong>fund</strong>s they run. This information is published inthe <strong>fund</strong>’s Statement of Additional Information and is available to investors on request.In the U.S., the new regulation was subject to a broad debate. There were a lot of discussionabout whether it is useful for an investor to know the <strong>manager</strong>’s stake in the <strong>fund</strong> or does theinformation only tell whether the <strong>fund</strong> makes sense for the <strong>manager</strong>’s personal <strong>portfolio</strong>. However,according to SEC 1 “<strong>ownership</strong> provides a direct indication of <strong>manager</strong>’s alignment with the interests of shareholders”, and thus the new regulation was implemented although many practitioners were initially against it.In response to the new regulation, Khorana, Servaes and Wedge (2007) sdied 1,406 U.S.mutual <strong>fund</strong>s and found that future risk-adjusted <strong>performance</strong> is positively related to <strong>manager</strong>ial<strong>ownership</strong>. Khorana et al conclded that <strong>manager</strong>ial <strong>ownership</strong> has “desirable incentive alignment attributes” for mutual <strong>fund</strong> investors and the disclosure of this information is useful in making <strong>portfolio</strong> allocation decisions.Since the findings of Khorana et al reached the public, the conversation has remained active.One question is for example that if <strong>ownership</strong> is associated with better <strong>performance</strong>, why so few<strong>fund</strong> management companies mandate their <strong>manager</strong>s to own some of the <strong>fund</strong>. Indeed, after thenew disclosure requirements came effective – perhaps partially de to the public pressure – manyU.S. companies have started requiring their <strong>manager</strong>s to have <strong>ownership</strong> stakes in their <strong>fund</strong>s 2 .By using a unique handcollected dataset from the Finnish market we provide further evidence on <strong>fund</strong> <strong>manager</strong> <strong>ownership</strong> and <strong>fund</strong> <strong>performance</strong>. The Finnish dataset incldes the information about the <strong>manager</strong>’s taxable total net wealth, not only the <strong>fund</strong> <strong>ownership</strong> measuredas a percentage of the <strong>fund</strong>’s total assets. This kind of information has not been available in previous sdies. Our dataset also employs the exact amounts of <strong>fund</strong> <strong>ownership</strong> instead of <strong>ownership</strong>ranges. In addition, the <strong>ownership</strong> incldes not only the <strong>manager</strong>’s personal <strong>ownership</strong>, but alsothe possible <strong>ownership</strong> of his/her (investment) company. Further, our dataset incldes the information regarding all <strong>manager</strong>ial <strong>ownership</strong> changes.When <strong>ownership</strong> is measured as a percentage of the <strong>fund</strong>’s total assets the results suggestthat no relation exists between <strong>ownership</strong> and <strong>performance</strong> in the Finnish markets. However,1 SEC Rule S7-12-04, Disclosure regarding Portfolio Managers of Registered Management Investment companies2 “Another way to assess a mutual <strong>fund</strong>; evidence mounts that <strong>performance</strong> improves when <strong>manager</strong>s invest in theirown <strong>portfolio</strong>s”, Eleanor Laise, Wall Street Journal, Jul 26, 2006
D o e s p o r t f o l i o m a n a g e r o w n e r s h i p a f f e c t f u n d p e r f o r m a n c e ? …when <strong>ownership</strong> is measured as a percentage of the <strong>manager</strong>’s taxable wealth – the primary<strong>ownership</strong> measure employed in our sdy – the results suggest that higher <strong>manager</strong>ial <strong>ownership</strong>actually leads to inferior, not superior <strong>performance</strong>. More precisely, for every additional percentthe <strong>manager</strong>’s personal investment comprises of his taxable net wealth, the <strong>fund</strong>’s objective-adjusted return decreases by 9–14 basis points and objective-adjusted Sharpe by 1–2 basis points,depending on the model specification.A part of the inverse relation between <strong>ownership</strong> and <strong>performance</strong> is explained by the factthat <strong>portfolio</strong> <strong>manager</strong>s tend to hold larger stakes in <strong>fund</strong>s which have high volatilities. However,the additional risk-taking does not seem to pay off, since higher risks are not compensated withhigher returns.2. Fund <strong>manager</strong> <strong>performance</strong>Very few of us – if any – are able to say which <strong>fund</strong>s will perform the best in the future. First, giventhe large number of mutual <strong>fund</strong>s available and the existence of searching costs, many investorsseem to acquire little knowledge about the <strong>fund</strong>s they buy [See for example Capon, Fitzsimonsand Prince (1996)]. Thus, while adertising and media presence play an important role in attracting <strong>fund</strong> flows in the U.S. [See for example Sirri and Tufano (1998), Gallaher, Kaniel and Starks(2006)], in Finland, investors value convenience and brand, which results to higher flows intobank-managed mutual <strong>fund</strong>s [Knuutila, Puttonen and Smythe (2006)].Secondly, although more sophisticated investors look for the traditional <strong>performance</strong> measures – such as <strong>fund</strong>’s alpha – in selecting <strong>fund</strong>s, taking into account that these measures are onlyindicators of the <strong>fund</strong>’s past <strong>performance</strong>, it is not obvious that this strategy yields any better results than the more unsophisticated one; so far the multiple sdies examining the issue of <strong>performance</strong> persistence have reached conflicting results [See for example Grinblatt and Titman(1992), Hendricks, Patel and Zeckhauser (1993), Brown and Goetzmann (1995) and Carhart(1997)].If past <strong>performance</strong> is not a reliable proxy for the <strong>fund</strong>’s future <strong>performance</strong>, is there anymeasure that investors could look for when selecting mutual <strong>fund</strong>s? Furthermore, if no such anindicator exists, can investors even rely that the <strong>fund</strong> <strong>manager</strong> acts on their best behalf and doeshis best to achieve the highest possible <strong>performance</strong> for the <strong>fund</strong>? The only thing we know is thatthe <strong>fund</strong> <strong>manager</strong> bears the responsibility of the <strong>fund</strong>’s returns and that his incentives are likelyto <strong>affect</strong> his behavior.Khorana et al (2007) were the first ones who have sdied the relation between <strong>portfolio</strong><strong>manager</strong> <strong>ownership</strong> and the <strong>performance</strong> of the <strong>fund</strong>. They sdied 1,406 U.S. mutual <strong>fund</strong>s andfind that while over half of the <strong>manager</strong>s do not own any stakes in the <strong>fund</strong>s they run, the average9 7
<strong>LTA</strong> 2 / 0 9 • L . K u m l i n a n d V. P u t t o n e n<strong>manager</strong> holds a $97,000 <strong>ownership</strong> stake in his <strong>fund</strong>. This in turn represents 0.04% of the <strong>fund</strong>’sassets under management. Khorana et al find that for every basis point of increase in <strong>manager</strong>ial<strong>ownership</strong>, the <strong>fund</strong>’s <strong>performance</strong> increases between 2.4 and 5 basis points depending on themodel specification.In addition to the finding that future <strong>performance</strong> relates to <strong>manager</strong>ial <strong>ownership</strong>, Khoranaet al also find some factors which determine the amount of <strong>ownership</strong>. More specifically, theyfind that <strong>manager</strong>ial <strong>ownership</strong> is higher in <strong>fund</strong>s with better past <strong>performance</strong>, lower front-endloads, smaller size, longer <strong>manager</strong>ial tenure and <strong>fund</strong>s affiliated with smaller <strong>fund</strong> families.Evans (2008) examined the relation between a <strong>manager</strong>’s personal wealth and the <strong>performance</strong> of associated 237 US equity <strong>fund</strong>s. His findings suggest that <strong>fund</strong>s run by minimally invested<strong>manager</strong>s have significantly lower style-adjusted returns (approximately 2.6%) than do <strong>fund</strong>swhere <strong>manager</strong>s own more than $100.000 of their <strong>fund</strong>. They also have higher turnover levels.The <strong>fund</strong>’s expense ratio is significantly decreasing in <strong>manager</strong>ial <strong>ownership</strong>. Also, <strong>fund</strong> age and<strong>manager</strong> tenure are significantly lower for <strong>manager</strong>s with a low level of personal investment.We contribute to the existing literature in many ways. A major contribution is the employment of a unique, handcollected dataset, which has multiple adantages compared to the dataset employed by the previous sdy. First, the dataset employs the exact amounts of <strong>ownership</strong>,which the <strong>manager</strong>s have invested in their <strong>fund</strong>s, instead of <strong>ownership</strong> ranges. In addition, the<strong>ownership</strong> incldes not only the <strong>manager</strong>’s personal <strong>ownership</strong>, but also the possible <strong>ownership</strong>of his firm. Second, the dataset incldes the information about the <strong>manager</strong>’s taxable wealth,which, in estimating the magnide of <strong>manager</strong>ial incentives, makes it possible to calculate avariable that divides the <strong>manager</strong>’s <strong>ownership</strong> stake by his total taxable wealth. Third, unlike thedataset employed by Servaes et al (2007) and Evans (2008), the dataset incldes the informationregarding <strong>manager</strong>ial changes. This adds reliability especially to the regressions, in which theamount of <strong>manager</strong>ial <strong>ownership</strong> at the end of the year is regressed to the <strong>fund</strong>’s <strong>performance</strong>dring the subsequent year. Finally, the dataset employs many years of European data instead ofAmerican.3. Data and methodology9 83.1. Income and wealth dataWhile citizens’ wealth information is not publicly available in many countries and thus can notbe gathered for research purposes, in Finland the data on many persons’ taxable income andwealth 3 is published annually by multiple sources. For the purposes of this sdy, we gathered the3 The wealth tax was removed in Finland starting from January 1, 2006, after which the data on taxable wealth isno longer available.
D o e s p o r t f o l i o m a n a g e r o w n e r s h i p a f f e c t f u n d p e r f o r m a n c e ? …information from “Veropörssi” publications, which publish the taxable income and wealth, asconfirmed by the tax authorities, of most Finnish citizens 4 .Table 1 contains summary statistics on <strong>portfolio</strong> <strong>manager</strong> taxable wealth and employmentincome for the full sample (combined for years 2003–2005). During the sample period, the average <strong>portfolio</strong> <strong>manager</strong> earned € 89.717 per year and possessed a taxable wealth of € 258.574,while the annual salary for the median <strong>manager</strong> was € 75.600 and taxable wealth € 16.700.However, 10% of all <strong>manager</strong>s earned more than € 145.440 per year and had a taxable wealthof over € 472.800.Table 1. Descriptive statistics on <strong>portfolio</strong> <strong>manager</strong> taxable net wealth and income – all sample <strong>fund</strong>s.This table documents the <strong>portfolio</strong> <strong>manager</strong>s’ taxable net wealth and taxable employment income duringthe period 2003–2005. The data is reported only for those <strong>manager</strong>s, whose <strong>ownership</strong> data was disclosed,and is as confirmed by the tax authorities. The mean, 50 th , 75 th , 90 th and 100 th percentiles of taxable wealthand income figures are reported.N Mean 50th 75th 90th 100thTaxable wealth 119 258.574 16.700 127.950 472.800 4.517.200Taxable employmentincome119 89.717 75.600 98.650 145.440 409.3003.2. Fund <strong>ownership</strong> dataWe collect the wealth and income data for only those <strong>portfolio</strong> <strong>manager</strong>s whose <strong>fund</strong> <strong>ownership</strong>data is available. While in the U.S. the requirement to disclose a <strong>portfolio</strong> <strong>manager</strong>’s personalstake in the <strong>fund</strong> did not become effective until March 2005, in Finland <strong>portfolio</strong> <strong>manager</strong> <strong>ownership</strong> data has for many years been public information but it does not have to be disclosed inany overt reports, and is thus not easily available to investors. More precisely, every investment<strong>fund</strong> company has an obligation to maintain a register, which contains all insiders’ trades andpossessions in the <strong>fund</strong>s 5 . All information must be entered into the register in a way that it cannot be altered once entered, and the information must be maintained in the register for at leastfive years. In addition, every interested person has the right to see the register information andreceive prints and copies from it.4 “Veropörssi” is an annual publication which is for sale for a modest approx. 10 euro price. The information ispublished in case certain limits are exceeded. In 2005, the limits were €12,000–25,000 for wages depending onthe region, €12,000 for capital income and €50,000 for taxable wealth.5 The Finnish mutual <strong>fund</strong> law 14, § 99–100, available at http//www.finlex.fi/fi/laki/ajantasa/1999/199900489 9
D o e s p o r t f o l i o m a n a g e r o w n e r s h i p a f f e c t f u n d p e r f o r m a n c e ? …Table 2. Descriptive statistics on <strong>portfolio</strong> <strong>manager</strong> <strong>ownership</strong> – all sample <strong>fund</strong>s.This table documents the amount of <strong>ownership</strong> that <strong>portfolio</strong> <strong>manager</strong>s have in the <strong>fund</strong>s they run as ofDecember 31, 2003–2005. The <strong>ownership</strong> includes the <strong>manager</strong>’s personal <strong>ownership</strong> as well as the possible<strong>ownership</strong> of his firm. The mean, 50 th , 75 th , 90 th and 100 th percentiles of <strong>ownership</strong> figures are reported.Panel A documents the amount of <strong>ownership</strong> in euros and Panel B as a percentage of the <strong>manager</strong>’s totaltaxable net wealth. Panel C documents the <strong>ownership</strong> as a percentage of the <strong>manager</strong>’s annual taxableemployment income and Panel D as a percent of the <strong>fund</strong>’s total assets.Panel A Managerial <strong>ownership</strong> (€)Fund typeN% of <strong>fund</strong>s withpositive <strong>ownership</strong> Mean 50th 75th 90th 100thAll <strong>fund</strong>s 460 31 5.179 0 324 5.137 498.394Balanced 100 31 3.513 0 718 3.419 68.141Domestic equity 54 30 2.915 0 425 5.831 47.103International equity 183 34 8.114 0 361 6.576 498.394Bond 39 13 299 0 0 675 8.615Corporate bond 28 29 196 0 10 626 2.519Money market 48 33 2.983 0 205 6.586 31.943Other 8 63 29.002 10.205 35.660 84.288 117.300Panel B Managerial <strong>ownership</strong> (% of the <strong>manager</strong>'s taxable wealth)Fund typeN% of <strong>fund</strong>s withpositive <strong>ownership</strong> Mean 50th 75th 90th 100thAll <strong>fund</strong>s 380 16 1.91 0.00 0.00 2.01 60.22Balanced 82 16 1.95 0.00 0.00 4.37 37.05Domestic equity 49 22 0.90 0.00 0.00 1.96 17.73International equity 150 19 1.85 0.00 0.00 2.11 60.22Bond 36 6 1.31 0.00 0.00 0.00 44.64Corporate bond 20 0 0.00 0.00 0.00 0.00 0.00Money market 39 18 5.08 0.00 0.00 28.86 56.13Other 3 0 0.00 0.00 0.00 0.00 0.00Panel C Managerial <strong>ownership</strong> (% of the <strong>manager</strong>'s taxable income)Fund typeN% of <strong>fund</strong>s withpositive <strong>ownership</strong> Mean 50th 75th 90th 100thAll <strong>fund</strong>s 397 20 5.97 0.00 0.00 2.83 658.79Balanced 82 16 0.39 0.00 0.00 1.16 9.13Domestic equity 50 24 1.71 0.00 0.00 4.25 39.39International equity 155 22 11.53 0.00 0.00 3.33 658.79Bond 36 6 0.46 0.00 0.00 0.00 14.80Corporate bond 25 25 0.26 0.00 0.00 0.07 4.56Money market 43 26 2.90 0.00 0.00 8.87 28.88Other 5 40 63.18 0.00 143.14 160.91 172.751 0 1Panel D Managerial <strong>ownership</strong> (% of the <strong>fund</strong>'s total assets)Fund typeNContinued% of <strong>fund</strong>s withpositive <strong>ownership</strong> Mean 50th 75th 90th 100thAll <strong>fund</strong>s 460 31 0.05 0.00 0.00 0.02 4.71Balanced 100 31 0.04 0.00 0.00 0.04 1.26Domestic equity 54 30 0.01 0.00 0.00 0.03 0.31International equity 183 34 0.08 0.00 0.00 0.02 4.71Bond 39 13 0.00 0.00 0.00 0.00 0.02
All <strong>fund</strong>s 397 20 5.97 0.00 0.00 2.83 658.79Balanced 82 16 0.39 0.00 0.00 1.16 9.13Domestic equity 50 24 1.71 0.00 0.00 4.25 39.39International equity 155 22 11.53 0.00 0.00 3.33 658.79<strong>LTA</strong> 2 / 0 9 • L . K u m l i n a n d V. P u t t o n e nBond 36 6 0.46 0.00 0.00 0.00 14.80Corporate bond 25 25 0.26 0.00 0.00 0.07 4.56Money market 43 26 2.90 0.00 0.00 8.87 28.88Other 5 40 63.18 0.00 143.14 160.91 172.75Table 2 Cont.Panel D Managerial <strong>ownership</strong> (% of the <strong>fund</strong>'s total assets)Fund typeN% of <strong>fund</strong>s withpositive <strong>ownership</strong> Mean 50th 75th 90th 100thAll <strong>fund</strong>s 460 31 0.05 0.00 0.00 0.02 4.71Balanced 100 31 0.04 0.00 0.00 0.04 1.26Domestic equity 54 30 0.01 0.00 0.00 0.03 0.31International equity 183 34 0.08 0.00 0.00 0.02 4.71Bond 39 13 0.00 0.00 0.00 0.00 0.02Corporate bond 28 29 0.00 0.00 0.00 0.01 0.02Money market 48 33 0.02 0.00 0.00 0.01 0.80Other 8 63 0.32 0.02 0.29 1.11 1.46ers shift the averages upwards, the percentiles give a more descriptive picture of the <strong>ownership</strong>stakes that <strong>portfolio</strong> <strong>manager</strong>s in general hold in their <strong>fund</strong>s.Looking at the percentiles reveals that only 10% of all <strong>manager</strong>s have invested more than€ 5.137 in their <strong>fund</strong>s. This in turn translates to only 0.02% of the <strong>fund</strong>’s total assets, or 2.01 (2.83)percent of the <strong>manager</strong>’s taxable wealth (employment income). Nevertheless, the <strong>manager</strong> withthe highest <strong>ownership</strong> stake has invested almost half a million euros (€ 498.394) in his <strong>fund</strong>,which is more than six times his annual taxable employment income and over half of his taxablenet wealth.1 0 23.3. Fund characteristicsFund family and <strong>portfolio</strong> <strong>manager</strong> characteristics is gathered from Mutual Fund Reports, whichare prodced by Investment Research Finland 8 in co-operation with the Finnish Association ofMutual Funds 9 . Mutual Fund Reports are the leading neutral analyses of mutual <strong>fund</strong>s marketedin Finland, and are published at the beginning of each month to document the <strong>fund</strong>s’ <strong>performance</strong>- and other data for the preceding month. From the reports, we gather the data about the<strong>fund</strong>’s <strong>performance</strong>, volatility, expenses, loads and size, as well as the data about the tenure ofthe <strong>manager</strong>, the size of the <strong>fund</strong> family, the amount of minimum investment and the number ofshareholders. Furthermore, we also gather the information regarding <strong>manager</strong>ial changes, and setthe single <strong>manager</strong>- and bank dmmies based on the Mutual Fund Report data.Since Mutual Fund Reports contain nearly all Finnish registered mutual <strong>fund</strong>s, the full sample for each year consists of all those Finnish mutual <strong>fund</strong>s, which are inclded in the reports.Combined for years 2003–2005, the original sample size is 1.101 <strong>fund</strong>s.Table 3 contains the summary statistics of <strong>fund</strong> characteristics for the full sample (combinedfor years 2003–2005). Panel A presents the descriptive statistics for the sample <strong>fund</strong>s and com
D o e s p o r t f o l i o m a n a g e r o w n e r s h i p a f f e c t f u n d p e r f o r m a n c e ? …Table 3. Descriptive statistics of <strong>fund</strong> characteristics.Summary statistics of <strong>fund</strong> characteristics for the full sample. The objective-adjusted return and objectiveadjustedSharpe are measured during year k + 1 (years 2004–2006), family assets, <strong>fund</strong> size, and the numberof shareholders at the end of year k (years 2003–2005) and all other variables during year k (years 2003–2005). The following variables are expressed in percent: objective-adjusted return, expenses, front-end loadand back-end load. Family assets and <strong>fund</strong> size are expressed in millions of euros, and the amount ofminimum investment in euros. The objective-adjusted return (Sharpe) is calculated by subtracting the medianreturn (Sharpe) for the <strong>fund</strong>s with the same investment objective from the <strong>fund</strong>’s return (Sharpe). The single<strong>manager</strong> dummy is 1, if the <strong>fund</strong> is run by a single <strong>manager</strong> and otherwise 0. The bank dummy is 1, if the<strong>fund</strong> is bank-managed, and otherwise 0. The mean and median figures are reported and a t-test is conductedfor the differences in means. The asterisks (*, ** and ***) indicate whether the differences in means arestatistically significant at 10%, 5% and 1% levels respectively. Panel A compares the sample <strong>fund</strong>s with therest of the universe while in Panel B, the comparison is done between the <strong>fund</strong>s with positive <strong>manager</strong>ial<strong>ownership</strong> and <strong>fund</strong>s with zero <strong>ownership</strong>.Panel A Comparing sample <strong>fund</strong>s with the rest of the universeVariableSample <strong>fund</strong>sRest of the universeN Mean Median N Mean MedianObjective-adjusted return 380 0,59 -0,01 406 0,52 0,00Objective-adjusted sharpe 362 0,08 0,00 406 0,09 0,00Single <strong>manager</strong> dummy 462 0,86 1,00 330 0,91 1,00Bank dummy 462 0,49*** 0,00 570 0,64*** 1,00Family assets 462 2.983*** 1.317 562 4.406*** 3.332Expenses 461 1,19 1,07 575 2,92 1,10Fund size 461 92 34 575 89 37Front-end load 458 0,69*** 1,00 575 0,77*** 1,00Back-end load 423 0,72*** 1,00 551 0,82*** 1,00Number of shareholders 460 3.500** 688 575 4.948** 700Minimum investment 462 50.721 1.000 565 46.802 500Panel B Comparing <strong>fund</strong>s with positive <strong>manager</strong>ial <strong>ownership</strong> to those with no <strong>ownership</strong>VariableWith <strong>ownership</strong>No <strong>ownership</strong>N Mean Median N Mean MedianObjective-adjusted return 116 2,12** 0,65 257 -0.07** -0,19Objective-adjusted sharpe 114 0,24*** 0,10 246 0,01*** -0,05Single <strong>manager</strong> dummy 142 0,88 1,00 320 0,85 1,00Bank dummy 142 0,44* 0,00 320 0,52* 1,00Family assets 142 1.207*** 750 320 3.771*** 1.619Expenses 142 1,22 1,10 319 1,16 1,00Fund size 142 59** 30 319 107** 38Front-end load 142 0,69 1,00 316 0,70 1,00Back-end load 130 0,70 1,00 293 0,73 1,00Number of shareholders 142 2.472* 424 318 3.977* 767Minimum investment 142 24.127** 500 320 62.511** 1.0001 0 3
<strong>LTA</strong> 2 / 0 9 • L . K u m l i n a n d V. P u t t o n e npares them with the rest of the universe. Panel B compares the characteristics of the <strong>fund</strong>s withpositive <strong>manager</strong>ial <strong>ownership</strong> to those with no <strong>ownership</strong>.Panel A shows that while there seems to be no significant differences in <strong>performance</strong>, thenumber of <strong>portfolio</strong> <strong>manager</strong>s, expenses, size or the amount of minimum investment between thesample <strong>fund</strong>s and the rest of the universe, the <strong>fund</strong>s in the sample are more likely to be fromsmaller, non-bank investment <strong>fund</strong> companies than their non-sample peers. In addition, the sample <strong>fund</strong>s have fewer shareholders and employ lower front-end and back-end loads. The lastfinding may result partially from the fact that the sample <strong>fund</strong>s are more likely to belong to nonbankfamilies; some sdies suggest that Finnish bank-managed mutual <strong>fund</strong>s charge higher feesfrom their customers than non-bank <strong>fund</strong>s do [see for example Korkeamäki and Smythe(2004)].Descriptive statistics documented in Panel B suggest that on average, <strong>fund</strong>s with positive<strong>manager</strong>ial <strong>ownership</strong> have performed better than <strong>fund</strong>s with no <strong>ownership</strong> the average (median)objective-adjusted return for a <strong>fund</strong> with some <strong>manager</strong>ial <strong>ownership</strong> is 2.12 % (0.65%) comparedto the average of –0.07% (–0.19%) of its zero-<strong>ownership</strong> peer. Furthermore, the average (median)<strong>fund</strong> with positive <strong>manager</strong>ial <strong>ownership</strong> has an objective -adjusted Sharpe of 0.24 (0.10), whilethe comparable numbers for a zero <strong>ownership</strong> <strong>fund</strong> are 0.01 and –0.05 respectively.In addition, the figures shown in Panel B suggest a couple of other differences between the<strong>fund</strong>s, which have some amount of <strong>manager</strong>ial <strong>ownership</strong>, and <strong>fund</strong>s with no <strong>ownership</strong>. Moreprecisely, positive <strong>ownership</strong> <strong>fund</strong>s are more likely to belong to smaller families (average familyassets of € 1.207 million compared to € 3.771 million), be of smaller size (average <strong>fund</strong> size of€ 59 million compared to € 107 million), have fewer shareholders (average number of shareholders 2.472 compared to 3.977) and have lower minimum investment requirements (average minimum investment of € 24.127 compared to € 62.511). In addition, the <strong>fund</strong>s with positive <strong>manager</strong>ial <strong>ownership</strong> are more likely to be managed by non-bank companies than <strong>fund</strong>s, which lack<strong>manager</strong>ial <strong>ownership</strong>.4. Managerial <strong>ownership</strong> and <strong>fund</strong> <strong>performance</strong>1 0 44.1. Ownership and <strong>performance</strong>We next investigate whether there is a relation between the amount of <strong>manager</strong>ial <strong>ownership</strong> atthe end of the year (years 2003–2005), and <strong>fund</strong> <strong>performance</strong> dring the subsequent year (years2004–2006). More precisely, we estimate both simple and multivariate regressions of <strong>performance</strong>as a function of <strong>manager</strong>ial <strong>ownership</strong> and a set of control variables. In constructing the modelswe use two different measures of <strong>fund</strong> <strong>performance</strong> and three different measures of <strong>ownership</strong>.Panel A in Table 4 shows the regression results where <strong>ownership</strong> is measured as a percentage of
D o e s p o r t f o l i o m a n a g e r o w n e r s h i p a f f e c t f u n d p e r f o r m a n c e ? …the <strong>manager</strong>’s taxable wealth and Panel B where it is measured as a percentage of the <strong>manager</strong>’staxable annual employment income. Panel C measures <strong>ownership</strong> as a percentage of the <strong>fund</strong>’stotal assets.Table 4. The <strong>ownership</strong> and <strong>performance</strong> – <strong>fund</strong>s with <strong>fund</strong> <strong>manager</strong> <strong>ownership</strong>.The ordinary least squares (OLS) regression results, in which the <strong>fund</strong> <strong>performance</strong> (measured as the <strong>fund</strong>’sobjective-adjusted return and objective-adjusted Sharpe) is the dependent variable, for <strong>fund</strong>s with positive<strong>manager</strong>ial <strong>ownership</strong>. The objective-adjusted return is calculated by subtracting the return of the median<strong>fund</strong> with the matched investment objective from the <strong>fund</strong>’s return and the objective-adjusted Sharpe bysubtracting the median Sharpe from the <strong>fund</strong>’s Sharpe. The following control variables are in percent:expenses, front-end load and back-end load, while the log is taken from the following variables: family assets,<strong>fund</strong> size, number of shareholders and the amount of minimum investment. The single <strong>manager</strong> dummy is1, if the <strong>fund</strong> is run by a single <strong>manager</strong> and otherwise 0. The bank dummy is 1, if the <strong>fund</strong> is bank-managed,and otherwise 0. The amount of <strong>ownership</strong>, the size of <strong>fund</strong> family, the size of the <strong>fund</strong> and the number ofshareholders are measured at the end of the year k (2003–2005), <strong>fund</strong> <strong>performance</strong> during year k + 1(2004–2006), and all other control variables during year k (2003–2005). In Panel A, <strong>ownership</strong> is measuredas a percent of the <strong>manager</strong>’s taxable wealth, in Panel B as a percent of the <strong>manager</strong>’s taxable income andin Panel C as a percent of the <strong>fund</strong>’s total assets. The numbers in parentheses are P-values and the asterisks(*, **, ***) indicate whether the coefficients are significant at conventional levels (10%, 5% and 1%respectively).Panel A. Regression results when <strong>ownership</strong> is measured as a percent of the <strong>manager</strong>'s taxable wealthVariableObjective-adjusted returnObjective-adjusted Sharpe(i) (ii) (iii) (iv) (v) (vi)Ownership -0.11 -0.14 -0.09 -0.01 -0.02 -0.01(0.03)** (0.15) (0.22) (0.09)* (0.01)*** (0.01)***Family assets -1.23 -0.24 -0.15 -0.08(0.25) (0.84) (0.07)* (0.39)Expenses 0.21 1.46 -0.08 0.04(0.92) (0.47) (0.58) (0.80)Fund size 2.06 2.73 0.20 0.29(0.04)** (0.01)*** (0.01)*** (0.00)***Front-end load 2.34 3.93 0.26 0.38(0.49) (0.23) (0.30) (0.14)Back-end load -1.74 -4.31 -0.20 -0.32(0.55) (0.11) (0.35) (0.13)Single <strong>manager</strong> dummy -19.33 -0.87(0.00)*** (0.02)**Bank dummy 0.72 0.22(0.80) (0.30)Number of shareholders -2.32 -0.21(0.01)*** (0.00)***Minimum investment -0.85 -0.07(0.03)** (0.03)**N 60 52 52 60 52 52Adjusted R 2 0.06 0.10 0.46 0.03 0.26 0.521 0 5Continued
<strong>LTA</strong> 2 / 0 9 • L . K u m l i n a n d V. P u t t o n e nTable 4. Cont.Panel B. Regression results when <strong>ownership</strong> is measured as a percent of the <strong>manager</strong>'s taxable incomeVariableObjective-adjusted returnObjective-adjusted Sharpe(i) (ii) (iii) (iv) (v) (vi)Ownership 0.01 -0.05 0.03 0.00 -0.01 -0.01(0.57) (0.46) (0.67) (0.94) (0.12) (0.50)Family assets -1.29 -1.21 -0.26 -0.19(0.17) (0.29) (0.01)*** (0.17)Expenses 0.59 3.56 -0.13 0.08(0.72) (0.06)* (0.44) (0.71)Fund size 2.09 3.65 0.30 0.44(0.03)** (0.00)*** (0.00)*** (0.00)***Front-end load 2.67 2.82 0.51 0.58(0.35) (0.36) (0.10)* (0.11)Back-end load -2.15 -3.62 -0.28 -0.45(0.44) (0.17) (0.34) (0.16)Single <strong>manager</strong> dummy -17.63 -0.59(0.00)*** (0.35)Bank dummy 4.11 0.18(0.13) (0.59)Number of shareholders -2.62 -0.22(0.00)*** (0.02)**Minimum investment -0.32 -0.03(0.40) (0.47)N 73 70 73 70 70Adjusted R 2 -0.01 0.05 -0.01 0.16 0.211 0 6Panel C. Regression results when <strong>ownership</strong> is measured as a percent of the<strong>fund</strong>'s total assetsVariableObjective-adjusted returnObjective-adjusted Sharpe(i) (ii) (iii) (iv) (v) (vi)Ownership -0.38 -4.76 -4.44 0.00 -0.33 -0.17(0.39) (0.31) (0.35) (0.95) (0.49) (0.72)Family assets -1.81 -1.21 -0.26 -0.23(0.01)*** (0.16) (0.00)*** (0.01)***Expenses 1.07 3.74 -0.14 0.19(0.39) (0.01)*** (0.28) (0.19)Fund size 1.77 3.46 0.24 0.45(0.02)** (0.00)*** (0.00)*** (0.00)***Front-end load 0.30 0.62 0.23 0.16(0.88) (0.80) (0.29) (0.52)Back-end load 0.31 -2.28 0.15 -0.11(0.89) (0.32) (0.52) (0.63)Single <strong>manager</strong> dummy -1.97 -0.21(0.32) (0.32)Bank dummy 1.31 0.33(0.47) (0.08)*Number of shareholders -2.18 -0.25(0.00)*** (0.00)***Minimum investment 0.02 0.01(0.93) (0.72)N 128 120 120 126 118 118Adjusted R 2 0.00 0.10 0.17 -0.01 0.14 0.25
D o e s p o r t f o l i o m a n a g e r o w n e r s h i p a f f e c t f u n d p e r f o r m a n c e ? …The main finding from Panel C is that no relation between <strong>ownership</strong> and <strong>performance</strong> exists,when <strong>ownership</strong> is measured as a percentage of the <strong>fund</strong>’s size. The finding persists across different model specifications, and although the explanatory power of the models increases whenadditional control variables are inclded in the regressions, the coefficient on <strong>ownership</strong> is notstatistically significant in any of the models.Panels B reports the regression results, where <strong>ownership</strong> is measured as a percentage of the<strong>manager</strong>’s taxable employment income. The conclusion is similar to the previous finding; alsowhen measured as a percentage of the <strong>manager</strong>’s taxable income, <strong>ownership</strong> seems to have noeffect on <strong>fund</strong> <strong>performance</strong>.Finally, the Panel A reports the regression results, where <strong>ownership</strong> is measured as a percentage of the <strong>manager</strong>’s taxable wealth – the primary variable for the purposes of our sdy. Oneresult clearly stands out. While the US findings lead us to expect a positive relation between<strong>ownership</strong> and <strong>performance</strong>, our empirical findings indicate the opposite. The effect of <strong>ownership</strong>on <strong>performance</strong> is negative, and in most models, the result is statistically significant at least on10% level 8 . In general, the results suggest that for every basis point of increased <strong>manager</strong>ial<strong>ownership</strong>, the <strong>fund</strong>’s objective-adjusted return decreases by 9–14 basis points and the objectiveadjustedSharpe by 1–2 basis points. The economic significance of the result is the highest whenthe <strong>fund</strong>’s objective-adjusted Sharpe is used to measure the excess <strong>performance</strong>. Thus, especiallywhen the risks of the <strong>fund</strong> are taken into account – despite the possibly higher incentives – the<strong>manager</strong>s, who have invested their own money in the <strong>fund</strong>s they run, fail to generate superiorreturns.Table 4 also reports the relation between a number of control variables and <strong>fund</strong> <strong>performance</strong>. First, in all models, the effect of the size of the <strong>fund</strong> family on <strong>performance</strong> is negative, andmost models it is statistically significant. In other words, the larger the <strong>fund</strong> family the worse the<strong>fund</strong> <strong>performance</strong>.Second, the <strong>fund</strong>s managed by a single <strong>manager</strong> perform worse than <strong>fund</strong>s managed bymultiple <strong>manager</strong>s. More precisely, the objective-adjusted return for a <strong>fund</strong> run by a single <strong>manager</strong> is 2–19% lower than for a <strong>fund</strong> run by multiple <strong>manager</strong>s, and the objective-adjusted Sharpe30–90 basis points lower, depending on the model specification.Third, the results suggest that the larger the <strong>fund</strong> the better the <strong>performance</strong>, while the impactof the number of shareholders on <strong>performance</strong> is negative. In other words, large <strong>fund</strong>s with fewshareholders – which refer to <strong>fund</strong>s intended for high net worth individals and institutions – tendto perform better than smaller <strong>fund</strong>s with multiple shareholders. One explanation for this is thatmutual <strong>fund</strong> companies may tend to favor <strong>fund</strong>s, which are the most important to them in terms1 0 78 For more information about Investment Research Finland, see http//www.sijoitustutkimus.fi/eng/company.shtml
<strong>LTA</strong> 2 / 0 9 • L . K u m l i n a n d V. P u t t o n e nof revenue, at the expense of other <strong>fund</strong>s [For more information on favoritism in <strong>fund</strong> families,see for example Gaspar, Massa and Matos (2006)].Finally, while some of the models suggest a negative relation between back-end loads and<strong>performance</strong> as well as between the amount of minimum investment and <strong>performance</strong>, and apositive relation between expenses and <strong>performance</strong> as well as between front-end loads and<strong>performance</strong>, these results are not consistent across different models.1 0 84.2. Determinants of <strong>manager</strong>ial <strong>ownership</strong>We also examine whether it is possible to find factors which explain the amount of <strong>manager</strong>ial<strong>ownership</strong>. Table 5 reports the ordinary least squared regression results, in which the amount of<strong>manager</strong>ial <strong>ownership</strong> is the dependent variable. Panel A documents the results, in which allsample <strong>fund</strong>s are inclded in the regressions, while Panel B shows the results when only <strong>fund</strong>swith positive <strong>manager</strong>ial <strong>ownership</strong> are inclded. Model (i) measures <strong>ownership</strong> as a percentageof the <strong>manager</strong>’s taxable wealth, Model (ii) as a percentage of the <strong>manager</strong>’s taxable employmentincome and Model (iii) as a percentage of the <strong>fund</strong>’s total assets.First, when measured as a percentage of the <strong>fund</strong>’s total assets <strong>manager</strong>ial <strong>ownership</strong> seemsto be higher in smaller <strong>fund</strong>s. This is a result consistent with previous findings and is unsurprising,since in smaller <strong>fund</strong>s, the same euro <strong>ownership</strong> comprises a larger <strong>ownership</strong> stake. However,when other <strong>ownership</strong> measures are employed, <strong>fund</strong> size seems to have no effect on the amountof <strong>ownership</strong>. Thus, the perceived correlation is more likely to be a result of the <strong>ownership</strong> measure employed and not an evidence of a relation between <strong>fund</strong> size and <strong>manager</strong>ial <strong>ownership</strong>per se.Second, consistent with the findings of Khorana et al (2007) and Evans (2008), our resultssuggest that a positive relation, if any, exists between the tenure of the <strong>manager</strong> and the amountof <strong>ownership</strong>. However, since the findings from the alternative specifications indicate no evidenceof such a relation, it is more probable that the tenure of the <strong>manager</strong> is related to the size of the<strong>fund</strong> and not to the amount of <strong>ownership</strong>.Third, while Khorana et al (2007) and Evans (2008) find that <strong>manager</strong>ial <strong>ownership</strong> is higherin US <strong>fund</strong>s with lower front-end loads and better past <strong>performance</strong>, we find no evidence of suchrelations. Instead, the results suggest that in Finland, <strong>portfolio</strong> <strong>manager</strong>s own a larger share of<strong>fund</strong>s, which belong to larger, but non-bank <strong>fund</strong> families.When the two variables of our primary interest – <strong>ownership</strong> as a percentage of the <strong>manager</strong>’staxable wealth and as a percentage of the <strong>manager</strong>’s taxable employment income – are employed,one result clearly stands o the <strong>manager</strong>s invest a higher share of their own money in <strong>fund</strong>swhich have higher risks. More precisely, for every additional percent, which the <strong>manager</strong>’s owninvestment comprises of his taxable wealth, the <strong>fund</strong> volatility increases by 16–45 basis points.
D o e s p o r t f o l i o m a n a g e r o w n e r s h i p a f f e c t f u n d p e r f o r m a n c e ? …Table 5. The determinants of <strong>manager</strong>ial <strong>ownership</strong>.The OLS regression results, in which the <strong>manager</strong>ial <strong>ownership</strong> at the end of year k (2003–2005) is thedependent variable. In model (i), <strong>ownership</strong> is measured as a percentage of the <strong>manager</strong>’s taxable wealth,in model (ii) as a percentage of the <strong>manager</strong>’s taxable income and in model (iii) as a percentage of the <strong>fund</strong>’stotal assets. The objective-adjusted Sharpe is calculated by subtracting the Sharpe of the median <strong>fund</strong> withthe matched investment objective from the <strong>fund</strong>’s Sharpe. The following control variables are in percent:volatility, expenses, front-end load and back-end load, while the log is taken from the following variables:family assets, <strong>fund</strong> size, number of shareholders and the amount of minimum investment. The tenure of the<strong>manager</strong> is measured in years. The single <strong>manager</strong> dummy is 1, if the <strong>fund</strong> is run by a single <strong>manager</strong> andotherwise 0. The bank dummy is 1, if the <strong>fund</strong> is bank-managed, and otherwise 0. The size of the <strong>fund</strong> family,the size of the <strong>fund</strong>, the number of shareholders and the tenure of the <strong>manager</strong> are measured at the end ofthe year k (2003–2005), objective-adjusted Sharpe both during year k + 1 (2004–2006) as well as duringyear k (2003–2005), and all other control variables during year k (2003–2005). Numbers in parentheses areP-values and the asterisks (*, **, ***) indicate whether the values are significant at conventional levels (10%,5% and 1% respectively).Panel A Regression results when all sample <strong>fund</strong>s are included in the regressionsVariableOwnership (% of the<strong>manager</strong>'s taxablewealth)Ownership (% of the<strong>manager</strong>'s taxableincome)Ownership (% of the<strong>fund</strong>'s total assets)(i) (ii) (iii)Objective-adjusted sharpe (contemporaneous) -0.16 -0.47 0.00(0.80) (0.38) (0.53)Objective-adjusted sharpe (lagged) -0.98 -0.23 -0.01(0.13) (0.69) (0.28)Volatility 0.16 0.13 0.00(0.06)* (0.10)* (0.42)Family assets -0.43 -0.61 0.01(0.30) (0.12) (0.09)*Expenses -1.29 -0.21 0.01(0.12) (0.80) (0.65)Fund size 0.13 0.14 -0.01(0.80) (0.78) (0.03)**Front-end load -0.29 -0.15 -0.02(0.81) (0.90) (0.16)Back-end load 0.84 -0.43 0.02(0.55) (0.75) (0.34)Tenure of the <strong>manager</strong> 0.04 -0.06 0.00(0.85) (0.77) (0.03)**Single <strong>manager</strong> dummy 1.08 1.43 0.01(0.40) (0.26) (0.39)Bank dummy 0.71 -1.79 -0.03(0.55) (0.11) (0.06)*Number of shareholders -0.29 0.49 -0.01(0.53) (0.27) (0.34)Minimum investment 0.04 0.24 0.00(0.81) (0.09)* (0.95)N 262 277 325Adjusted R 2 0.01 0.04 0.061 0 9Continued
<strong>LTA</strong> 2 / 0 9 • L . K u m l i n a n d V. P u t t o n e nTable 5. Cont.Panel B Regression results when only <strong>fund</strong>s with positive <strong>ownership</strong> are included in the regressionsVariableOwnership (% of the<strong>manager</strong>'s taxablewealth)Ownership (% of the<strong>manager</strong>'s taxableincome)Ownership (% of the<strong>fund</strong>'s total assets)(i) (ii) (iii)Objective-adjusted sharpe (contemporaneous) 2.43 0.16 0.00(0.49) (0.92) (0.81)Objective-adjusted sharpe (lagged) -7.76 0.74 -0.01(0.09)* (0.73) (0.65)Volatility 0.45 0.91 0.00(0.32) (0.01)*** (0.62)Family assets 2.22 0.55 0.05(0.41) (0.81) (0.00)***Expenses -11.36 -5.68 0.00(0.02)** (0.16) (0.89)Fund size 1.45 -1.67 -0.05(0.60) (0.49) (0.03)**Front-end load 2.23 -6.93 -0.01(0.77) (0.29) (0.80)Back-end load -2.85 2.19 0.03(0.63) (0.68) (0.53)Tenure of the <strong>manager</strong> -0.92 0.25 0.01(0.45) (0.80) (0.10)*Single <strong>manager</strong> dummy -5.40 2.37 0.05(0.66) (0.82) (0.23)Bank dummy -6.03 -9.69 -0.10(0.34) (0.08)* 0.01***Number of shareholders -0.61 2.05 0.00(0.77) (0.24) (0.79)Minimum investment -1.40 0.80 0.00(0.21) (0.36) (0.55)N 49 64 111Adjusted R 2 0.32 0.19 0.18Moreover, for every additional percent, which the <strong>manager</strong>’s own investment comprises of hisannual taxable employment income, the <strong>fund</strong> volatility increases by 13–91 basis points. In otherwords, in the hope for higher returns, <strong>portfolio</strong> <strong>manager</strong>s invest a larger share of their own moneyin <strong>fund</strong>s, which have high risks. However, the risk taking does not pay off, since the <strong>fund</strong>s withpositive <strong>manager</strong>ial <strong>ownership</strong> fail to generate superior returns compared to their peer group, andon a risk-adjusted basis the finding becomes even more significant.1 1 0
D o e s p o r t f o l i o m a n a g e r o w n e r s h i p a f f e c t f u n d p e r f o r m a n c e ? …5. Summary and conclusionsIn exploring the relation between <strong>ownership</strong> and <strong>performance</strong> of mutual <strong>fund</strong>s, we end upwith results which are somewhat controversial with prior research. When we measure <strong>ownership</strong>as a percentage of the <strong>fund</strong>’s total assets our results suggest that no relation exists between <strong>ownership</strong> of a <strong>fund</strong> <strong>manager</strong> and <strong>fund</strong> <strong>performance</strong>. However, when we employ the primary variableof our interest – <strong>ownership</strong> measured as a percentage of the <strong>manager</strong>’s taxable wealth – the resultssuggest that higher <strong>manager</strong>ial <strong>ownership</strong> actually leads to inferior, not superior <strong>fund</strong> <strong>performance</strong>. This means that the US findings cannot necessarily be generalized to other markets.An examination of the determinants of <strong>manager</strong>ial <strong>ownership</strong> points to a couple of factors,which help to explain the amount of <strong>ownership</strong>. First, <strong>manager</strong>ial <strong>ownership</strong> is higher in morevolatile <strong>fund</strong>s, suggesting that <strong>portfolio</strong> <strong>manager</strong>s are risk-takers in nature. This, on the other hand,explains at least a part of the inverse relation between <strong>ownership</strong> and <strong>performance</strong>, since despitehigher risks, the <strong>fund</strong>s with positive <strong>manager</strong>ial <strong>ownership</strong> do not exhibit higher returns. ReferencesBrown, S., Goetzmann, W., Ibbotson, R., and Ross, S., 1992. Survivorship bias in <strong>performance</strong>sdies. The Review of Financial Studies 5, 553–580.Capon, N., Fitzsimons, G. and Prince, R., 1996. An individal level analysis of the mutual <strong>fund</strong>investment decision. Journal of Financial Services Research 10, 59–82.Evans, A.L. (2008). Portfolio <strong>manager</strong> <strong>ownership</strong> and mutual <strong>fund</strong> <strong>performance</strong>. Financial Management 373,513–534.Gallaher, S. Kaniel, R. and Starks, L., 2006. Madison Avenue meets Wall Stree Mutual <strong>fund</strong> families,competition and adertising. Working Paper, UT Austin and Duke University.Carhart, M., 1997. On persistence in mutual <strong>fund</strong> <strong>performance</strong>. Journal of Finance 52, 57–82.Gaspar, J-M., Massa, M. and Matos, P., 2006. Favoritism in mutual <strong>fund</strong> families? Evidence on strategiccross-<strong>fund</strong> subsidization. Journal of Finance 61, 73–104.Goetzmann, W. and Ibbotson, R., 1994. Do winners repeat? Journal of Portfolio Management 20, 9–18.Grinblatt, M., and Titman, S., 1992. The persisence persistence of mal mutual fnd <strong>fund</strong> <strong>performance</strong>. Journal of Finance 47,1977–1984.Hendricks, D., Patel, J. and Zeckhauser, R., 1993. Hot hands in mutual <strong>fund</strong>s short-run persistenceof <strong>performance</strong> 1974–88. Journal of Finance 48, 93–130.Khorana, A., Servaes, H. and Wedge, L., 2007. Portfolio <strong>manager</strong> <strong>ownership</strong> and <strong>fund</strong> <strong>performance</strong>.Journal of Financial Economics 85, 179–204.Knuutila, M., Puttonen,V. and Smythe, T., 2006. The effect of distribution channels on mutual <strong>fund</strong>flows. Journal of Financial Services Marketing 12, 88–96.Korkeamäki, T. and Smythe, T., 2004. Effects of market segmentation and bank concentration on mutual<strong>fund</strong> expenses and returns evidence from Finland. European Financial Management 10, 413–438.Sirri, E., Tufano, P., 1998. Costly search and mutual <strong>fund</strong> flows. Journal of Finance 53, 1589–1622.1 1 1