5. Analysis of Trace Lead in Water by Anodic Stripping Voltammetry ...
5. Analysis of Trace Lead in Water by Anodic Stripping Voltammetry ...
5. Analysis of Trace Lead in Water by Anodic Stripping Voltammetry ...

Create successful ePaper yourself
Turn your PDF publications into a flip-book with our unique Google optimized e-Paper software.
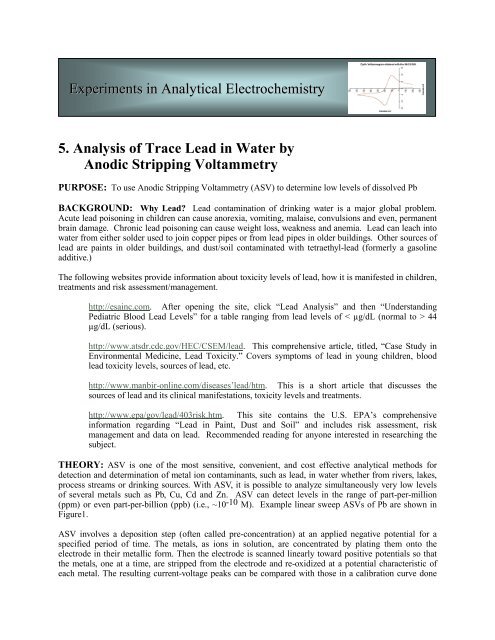
Experiments <strong>in</strong> Analytical Electrochemistry<strong>5.</strong> <strong>Analysis</strong> <strong>of</strong> <strong>Trace</strong> <strong>Lead</strong> <strong>in</strong> <strong>Water</strong> <strong>by</strong><strong>Anodic</strong> Stripp<strong>in</strong>g <strong>Voltammetry</strong>PURPOSE: To use <strong>Anodic</strong> Stripp<strong>in</strong>g <strong>Voltammetry</strong> (ASV) to determ<strong>in</strong>e low levels <strong>of</strong> dissolved PbBACKGROUND: Why <strong>Lead</strong>? <strong>Lead</strong> contam<strong>in</strong>ation <strong>of</strong> dr<strong>in</strong>k<strong>in</strong>g water is a major global problem.Acute lead poison<strong>in</strong>g <strong>in</strong> children can cause anorexia, vomit<strong>in</strong>g, malaise, convulsions and even, permanentbra<strong>in</strong> damage. Chronic lead poison<strong>in</strong>g can cause weight loss, weakness and anemia. <strong>Lead</strong> can leach <strong>in</strong>towater from either solder used to jo<strong>in</strong> copper pipes or from lead pipes <strong>in</strong> older build<strong>in</strong>gs. Other sources <strong>of</strong>lead are pa<strong>in</strong>ts <strong>in</strong> older build<strong>in</strong>gs, and dust/soil contam<strong>in</strong>ated with tetraethyl-lead (formerly a gasol<strong>in</strong>eadditive.)The follow<strong>in</strong>g websites provide <strong>in</strong>formation about toxicity levels <strong>of</strong> lead, how it is manifested <strong>in</strong> children,treatments and risk assessment/management.http://esa<strong>in</strong>c.com. After open<strong>in</strong>g the site, click “<strong>Lead</strong> <strong>Analysis</strong>” and then “Understand<strong>in</strong>gPediatric Blood <strong>Lead</strong> Levels” for a table rang<strong>in</strong>g from lead levels <strong>of</strong> < µg/dL (normal to > 44µg/dL (serious).http://www.atsdr.cdc.gov/HEC/CSEM/lead. This comprehensive article, titled, “Case Study <strong>in</strong>Environmental Medic<strong>in</strong>e, <strong>Lead</strong> Toxicity.” Covers symptoms <strong>of</strong> lead <strong>in</strong> young children, bloodlead toxicity levels, sources <strong>of</strong> lead, etc.http://www.manbir-onl<strong>in</strong>e.com/diseases’lead/htm. This is a short article that discusses thesources <strong>of</strong> lead and its cl<strong>in</strong>ical manifestations, toxicity levels and treatments.http://www.epa/gov/lead/403risk.htm. This site conta<strong>in</strong>s the U.S. EPA’s comprehensive<strong>in</strong>formation regard<strong>in</strong>g “<strong>Lead</strong> <strong>in</strong> Pa<strong>in</strong>t, Dust and Soil” and <strong>in</strong>cludes risk assessment, riskmanagement and data on lead. Recommended read<strong>in</strong>g for anyone <strong>in</strong>terested <strong>in</strong> research<strong>in</strong>g thesubject.THEORY: ASV is one <strong>of</strong> the most sensitive, convenient, and cost effective analytical methods fordetection and determ<strong>in</strong>ation <strong>of</strong> metal ion contam<strong>in</strong>ants, such as lead, <strong>in</strong> water whether from rivers, lakes,process streams or dr<strong>in</strong>k<strong>in</strong>g sources. With ASV, it is possible to analyze simultaneously very low levels<strong>of</strong> several metals such as Pb, Cu, Cd and Zn. ASV can detect levels <strong>in</strong> the range <strong>of</strong> part-per-million(ppm) or even part-per-billion (ppb) (i.e., ~10 -10 M). Example l<strong>in</strong>ear sweep ASVs <strong>of</strong> Pb are shown <strong>in</strong>Figure1.ASV <strong>in</strong>volves a deposition step (<strong>of</strong>ten called pre-concentration) at an applied negative potential for aspecified period <strong>of</strong> time. The metals, as ions <strong>in</strong> solution, are concentrated <strong>by</strong> plat<strong>in</strong>g them onto theelectrode <strong>in</strong> their metallic form. Then the electrode is scanned l<strong>in</strong>early toward positive potentials so thatthe metals, one at a time, are stripped from the electrode and re-oxidized at a potential characteristic <strong>of</strong>each metal. The result<strong>in</strong>g current-voltage peaks can be compared with those <strong>in</strong> a calibration curve done
with standard solutions <strong>of</strong> known quantities <strong>of</strong> metal ions. Besides determ<strong>in</strong><strong>in</strong>g which metals are present,the quantity <strong>of</strong> each metal can be correlated to the peak height <strong>of</strong> the current or the <strong>in</strong>tegrated chargeunder the peak.-165D-145-125-105AB100 ppb200 ppbCurrent, µA-85-65CCD500 ppb1000 ppb-45-25BA-5Potential, mV vs Ag/AgCl reference electrodeFigure 1. L<strong>in</strong>ear scan ASV <strong>of</strong> Pb us<strong>in</strong>g a th<strong>in</strong> Hg film electrode on glassy carbon. Experimentalconditions: deposition time 2.0 m<strong>in</strong>utes a with 30 second rest period before scann<strong>in</strong>g. Initialpotential at -1,000 mV and f<strong>in</strong>al potential at +200 mV. Scan rate = 2 V/s with the Hg film codepositedwith Pb dur<strong>in</strong>g the deposition step. Data files were exported to Excel and plotted withthe potential scale set from –200 to –600 mV. If you are unfamiliar with the use <strong>of</strong> Excelprogram, please consult the Technical Note on Excel <strong>in</strong> this eChem Manual.ASV was orig<strong>in</strong>ally developed with a hang<strong>in</strong>g Hg drop electrode where the metals <strong>of</strong>ten form anamalgam. However, to limit the quantity <strong>of</strong> toxic Hg used, th<strong>in</strong> Hg films can be pre-deposited onto anelectrode such as glassy carbon or co-deposited simultaneously with the analyte metal ions. The amount<strong>of</strong> Hg deposited is very little and can be readily removed at potentials less negative than those <strong>of</strong> theanalyte metals, such as Pb, Cd and Cu. References 1-5 <strong>in</strong>clude web-based onl<strong>in</strong>e ASV articles andhardcopy references on the subject.EXPERIMENT-600 -500 -400 -300 -200Equipment• Use an analog or computer-controlled potentiostat with appropriate data acquisition equipmentfor this experiment (ask your lab <strong>in</strong>structor for directions on use <strong>of</strong> potentiostat)• Electrochemical cell and electrodeso Small volume cello 1.0 mm or 3.0 mm flat tipped glassy carbon electrodeo Pt auxiliary electrodeo Ag/AgCl reference electrodeo Polish<strong>in</strong>g kit• A magnetic stirrer and a small bar <strong>in</strong>side the cell2
• A timer• 50 ml and 100 ml volumetric flasksChemical SolutionsA. Prepare three separate 100 mL solutions at 100 ppb, 500 ppb and 1,000 ppb <strong>of</strong> Pb(NO 3 ) 2conta<strong>in</strong><strong>in</strong>g 0.1 M KNO 3 , 50 mM HNO 3 and 40 ppm Hg(NO 3 ) 2 . Use doubly distilled water orother high purity water for dilutions.B. Prepare a background solution conta<strong>in</strong><strong>in</strong>g 0.1 M KNO 3 , 50 mM HNO 3 and 40 ppm Hg(NO 3 ) 2 .C. Dilute a sample <strong>of</strong> tap water or an unknown sample from your <strong>in</strong>structor. Prepare the sample <strong>by</strong>add<strong>in</strong>g an equal volume <strong>of</strong> 0.1 M KNO 3 conta<strong>in</strong><strong>in</strong>g 50 mM HNO 3 and 40 ppm Hg(NO 3 ) 2 .Note: It is important that glassware is cleaned thoroughly, r<strong>in</strong>sed several times with pure waterand then dried prior to use. You should look at the bottle labels <strong>of</strong> chemicals to note the amount<strong>of</strong> heavy metal impurities, if any are present. High purity reagents, absent <strong>of</strong> heavy metalimpurities, can be purchased. Discuss this issue with the laboratory <strong>in</strong>structor. Calibration us<strong>in</strong>gthe method <strong>of</strong> standard addition can correct for impurity if it is the same as the sought for metal.PROCEDURE1. Connect the cell (3- electrodes) to potentiostat (see <strong>in</strong>structor for direction or manual forpotentiostat use)2. Place the cell on top <strong>of</strong> the magnetic stirrer and put the stirr<strong>in</strong>g bar, the auxiliary Pt and theAg/AgCl reference electrode <strong>in</strong> place.3. Polish the glassy carbon electrode under light pressure with an alum<strong>in</strong>a slurry on a micro-clothpolish<strong>in</strong>g pad us<strong>in</strong>g a figure 8 motion. Five to 10 complete figure 8 trac<strong>in</strong>gs should be sufficient.R<strong>in</strong>se the electrode immediately with pure water and remove any excess water <strong>by</strong> touch<strong>in</strong>g anedge to a Kimwipe or clean adsorbent paper. Fit the electrode <strong>in</strong>to the cell. Further discussionon the activation <strong>of</strong> glassy carbon electrode may be found <strong>in</strong> the technical notes <strong>of</strong> this manual.4. Add the 100 ppb Pb sample <strong>in</strong> the cell and replace the cover with the electrodes.<strong>5.</strong> Set the applied potential, Ei, at –900 mV, the f<strong>in</strong>al potential, E f , to = 0.00 mV and the sensitivityto 1 µA/V.6. Turn the magnetic stirrer ON, set the timer for 2 m<strong>in</strong>utes and then switch the potentiostat to theON position so that –900 mV is applied to the glassy carbon electrode. Turn the stirrer <strong>of</strong>f/onwith an <strong>in</strong>l<strong>in</strong>e switch and leave the speed controller set to the same sett<strong>in</strong>g to ma<strong>in</strong>ta<strong>in</strong> the samestirr<strong>in</strong>g rate from experiment to experiment.7. If the current overload light turns on, decrease the sensitivity.8. After 90 seconds, turn the stirrer <strong>of</strong>f so that the solution quiets.9. When the timer goes <strong>of</strong>f after 2 m<strong>in</strong>utes, push the scan button ON so that the potential is scannedfrom Ei <strong>of</strong> –900 mV to 0.00 mV. A scan rate <strong>of</strong> 500 mV/sec is recommended. A higher scanrate lessens the possibility <strong>of</strong> error due to oxygen <strong>in</strong> the solution oxidiz<strong>in</strong>g the deposited metal,like Pb, on the electrode.10. Remove the Hg film <strong>by</strong> stepp<strong>in</strong>g the potential to +400 mV for 30 seconds. Do not re-polish theelectrode between runs.3
11. Repeat the experiment with the background solution and then with all three standard Pbsolutions, runn<strong>in</strong>g duplicates for each concentration. Always remove the Hg film between runs.Next, run duplicates on the unknown water sample.12. Plot the peak heights vs. concentration for the blank and standards and then determ<strong>in</strong>e theamount <strong>of</strong> Pb <strong>in</strong> the tap water from the calibration plot (not<strong>in</strong>g where the peak height <strong>of</strong> thesample lies on the plot <strong>of</strong> the standard solutions).13. Do a l<strong>in</strong>ear regression analysis to confirm the ppb lead <strong>in</strong> the unknown water sample (run atleast duplicates on the standards and the sample if time permits).Note: If you are us<strong>in</strong>g a computer-controlled potentiostat like the CS-1200, the procedure for theanalysis <strong>of</strong> lead is the same as that described above. With this <strong>in</strong>strument, you can and shouldscan at rates as high as 1 or 2 V/s. The tim<strong>in</strong>g and potentials can be set with the computer menubut please remember to turn the stirrer <strong>of</strong>f at the preset time <strong>of</strong> 2 m<strong>in</strong>utes.REPORT ( Data <strong>Analysis</strong> and Discussion):Consult with the laboratory supervisor about the content and format <strong>of</strong> your report for this experiment.Suggestions and questions to consider are as follows:1. Write a short summery <strong>of</strong> what you did <strong>in</strong> this experiment, not<strong>in</strong>g any deviations or substitutions<strong>in</strong> the procedure.2. Show example stripp<strong>in</strong>g voltammograms for Pb at 2 or more concentrations. Plot Ip vs. Pbconcentration (both the uncorrected and corrected for background) and from the plot, determ<strong>in</strong>ethe concentration <strong>of</strong> the Pb <strong>in</strong> the unknown sample. [Note: If you could not detect a peak for Pb<strong>in</strong> your unknown, the amount <strong>of</strong> Pb is most likely below 10 ppb.]3. Were there other metals present <strong>in</strong> the water sample as evidenced <strong>by</strong> other peaks? If yes, howcan you identify the metal or metals?4. If your unknown is tap water, the amount <strong>of</strong> Pb may depend on whether the water was leftstand<strong>in</strong>g <strong>in</strong> the pipes for hours or days, or whether you let the water run for a few m<strong>in</strong>utes beforesampl<strong>in</strong>g. If time permits, you may wish to see whether there is a difference <strong>in</strong> the quantity <strong>of</strong> Pbdepend<strong>in</strong>g on the sampl<strong>in</strong>g time.<strong>5.</strong> If time permits, make a run with 100 ppb without the co-deposition <strong>of</strong> Hg and report what youobserved <strong>in</strong> the way <strong>of</strong> the Pb ASV wave shape and height, and compare it to the result with theHg film.Note: It is important to use high purity water throughout <strong>in</strong> mak<strong>in</strong>g solutions and high purityreagents that are designated as be<strong>in</strong>g free <strong>of</strong> heavy metals. Besides trace amounts <strong>of</strong> Pb <strong>in</strong>reagents, copper is usually the ma<strong>in</strong> contam<strong>in</strong>ant.4
REFERENCES:1. http://www.luc.edu/chemistry/faculty/fitch/Fitchgroup/Service_Learn<strong>in</strong>g/service_learn<strong>in</strong>g.html A website ma<strong>in</strong>ta<strong>in</strong>ed <strong>by</strong> Pr<strong>of</strong>essor Alanah Fitch <strong>of</strong> Loyola University (Chicago, IL) onenvironmental Pb analysis, etc.2. http://www.tau.ac.il/~advanal/LaboratoryManual.htm This is a laboratory manual withexperiments <strong>in</strong> electroanalytical chemistry applications to the analysis <strong>of</strong> dr<strong>in</strong>k<strong>in</strong>g water, asma<strong>in</strong>ta<strong>in</strong>ed <strong>by</strong> Tel Aviv University. Experiment #6 is a description <strong>of</strong> heavy metal analysis <strong>by</strong>stripp<strong>in</strong>g voltammetry.3. Allen J. Bard and Larry R. Faulkner, Electrochemical Methods: Fundamentals and Applications;Publisher, John Wiley & Sons 2 nd Ed. 2001. Chapter 11, pgs 458-464.4. Howard A. Strobel and Wm. R. He<strong>in</strong>eman, Chemical Instrumentation: A Systematic Approach;Publisher Wiley Interscience, 3 rd Ed. 1989. Chapter 30, pgs. 1137-1141.<strong>5.</strong> Joseph Wang, <strong>Anodic</strong> Stripp<strong>in</strong>g <strong>Voltammetry</strong>: An Instrumental <strong>Analysis</strong> Experiment, J. Chem.Ed. 60, December 1983, pgs. 1074-107<strong>5.</strong>OPTIONAL EXPERIMENT – Differential Pulse <strong>Voltammetry</strong> (DPV)Differential Pulse <strong>Voltammetry</strong> requires a computer-controlled or programmable potentiostat.. DPVprovides excellent high sensitivity. However, the method uses pulse waveforms so that ASV takes longerand <strong>in</strong>terference from oxygen can becomes significant. Thus, it is advisable to remove oxygen fromsolutions <strong>by</strong> purg<strong>in</strong>g them with nitrogen for a few m<strong>in</strong>utes. Otherwise, the procedure is the same asalready outl<strong>in</strong>ed above. Discuss with the laboratory <strong>in</strong>structor about how to set the operat<strong>in</strong>g parameters<strong>of</strong> the potentiostat for DPV.If you use computer data acquisition, it is useful to export the ASCII data to an Excel file and computerssubtract the “blank” background scan from the Pb ones. The basel<strong>in</strong>e will be nearly flat afterbackground subtraction (e.g., Figure 2) so that it is easy to determ<strong>in</strong>e the peak heights.Use the standard lead solutions from Part A, under Chemical Solutions, for the ASV experiment.Current, µA-30-25-20-15-10-50ABCDEBlank100 ppb Pb200 ppb Pb500 ppb Pb1000 ppb Pb-800 -700 -600 -500 -400 -300 -200EDCBAPotential, mV vs. Ag/AgClFigure 2. Example Pb ASV withdifferential pulse voltammetry.Deposition time is 2 m<strong>in</strong>utes with 30second rest period before ASV from –1,000 mV to +200 mV with a stepheight <strong>of</strong> 2 mV. The cycle period is20 ms with a pulse height <strong>of</strong> 50 mV.The Hg film is co-deposited with thePb dur<strong>in</strong>g the deposition step. Datawere obta<strong>in</strong>ed with CS-1200computer-controlled potentiostat.Data exported to Excel and plottedwith the potential scale set from –200mV to –800 mV. If you areunfamiliar with the use <strong>of</strong> Excelprogram, please consult theTechnical Note on Excel <strong>in</strong> thiseChem Manual.5