GNUPLOT - A Brief Manual and Tutorial
GNUPLOT - A Brief Manual and Tutorial
GNUPLOT - A Brief Manual and Tutorial

Create successful ePaper yourself
Turn your PDF publications into a flip-book with our unique Google optimized e-Paper software.
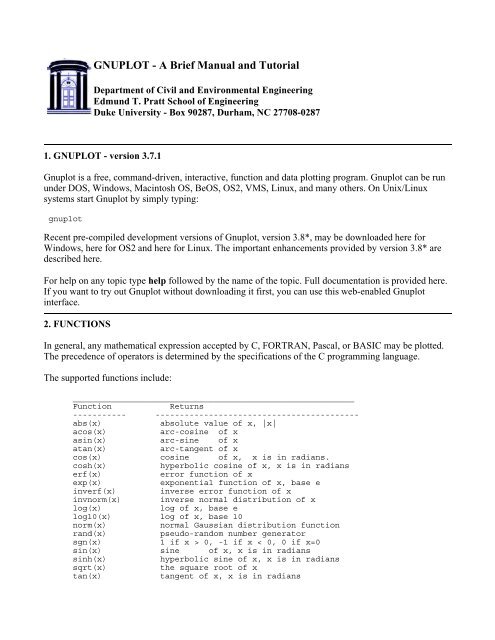
<strong>GNUPLOT</strong> - A <strong>Brief</strong> <strong>Manual</strong> <strong>and</strong> <strong>Tutorial</strong>Department of Civil <strong>and</strong> Environmental EngineeringEdmund T. Pratt School of EngineeringDuke University - Box 90287, Durham, NC 27708-02871. <strong>GNUPLOT</strong> - version 3.7.1Gnuplot is a free, comm<strong>and</strong>-driven, interactive, function <strong>and</strong> data plotting program. Gnuplot can be rununder DOS, Windows, Macintosh OS, BeOS, OS2, VMS, Linux, <strong>and</strong> many others. On Unix/Linuxsystems start Gnuplot by simply typing:gnuplotRecent pre-compiled development versions of Gnuplot, version 3.8*, may be downloaded here forWindows, here for OS2 <strong>and</strong> here for Linux. The important enhancements provided by version 3.8* aredescribed here.For help on any topic type help followed by the name of the topic. Full documentation is provided here.If you want to try out Gnuplot without downloading it first, you can use this web-enabled Gnuplotinterface.2. FUNCTIONSIn general, any mathematical expression accepted by C, FORTRAN, Pascal, or BASIC may be plotted.The precedence of operators is determined by the specifications of the C programming language.The supported functions include:__________________________________________________________FunctionReturns----------- ------------------------------------------abs(x)absolute value of x, |x|acos(x)arc-cosine of xasin(x) arc-sine of xatan(x)arc-tangent of xcos(x) cosine of x, x is in radians.cosh(x)hyperbolic cosine of x, x is in radianserf(x)error function of xexp(x)exponential function of x, base einverf(x)inverse error function of xinvnorm(x) inverse normal distribution of xlog(x)log of x, base elog10(x) log of x, base 10norm(x)normal Gaussian distribution functionr<strong>and</strong>(x)pseudo-r<strong>and</strong>om number generatorsgn(x) 1 if x > 0, -1 if x < 0, 0 if x=0sin(x) sine of x, x is in radianssinh(x)hyperbolic sine of x, x is in radianssqrt(x)the square root of xtan(x)tangent of x, x is in radians
tanh(x) hyperbolic tangent of x, x is in radians___________________________________________________________Bessel, gamma, ibeta, igamma, <strong>and</strong> lgamma functions are alsosupported. Many functions can take complex arguments.Binary <strong>and</strong> unary operators are also supported.The supported operators in Gnuplot are the same as the corresponding operators in the C programminglanguage, except that most operators accept integer, real, <strong>and</strong> complex arguments. The ** operator(exponentiation) is supported as in FORTRAN. Parentheses may be used to change the order ofevaluation. The variable names x, y, <strong>and</strong> z are used as the default independent variables.3. THE plot AND splot COMMANDSplot <strong>and</strong> splot are the primary comm<strong>and</strong>s in Gnuplot. They plot functions <strong>and</strong> data in many many ways.plot is used to plot 2-d functions <strong>and</strong> data, while splot plots 3-d surfaces <strong>and</strong> data.Syntax:plot {[ranges]}{[function] | {"[datafile]" {datafile-modifiers}}}{axes [axes] } { [title-spec] } {with [style] }{, {definitions,} [function] ...}where either a [function] or the name of a data file enclosed in quotes is supplied. For more completedescriptions, type: help plot help plot with help plot using or help plot smooth .3.1 Plotting FunctionsTo plot functions simply type: plot [function] at the gnuplot> prompt.For example, try:gnuplot> plot sin(x)gnuplot> splot sin(x)*cos(y)gnuplot> plot sin(x) title ’Sine Function’, tan(x) title ’Tangent’3.2 Plotting DataDiscrete data contained in a file can be displayed by specifying the name of the data file (enclosed inquotes) on the plot or splot comm<strong>and</strong> line. Data files should have the data arranged in columns ofnumbers. Columns should be separated by white space (tabs or spaces) only, (no commas). Linesbeginning with a # character are treated as comments <strong>and</strong> are ignored by Gnuplot. A blank line in thedata file results in a break in the line connecting data points.For example your data file, force.dat , might look like:# This file is called force.dat# Force-Deflection data for a beam <strong>and</strong> a bar# Deflection Col-Force Beam-Force0.000 0 00.001 104 510.002 202 1010.003 298 148
0.0031 290 1490.004 289 2010.0041 291 2090.005 310 2500.010 311 2600.020 280 240You can display your data by typing:gnuplot> plot "force.dat" using 1:2 title ’Column’, \"force.dat" using 1:3 title ’Beam’Do not type blank space after the line continuation character, "\" .Your data may be in multiple data files. In this case you may make your plot by using a comm<strong>and</strong> like:gnuplot> plot "fileA.dat" using 1:2 title ’data A’, \"fileB.dat" using 1:3 title ’data B’For information on plotting 3-D data, type:gnuplot> help splot using4. CUSTOMIZING YOUR PLOTMany items may be customized on the plot, such as the ranges of the axes, the labels of the x <strong>and</strong> y axes,the style of data point, the style of the lines connecting the data points, <strong>and</strong> the title of the entire plot.4.1 plot comm<strong>and</strong> customizationCustomization of the data columns, line titles, <strong>and</strong> line/point style are specified when the plot comm<strong>and</strong>is issued. Customization of the data columns <strong>and</strong> line titles were discussed in section 3.Plots may be displayed in one of eight styles: lines, points, linespoints, impulses, dots, steps, fsteps,histeps, errorbars, xerrorbars, yerrorbars, xyerrorbars, boxes, boxerrorbars, boxxyerrorbars, financebars,c<strong>and</strong>lesticks or vector To specify the line/point style use the plot comm<strong>and</strong> as follows:gnuplot> plot "force.dat" using 1:2 title ’Column’ with lines, \"force.dat" u 1:3 t ’Beam’ w linespointsNote that the words: using , title , <strong>and</strong> with can be abbreviated as: u , t , <strong>and</strong> w . Also, each line <strong>and</strong> pointstyle has an associated number.4.2 set comm<strong>and</strong> customizationCustomization of the axis ranges, axis labels, <strong>and</strong> plot title, as well as many other features, are specifiedusing the set comm<strong>and</strong>. Specific examples of the set comm<strong>and</strong> follow. (The numerical values used inthese examples are arbitrary.) To view your changes type: replot at the gnuplot> prompt at any time.Create a title:> set title "Force-Deflection Data"
Put a label on the x-axis: > set xlabel "Deflection (meters)"Put a label on the y-axis: > set ylabel "Force (kN)"Change the x-axis range: > set xrange [0.001:0.005]Change the y-axis range: > set yrange [20:500]Have Gnuplot determine ranges: > set autoscaleMove the key: > set key 0.01,100Delete the key:> set nokeyPut a label on the plot: > set label "yield point" at 0.003, 260Remove all labels:> set nolabelPlot using log-axes:> set logscalePlot using log-axes on y-axis: > set nologscale; set logscale yChange the tic-marks: > set xtics (0.002,0.004,0.006,0.008)Return to the default tics: > set noxtics; set xticsOther features which may be customized using the set comm<strong>and</strong> are: arrow, border, clip, contour, grid,mapping, polar, surface, time, view, <strong>and</strong> many more. The best way to learn is by reading the on-line helpinformation, trying the comm<strong>and</strong>, <strong>and</strong> reading the Gnuplot manual. You may also post questions to thenewsgroup comp.graphics.apps.gnuplotThe Gnuplot demo page <strong>and</strong> the gnuplot intro page have many examples like this script for a transferfunction producing this postscript plot.5. PLOTTING DATA FILES WITH OTHER COMMENT CHARACTERSIf your data file has a comment character other than # you can pass your data file through the tr filter asyou plot it. For example, if your data file has % comment characters (for Matlab compatability) typinggnuplot> plot "< tr ’%’ ’#’ < datafile"will replace all % characters with # characters prior to plotting.6. <strong>GNUPLOT</strong> SCRIPTSSometimes, several comm<strong>and</strong>s are typed to create a particular plot, <strong>and</strong> it is easy to make atypographical error when entering a comm<strong>and</strong>. To stream- line your plotting operations, several Gnuplotcomm<strong>and</strong>s may be combined into a single script file. For example, the following file will create acustomized display of the force-deflection data:# Gnuplot script file for plotting data in file "force.dat"# This file is called force.pset title "Force Deflection Data for a Beam <strong>and</strong> a Column"set xlabel "Deflection (meters)"set ylabel "Force (kN)"set key 0.01,100set label "Yield Point" at 0.003,260set arrow from 0.0028,250 to 0.003,280set xr [0.0:0.022]set yr [0:325]plot "force.dat" using 1:2 title ’Column’ with linespoints , \"force.dat" using 1:3 title ’Beam’ with pointsThen the total plot can be generated with the comm<strong>and</strong>: gnuplot> load ’force.p’
7. CURVE-FITTING WITH <strong>GNUPLOT</strong>To fit the data in force.dat with a function use the comm<strong>and</strong>s:f1(x) = a1*tanh(x/b1)# define the function to be fita1 = 300; b1 = 0.005;# initial guess for a1 <strong>and</strong> b1fit f1(x) ’force.dat’ using 1:2 via a1, b1Final set of parametersAsymptotic St<strong>and</strong>ard Error======================= ==========================a1 = 308.687 +/- 10.62 (3.442%)b1 = 0.00226668 +/- 0.0002619 (11.55%)<strong>and</strong> the comm<strong>and</strong>s:f2(x) = a2 * tanh(x/b2)# define the function to be fita2 = 300; b2 = 0.005;# initial guess for a <strong>and</strong> bfit f2(x) ’force.dat’ using 1:3 via a2, b2Final set of parametersAsymptotic St<strong>and</strong>ard Error======================= ==========================a2 = 259.891 +/- 12.82 (4.933%)b2 = 0.00415497 +/- 0.0004297 (10.34%)The curve-fit <strong>and</strong> data may now be plotted with the comm<strong>and</strong>s:set key 0.018,150 title "F(x) = A tanh (x/B)"# title to key!set title "Force Deflection Data \n <strong>and</strong> curve fit" # note newline!set pointsize 1.5# larger point!set xlabel ’Deflection, {/Symbol D}_x (m)’# Greek symbols!set ylabel ’Force, {/Times-Italic F}_A, (kN)’# italics!plot "force.dat" using 1:2 title ’Column data’ with points 3, \"force.dat" using 1:3 title ’Beam data’ with points 4, \
a1 * tanh( x / b1 ) title ’Column-fit: A=309, B=0.00227’, \a2 * tanh( x / b2 ) title ’Beam-fit: A=260, B=0.00415’8. SPREAD-SHEET LIKE CALCULATIONS ON DATAGnuplot can mathematically modify your data column by column:to plot sin( col.3 + col.1 ) vs. 3 * col.2 type:plot ’force.dat’ using (3*$2):(sin($3+$1))9. MULTI-PLOTGnuplot can plot more than one figure in a frame ( like subplot in matlab ) i.e., try:set multiplot;set size 1,0.5;set origin 0.0,0.5;set origin 0.0,0.0;set nomultiplotplot sin(x);plot cos(x)10. HARD-COPY (PLOTTING ON PAPER)You can create a Post-Script file of your plot by using the following files <strong>and</strong> comm<strong>and</strong>s. First, create ageneral-purpose script file:
# File name: saveplot - saves a plot as a PostScript file# to save the current plot as a postscript file issue the comm<strong>and</strong>s:# gnuplot> set out ’plotfile.ps’# gnuplot> load ’saveplot’set size 1.0, 0.4set terminal postscript portrait enhanced mono lw 2 "Helvetica" 14replotset terminal x11set size 1,1Then you can simply type the following comm<strong>and</strong>s to create <strong>and</strong> laser-print the hard-copy.gnuplot> set out "force.ps"gnuplot> load ’saveplot’gnuplot> !lpr -Pteerlp1 force.ps11. ADVANCED COMPUTATION AND VISUALIZATIONGnuplot is used for plotting in a free <strong>and</strong> open Matlab-like programming environment called Octave.12. PRINTING TWO FIGURES ON ONE PAGEIf you would like two figures to be laser-printed on the same page, you may use the following shellscript. Create file cat2 , below, <strong>and</strong> make the file executable by typing: unix% chmod +x cat2# cat2: Shell script for putting two Gnuplot plots on one pageecho %! > g.psecho gsave >> g.psecho 0 400 translate >> g.ps# for Gnuplot plotscat $1 | sed -e "s/showpage//" >> g.psecho grestore >> g.psecho gsave >> g.psecho 0 090 translate >> g.ps# for Gnuplot plotscat $2 >> g.pslpr -Phudsonlp1 g.psTo combine two Post-Script figures (plot1.ps <strong>and</strong> plot2.ps) on one page:cat2 plot1.ps plot2.ps© 2000-2002 Henri P. Gavin; Last Updated: Decmeber 18, 2002