GNUPLOT - A Brief Manual and Tutorial
GNUPLOT - A Brief Manual and Tutorial
GNUPLOT - A Brief Manual and Tutorial

Create successful ePaper yourself
Turn your PDF publications into a flip-book with our unique Google optimized e-Paper software.
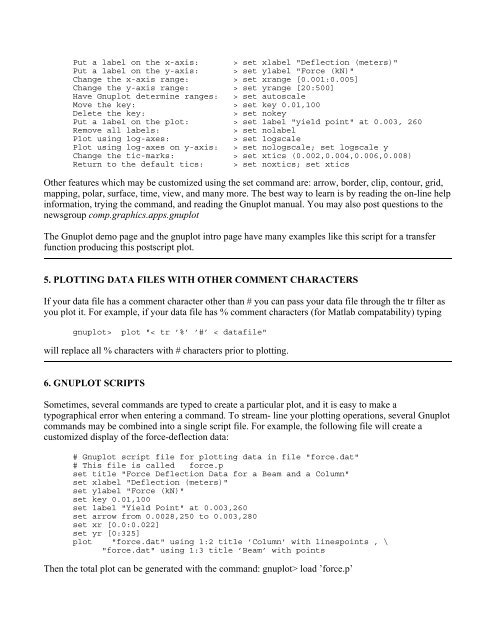
Put a label on the x-axis: > set xlabel "Deflection (meters)"Put a label on the y-axis: > set ylabel "Force (kN)"Change the x-axis range: > set xrange [0.001:0.005]Change the y-axis range: > set yrange [20:500]Have Gnuplot determine ranges: > set autoscaleMove the key: > set key 0.01,100Delete the key:> set nokeyPut a label on the plot: > set label "yield point" at 0.003, 260Remove all labels:> set nolabelPlot using log-axes:> set logscalePlot using log-axes on y-axis: > set nologscale; set logscale yChange the tic-marks: > set xtics (0.002,0.004,0.006,0.008)Return to the default tics: > set noxtics; set xticsOther features which may be customized using the set comm<strong>and</strong> are: arrow, border, clip, contour, grid,mapping, polar, surface, time, view, <strong>and</strong> many more. The best way to learn is by reading the on-line helpinformation, trying the comm<strong>and</strong>, <strong>and</strong> reading the Gnuplot manual. You may also post questions to thenewsgroup comp.graphics.apps.gnuplotThe Gnuplot demo page <strong>and</strong> the gnuplot intro page have many examples like this script for a transferfunction producing this postscript plot.5. PLOTTING DATA FILES WITH OTHER COMMENT CHARACTERSIf your data file has a comment character other than # you can pass your data file through the tr filter asyou plot it. For example, if your data file has % comment characters (for Matlab compatability) typinggnuplot> plot "< tr ’%’ ’#’ < datafile"will replace all % characters with # characters prior to plotting.6. <strong>GNUPLOT</strong> SCRIPTSSometimes, several comm<strong>and</strong>s are typed to create a particular plot, <strong>and</strong> it is easy to make atypographical error when entering a comm<strong>and</strong>. To stream- line your plotting operations, several Gnuplotcomm<strong>and</strong>s may be combined into a single script file. For example, the following file will create acustomized display of the force-deflection data:# Gnuplot script file for plotting data in file "force.dat"# This file is called force.pset title "Force Deflection Data for a Beam <strong>and</strong> a Column"set xlabel "Deflection (meters)"set ylabel "Force (kN)"set key 0.01,100set label "Yield Point" at 0.003,260set arrow from 0.0028,250 to 0.003,280set xr [0.0:0.022]set yr [0:325]plot "force.dat" using 1:2 title ’Column’ with linespoints , \"force.dat" using 1:3 title ’Beam’ with pointsThen the total plot can be generated with the comm<strong>and</strong>: gnuplot> load ’force.p’