ANNUAL REPORT - Hidden Villa
ANNUAL REPORT - Hidden Villa
ANNUAL REPORT - Hidden Villa

Create successful ePaper yourself
Turn your PDF publications into a flip-book with our unique Google optimized e-Paper software.
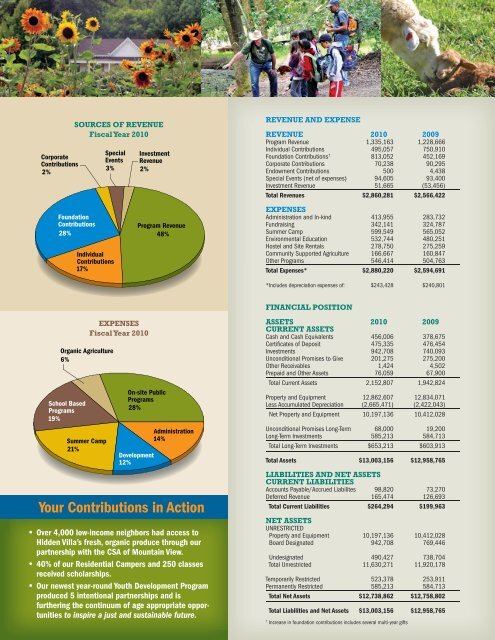
Sources SourceS of Revenueof Fiscal revenue Year 2010Sources of Revenue fiscal Year Fiscal 2010 Year 2010CorporateCorporateContributionsContributions 2%2%SpecialSpecialEventsEvents 3%3%FoundationFoundation ContributionsContributions 28%28%IndividualIndividual ContributionsContributions 17%17%InvestmentInvestmentRevenueRevenue 2%2%Program RevenueProgram 48% Revenue48%revenue AnD expenSerevenue 2010 2009Program Revenue 1,335,163 1,228,666Individual Contributions 495,057 750,910Foundation Contributions † 813,052 452,169Corporate Contributions 70,238 90,295Endowment Contributions 500 4,438Special Events (net of expenses) 94,605 93,400Investment Revenue 51,665 (53,456)Total Revenues $2,860,281 $2,566,422expenSeSAdministration and In-kind 413,955 283,732Fundraising 342,141 324,787Summer Camp 599,549 565,052Environmental Education 532,744 480,251Hostel and Site Rentals 278,750 275,259Community Supported Agriculture 166,667 160,847Other Programs 546,414 504,763Total Expenses* $2,880,220 $2,594,691*Includes depreciation expenses of: $243,428 $240,801Expenses Fiscal Year 2010Expenses expenSeSFiscal Year 2010fiscal Year 2010Organic AgricultureOrganic 6% Agriculture6%School BasedSchool Programs BasedPrograms 19%19%Summer CampSummer 21% Camp21%On-site PublicOn-site Programs PublicPrograms 28%28%AdministrationAdministration14%14%DevelopmentDevelopment 12%12%Your Contributions in Action• Over 4,000 low-income neighbors had access to<strong>Hidden</strong> <strong>Villa</strong>’s fresh, organic produce through ourpartnership with the CSA of Mountain View.• 40% of our Residential Campers and 250 classesreceived scholarships.• Our newest year-round Youth Development Programproduced 5 intentional partnerships and isfurthering the continuum of age appropriate opportunitiesto inspire a just and sustainable future.fInAncIAL poSITIonASSeTScurrenT ASSeTS2010 2009Cash and Cash Equivalents 456,006 378,675Certificates of Deposit 475,335 476,454Investments 942,708 740,093Unconditional Promises to Give 201,275 275,200Other Receivables 1,424 4,502Prepaid and Other Assets 76,059 67,900Total Current Assets 2,152,807 1,942,824Property and Equipment 12,862,607 12,834,071Less Accumulated Depreciation (2,665,471) (2,422,043)Net Property and Equipment 10,197,136 10,412,028Unconditional Promises Long-Term 68,000 19,200Long-Term Investments 585,213 584,713Total Long-Term Investments $653,213 $603,913Total Assets $13,003,156 $12,958,765LIABILITIeS AnD neT ASSeTScurrenT LIABILITIeSAccounts Payable/Accrued Liabilites 98,820 73,270Deferred Revenue 165,474 126,693Total Current Liabilities $264,294 $199,963neT ASSeTSUNRESTRICTEDProperty and Equipment 10,197,136 10,412,028Board Designated 942,708 769,446Undesignated 490,427 738,704Total Unrestricted 11,630,271 11,920,178Temporarily Restricted 523,378 253,911Permanently Restricted 585,213 584,713Total Net Assets $12,738,862 $12,758,802Total Liabilities and Net Assets $13,003,156 $12,958,765†Increase in foundation contributions includes several multi-year gifts