High-frequency restoration of surface seismic data - Arcis
High-frequency restoration of surface seismic data - Arcis
High-frequency restoration of surface seismic data - Arcis
- No tags were found...

Create successful ePaper yourself
Turn your PDF publications into a flip-book with our unique Google optimized e-Paper software.
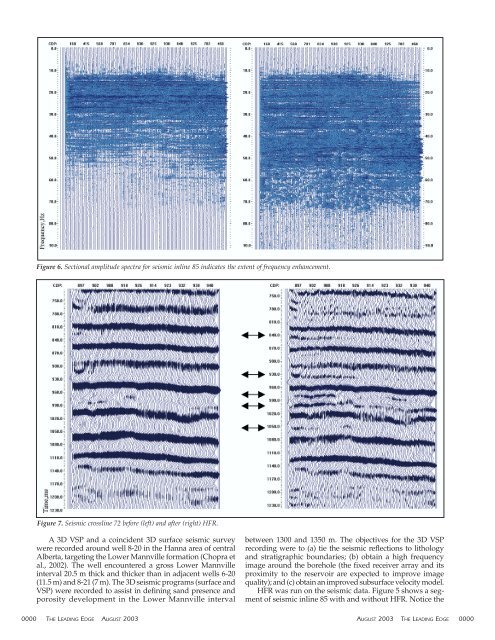
Figure 6. Sectional amplitude spectra for <strong>seismic</strong> inline 85 indicates the extent <strong>of</strong> <strong>frequency</strong> enhancement.Figure 7. Seismic crossline 72 before (left) and after (right) HFR.A3D VSP and a coincident 3D <strong>surface</strong> <strong>seismic</strong> surveywere recorded around well 8-20 in the Hanna area <strong>of</strong> centralAlberta, targeting the Lower Mannville formation (Chopra etal., 2002). The well encountered a gross Lower Mannvilleinterval 20.5 m thick and thicker than in adjacent wells 6-20(11.5 m) and 8-21 (7 m). The 3D <strong>seismic</strong> programs (<strong>surface</strong> andVSP) were recorded to assist in defining sand presence andporosity development in the Lower Mannville intervalbetween 1300 and 1350 m. The objectives for the 3D VSPrecording were to (a) tie the <strong>seismic</strong> reflections to lithologyand stratigraphic boundaries; (b) obtain a high <strong>frequency</strong>image around the borehole (the fixed receiver array and itsproximity to the reservoir are expected to improve imagequality); and (c) obtain an improved sub<strong>surface</strong> velocity model.HFR was run on the <strong>seismic</strong> <strong>data</strong>. Figure 5 shows a segment<strong>of</strong> <strong>seismic</strong> inline 85 with and without HFR. Notice the0000 THE LEADING EDGE AUGUST 2003 AUGUST 2003 THE LEADING EDGE 0000