- Page 1 and 2: FAOFISHERIES ANDAQUACULTURETECHNICA
- Page 4 and 5: The designations employed and the p
- Page 7 and 8: iiiPreparation of this documentThe
- Page 9 and 10: vContentsDedicationPreparation of t
- Page 11 and 12: viiAcknowledgementsThis document is
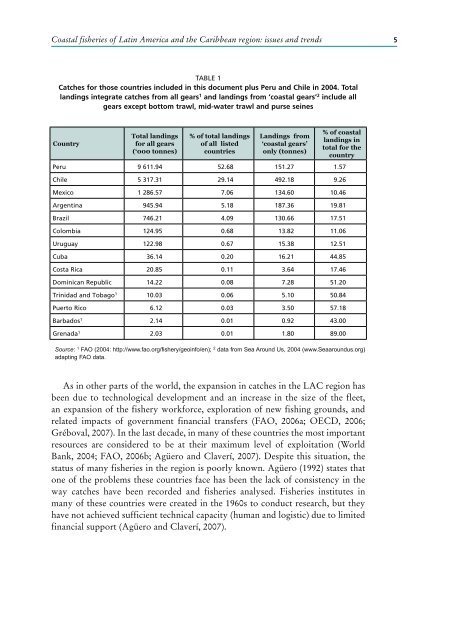
- Page 13 and 14: 11. Coastal fisheries of LatinAmeri
- Page 18 and 19: 6Coastal fisheries of Latin America
- Page 20 and 21: 8Coastal fisheries of Latin America
- Page 22: 10Coastal fisheries of Latin Americ
- Page 25 and 26: 132. Coastal fisheries of Argentina
- Page 27 and 28: Coastal fisheries of Argentina 15FI
- Page 29 and 30: Coastal fisheries of Argentina 17At
- Page 31 and 32: Coastal fisheries of Argentina 19TA
- Page 33 and 34: Coastal fisheries of Argentina 212.
- Page 35 and 36: Coastal fisheries of Argentina 23TA
- Page 37 and 38: Coastal fisheries of Argentina 25FI
- Page 39 and 40: Coastal fisheries of Argentina 27ta
- Page 41 and 42: Coastal fisheries of Argentina 29FI
- Page 43 and 44: Coastal fisheries of Argentina 31Be
- Page 45 and 46: Coastal fisheries of Argentina 33bo
- Page 47 and 48: Coastal fisheries of Argentina 35pa
- Page 49 and 50: Coastal fisheries of Argentina 37fi
- Page 51 and 52: Coastal fisheries of Argentina 39Ye
- Page 53 and 54: Coastal fisheries of Argentina 41us
- Page 55 and 56: Coastal fisheries of Argentina 43RE
- Page 57 and 58: Coastal fisheries of Argentina 45Fl
- Page 59 and 60: Coastal fisheries of Argentina 47Or
- Page 61 and 62: 493. Coastal fisheries of BarbadosP
- Page 63 and 64: Coastal fisheries of Barbados 51FIG
- Page 65 and 66:
Coastal fisheries of Barbados 53TAB
- Page 67 and 68:
Coastal fisheries of Barbados 55TAB
- Page 69 and 70:
Coastal fisheries of Barbados 57TAB
- Page 71 and 72:
Coastal fisheries of Barbados 59TAB
- Page 73 and 74:
Coastal fisheries of Barbados 61The
- Page 75 and 76:
Coastal fisheries of Barbados 63of
- Page 77 and 78:
Coastal fisheries of Barbados 654.2
- Page 79 and 80:
Coastal fisheries of Barbados 676.
- Page 81 and 82:
Coastal fisheries of Barbados 69not
- Page 83:
Coastal fisheries of Barbados 71ACK
- Page 86 and 87:
74Coastal fisheries of Latin Americ
- Page 88 and 89:
76Coastal fisheries of Latin Americ
- Page 90 and 91:
78Coastal fisheries of Latin Americ
- Page 92 and 93:
80Coastal fisheries of Latin Americ
- Page 94 and 95:
82Coastal fisheries of Latin Americ
- Page 96 and 97:
84Coastal fisheries of Latin Americ
- Page 98 and 99:
86Coastal fisheries of Latin Americ
- Page 100 and 101:
88Coastal fisheries of Latin Americ
- Page 102 and 103:
90Coastal fisheries of Latin Americ
- Page 104 and 105:
92Coastal fisheries of Latin Americ
- Page 106 and 107:
94Coastal fisheries of Latin Americ
- Page 108 and 109:
96Coastal fisheries of Latin Americ
- Page 110 and 111:
98Coastal fisheries of Latin Americ
- Page 112 and 113:
100Coastal fisheries of Latin Ameri
- Page 114 and 115:
102Coastal fisheries of Latin Ameri
- Page 116 and 117:
104Coastal fisheries of Latin Ameri
- Page 118 and 119:
106Coastal fisheries of Latin Ameri
- Page 120 and 121:
108Coastal fisheries of Latin Ameri
- Page 122 and 123:
110Coastal fisheries of Latin Ameri
- Page 124 and 125:
112Coastal fisheries of Latin Ameri
- Page 126 and 127:
114Coastal fisheries of Latin Ameri
- Page 128 and 129:
116Coastal fisheries of Latin Ameri
- Page 130 and 131:
118Coastal fisheries of Latin Ameri
- Page 132 and 133:
120Coastal fisheries of Latin Ameri
- Page 134 and 135:
122Coastal fisheries of Latin Ameri
- Page 136 and 137:
124Coastal fisheries of Latin Ameri
- Page 138 and 139:
126Coastal fisheries of Latin Ameri
- Page 140 and 141:
128Coastal fisheries of Latin Ameri
- Page 142 and 143:
130Coastal fisheries of Latin Ameri
- Page 144 and 145:
132Coastal fisheries of Latin Ameri
- Page 146 and 147:
134Coastal fisheries of Latin Ameri
- Page 148 and 149:
136Coastal fisheries of Latin Ameri
- Page 150 and 151:
138Coastal fisheries of Latin Ameri
- Page 152 and 153:
140Coastal fisheries of Latin Ameri
- Page 154 and 155:
142Coastal fisheries of Latin Ameri
- Page 156 and 157:
144Coastal fisheries of Latin Ameri
- Page 158 and 159:
146Coastal fisheries of Latin Ameri
- Page 160 and 161:
148Coastal fisheries of Latin Ameri
- Page 162 and 163:
150Coastal fisheries of Latin Ameri
- Page 164 and 165:
152Coastal fisheries of Latin Ameri
- Page 167 and 168:
1557. Coastal fisheries of CubaSERV
- Page 169 and 170:
Coastal fisheries of Cuba 157FIGURE
- Page 171 and 172:
Coastal fisheries of Cuba 159FIGURE
- Page 173 and 174:
Coastal fisheries of Cuba 1612.2 Fi
- Page 175 and 176:
Coastal fisheries of Cuba 163FIGURE
- Page 177 and 178:
Coastal fisheries of Cuba 165produc
- Page 179 and 180:
Coastal fisheries of Cuba 167Board
- Page 181 and 182:
Coastal fisheries of Cuba 169and co
- Page 183 and 184:
Coastal fisheries of Cuba 171Baisre
- Page 185 and 186:
Coastal fisheries of Cuba 173Garcí
- Page 187 and 188:
1758. Coastal fisheries of theDomin
- Page 189 and 190:
Coastal fisheries of the Dominican
- Page 191 and 192:
Coastal fisheries of the Dominican
- Page 193 and 194:
Coastal fisheries of the Dominican
- Page 195 and 196:
Coastal fisheries of the Dominican
- Page 197 and 198:
Coastal fisheries of the Dominican
- Page 199 and 200:
Coastal fisheries of the Dominican
- Page 201 and 202:
Coastal fisheries of the Dominican
- Page 203 and 204:
Coastal fisheries of the Dominican
- Page 205 and 206:
Coastal fisheries of the Dominican
- Page 207 and 208:
Coastal fisheries of the Dominican
- Page 209 and 210:
Coastal fisheries of the Dominican
- Page 211 and 212:
Coastal fisheries of the Dominican
- Page 213 and 214:
Coastal fisheries of the Dominican
- Page 215 and 216:
Coastal fisheries of the Dominican
- Page 217 and 218:
Coastal fisheries of the Dominican
- Page 219 and 220:
Coastal fisheries of the Dominican
- Page 221 and 222:
Coastal fisheries of the Dominican
- Page 223 and 224:
Coastal fisheries of the Dominican
- Page 225 and 226:
Coastal fisheries of the Dominican
- Page 227 and 228:
Coastal fisheries of the Dominican
- Page 229:
Coastal fisheries of the Dominican
- Page 232 and 233:
220Coastal fisheries of Latin Ameri
- Page 234 and 235:
222Coastal fisheries of Latin Ameri
- Page 236 and 237:
224Coastal fisheries of Latin Ameri
- Page 238 and 239:
226Coastal fisheries of Latin Ameri
- Page 240 and 241:
228Coastal fisheries of Latin Ameri
- Page 243 and 244:
23110. Coastal fisheries of MexicoJ
- Page 245 and 246:
Coastal fisheries of Mexico 233espe
- Page 247 and 248:
Coastal fisheries of Mexico 2352.1
- Page 249 and 250:
Coastal fisheries of Mexico 237ocel
- Page 251 and 252:
Coastal fisheries of Mexico 2392.4
- Page 253 and 254:
Coastal fisheries of Mexico 241Góm
- Page 255 and 256:
Coastal fisheries of Mexico 243INEG
- Page 257 and 258:
Coastal fisheries of Mexico 245to p
- Page 259 and 260:
Coastal fisheries of Mexico 2474.1
- Page 261 and 262:
Coastal fisheries of Mexico 249None
- Page 263 and 264:
Coastal fisheries of Mexico 251quot
- Page 265 and 266:
Coastal fisheries of Mexico 253Rece
- Page 267 and 268:
Coastal fisheries of Mexico 255(v)
- Page 269 and 270:
Coastal fisheries of Mexico 257TABL
- Page 271 and 272:
Coastal fisheries of Mexico 259is a
- Page 273 and 274:
Coastal fisheries of Mexico 261Arre
- Page 275 and 276:
Coastal fisheries of Mexico 263Belt
- Page 277 and 278:
Coastal fisheries of Mexico 265Defe
- Page 279 and 280:
Coastal fisheries of Mexico 267Hern
- Page 281 and 282:
Coastal fisheries of Mexico 269Ram
- Page 283 and 284:
Coastal fisheries of Mexico 271Seij
- Page 285 and 286:
Coastal fisheries of Mexico 273Zeti
- Page 287 and 288:
Coastal fisheries of Mexico 275APPE
- Page 289 and 290:
Coastal fisheries of Mexico 277APPE
- Page 291 and 292:
Coastal fisheries of Mexico 279APPE
- Page 293 and 294:
Coastal fisheries of Mexico 281APPE
- Page 295 and 296:
Coastal fisheries of Mexico 283APPE
- Page 297 and 298:
28511. Coastal fisheries of Puerto
- Page 299 and 300:
Coastal fisheries of Puerto Rico 28
- Page 301 and 302:
Coastal fisheries of Puerto Rico 28
- Page 303 and 304:
Coastal fisheries of Puerto Rico 29
- Page 305 and 306:
Coastal fisheries of Puerto Rico 29
- Page 307 and 308:
Coastal fisheries of Puerto Rico 29
- Page 309 and 310:
Coastal fisheries of Puerto Rico 29
- Page 311 and 312:
Coastal fisheries of Puerto Rico 29
- Page 313 and 314:
Coastal fisheries of Puerto Rico 30
- Page 315 and 316:
Coastal fisheries of Puerto Rico 30
- Page 317 and 318:
Coastal fisheries of Puerto Rico 30
- Page 319 and 320:
Coastal fisheries of Puerto Rico 30
- Page 321 and 322:
Coastal fisheries of Puerto Rico 30
- Page 323 and 324:
Coastal fisheries of Puerto Rico 31
- Page 325:
Coastal fisheries of Puerto Rico 31
- Page 328 and 329:
316Coastal fisheries of Latin Ameri
- Page 330 and 331:
318Coastal fisheries of Latin Ameri
- Page 332 and 333:
320Coastal fisheries of Latin Ameri
- Page 334 and 335:
322Coastal fisheries of Latin Ameri
- Page 336 and 337:
324Coastal fisheries of Latin Ameri
- Page 338 and 339:
326Coastal fisheries of Latin Ameri
- Page 340 and 341:
328Coastal fisheries of Latin Ameri
- Page 342 and 343:
330Coastal fisheries of Latin Ameri
- Page 344 and 345:
332Coastal fisheries of Latin Ameri
- Page 346 and 347:
334Coastal fisheries of Latin Ameri
- Page 348 and 349:
336Coastal fisheries of Latin Ameri
- Page 350 and 351:
338Coastal fisheries of Latin Ameri
- Page 352 and 353:
340Coastal fisheries of Latin Ameri
- Page 354 and 355:
342Coastal fisheries of Latin Ameri
- Page 356 and 357:
344Coastal fisheries of Latin Ameri
- Page 358 and 359:
346Coastal fisheries of Latin Ameri
- Page 360 and 361:
348Coastal fisheries of Latin Ameri
- Page 362 and 363:
350Coastal fisheries of Latin Ameri
- Page 364 and 365:
352Coastal fisheries of Latin Ameri
- Page 366 and 367:
354Coastal fisheries of Latin Ameri
- Page 368 and 369:
356Coastal fisheries of Latin Ameri
- Page 370 and 371:
358Coastal fisheries of Latin Ameri
- Page 372 and 373:
360Coastal fisheries of Latin Ameri
- Page 374 and 375:
362Coastal fisheries of Latin Ameri
- Page 376 and 377:
364Coastal fisheries of Latin Ameri
- Page 378 and 379:
366Coastal fisheries of Latin Ameri
- Page 380 and 381:
368Coastal fisheries of Latin Ameri
- Page 382 and 383:
370Coastal fisheries of Latin Ameri
- Page 384 and 385:
372Coastal fisheries of Latin Ameri
- Page 386 and 387:
374Coastal fisheries of Latin Ameri
- Page 388 and 389:
376Coastal fisheries of Latin Ameri
- Page 390 and 391:
378Coastal fisheries of Latin Ameri
- Page 392 and 393:
380Coastal fisheries of Latin Ameri
- Page 394 and 395:
382Coastal fisheries of Latin Ameri
- Page 396 and 397:
384Coastal fisheries of Latin Ameri
- Page 398 and 399:
386Coastal fisheries of Latin Ameri
- Page 400 and 401:
388Coastal fisheries of Latin Ameri
- Page 402 and 403:
390Coastal fisheries of Latin Ameri
- Page 404 and 405:
392Coastal fisheries of Latin Ameri
- Page 406 and 407:
394Coastal fisheries of Latin Ameri
- Page 408 and 409:
396Coastal fisheries of Latin Ameri
- Page 410 and 411:
398Coastal fisheries of Latin Ameri
- Page 412 and 413:
400Coastal fisheries of Latin Ameri
- Page 415 and 416:
40315. Toward sustainability forcoa
- Page 417 and 418:
Toward sustainability for coastal f
- Page 419 and 420:
Toward sustainability for coastal f
- Page 421 and 422:
Toward sustainability for coastal f
- Page 423 and 424:
Toward sustainability for coastal f
- Page 425 and 426:
Toward sustainability for coastal f
- Page 427 and 428:
Toward sustainability for coastal f
- Page 429 and 430:
Toward sustainability for coastal f
- Page 431 and 432:
Toward sustainability for coastal f
- Page 433:
Toward sustainability for coastal f
- Page 436 and 437:
424Coastal fisheries of Latin Ameri
- Page 438 and 439:
426Coastal fisheries of Latin Ameri
- Page 440 and 441:
428Coastal fisheries of Latin Ameri
- Page 442:
430Coastal fisheries of Latin Ameri


