Utopia or dystopia? Well-being in the Nordic welfare states
Utopia or dystopia? Well-being in the Nordic welfare states
Utopia or dystopia? Well-being in the Nordic welfare states

You also want an ePaper? Increase the reach of your titles
YUMPU automatically turns print PDFs into web optimized ePapers that Google loves.
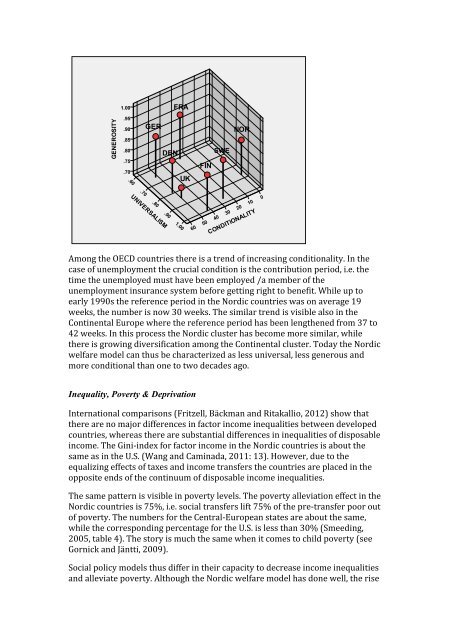
Among <strong>the</strong> OECD countries <strong>the</strong>re is a trend of <strong>in</strong>creas<strong>in</strong>g conditionality. In <strong>the</strong>case of unemployment <strong>the</strong> crucial condition is <strong>the</strong> contribution period, i.e. <strong>the</strong>time <strong>the</strong> unemployed must have been employed /a member of <strong>the</strong>unemployment <strong>in</strong>surance system bef<strong>or</strong>e gett<strong>in</strong>g right to benefit. While up toearly 1990s <strong>the</strong> reference period <strong>in</strong> <strong>the</strong> N<strong>or</strong>dic countries was on average 19weeks, <strong>the</strong> number is now 30 weeks. The similar trend is visible also <strong>in</strong> <strong>the</strong>Cont<strong>in</strong>ental Europe where <strong>the</strong> reference period has been leng<strong>the</strong>ned from 37 to42 weeks. In this process <strong>the</strong> N<strong>or</strong>dic cluster has become m<strong>or</strong>e similar, while<strong>the</strong>re is grow<strong>in</strong>g diversification among <strong>the</strong> Cont<strong>in</strong>ental cluster. Today <strong>the</strong> N<strong>or</strong>dic<strong>welfare</strong> model can thus be characterized as less universal, less generous andm<strong>or</strong>e conditional than one to two decades ago.Inequality, Poverty & DeprivationInternational comparisons (Fritzell, Bäckman and Ritakallio, 2012) show that<strong>the</strong>re are no maj<strong>or</strong> differences <strong>in</strong> fact<strong>or</strong> <strong>in</strong>come <strong>in</strong>equalities between developedcountries, whereas <strong>the</strong>re are substantial differences <strong>in</strong> <strong>in</strong>equalities of disposable<strong>in</strong>come. The G<strong>in</strong>i‐<strong>in</strong>dex f<strong>or</strong> fact<strong>or</strong> <strong>in</strong>come <strong>in</strong> <strong>the</strong> N<strong>or</strong>dic countries is about <strong>the</strong>same as <strong>in</strong> <strong>the</strong> U.S. (Wang and Cam<strong>in</strong>ada, 2011: 13). However, due to <strong>the</strong>equaliz<strong>in</strong>g effects of taxes and <strong>in</strong>come transfers <strong>the</strong> countries are placed <strong>in</strong> <strong>the</strong>opposite ends of <strong>the</strong> cont<strong>in</strong>uum of disposable <strong>in</strong>come <strong>in</strong>equalities.The same pattern is visible <strong>in</strong> poverty levels. The poverty alleviation effect <strong>in</strong> <strong>the</strong>N<strong>or</strong>dic countries is 75%, i.e. social transfers lift 75% of <strong>the</strong> pre‐transfer po<strong>or</strong> outof poverty. The numbers f<strong>or</strong> <strong>the</strong> Central‐European <strong>states</strong> are about <strong>the</strong> same,while <strong>the</strong> c<strong>or</strong>respond<strong>in</strong>g percentage f<strong>or</strong> <strong>the</strong> U.S. is less than 30% (Smeed<strong>in</strong>g,2005, table 4). The st<strong>or</strong>y is much <strong>the</strong> same when it comes to child poverty (seeG<strong>or</strong>nick and Jäntti, 2009).Social policy models thus differ <strong>in</strong> <strong>the</strong>ir capacity to decrease <strong>in</strong>come <strong>in</strong>equalitiesand alleviate poverty. Although <strong>the</strong> N<strong>or</strong>dic <strong>welfare</strong> model has done well, <strong>the</strong> rise
![Kompensim asistence [Assistansersättning] - Försäkringskassan](https://img.yumpu.com/51668997/1/184x260/kompensim-asistence-assistansersattning-forsakringskassan.jpg?quality=85)

![Underhållsstöd, nettoberäkning [pdf 151 kB] - Försäkringskassan](https://img.yumpu.com/50630843/1/184x260/underhaallsstaad-nettoberaakning-pdf-151-kb-faarsaakringskassan.jpg?quality=85)

![Indemnité journalière de maladie [Sjukpenning] - Försäkringskassan](https://img.yumpu.com/49876884/1/184x260/indemnitaac-journaliaare-de-maladie-sjukpenning-faarsaakringskassan.jpg?quality=85)