
You also want an ePaper? Increase the reach of your titles
YUMPU automatically turns print PDFs into web optimized ePapers that Google loves.
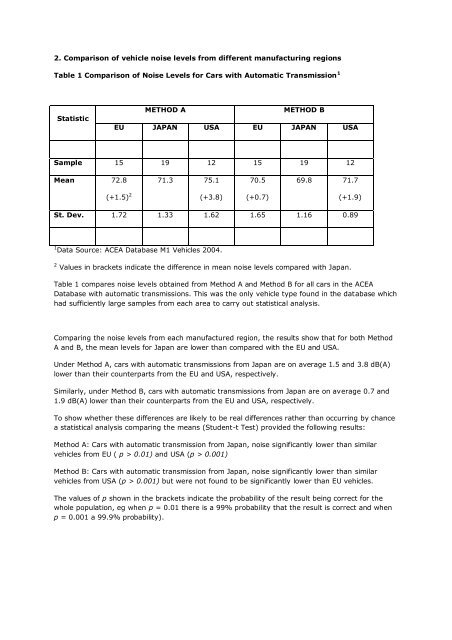
2. Comparison of vehicle noise levels from different manufacturing regionsTable 1 Comparison of Noise Levels for Cars with Automatic Transmission 1StatisticMETHOD AMETHOD BEU JAPAN USA EU JAPAN USASample 15 19 12 15 19 12Mean 72.8(+1.5) 2 71.3 75.1(+3.8)70.5(+0.7)69.8 71.7(+1.9)St. Dev. 1.72 1.33 1.62 1.65 1.16 0.891 Data Source: ACEA Database M1 Vehicles 2004.2 Values in brackets indicate the difference in mean noise levels compared with Japan.Table 1 compares noise levels obtained from Method A and Method B for all cars in the ACEADatabase with automatic transmissions. This was the only vehicle type found in the database whichhad sufficiently large samples from each area to carry out statistical analysis.Comparing the noise levels from each manufactured region, the results show that for both MethodA and B, the mean levels for Japan are lower than compared with the EU and USA.Under Method A, cars with automatic transmissions from Japan are on average 1.5 and 3.8 dB(A)lower than their counterparts from the EU and USA, respectively.Similarly, under Method B, cars with automatic transmissions from Japan are on average 0.7 and1.9 dB(A) lower than their counterparts from the EU and USA, respectively.To show whether these differences are likely to be real differences rather than occurring by chancea statistical analysis comparing the means (Student-t Test) provided the following results:Method A: Cars with automatic transmission from Japan, noise significantly lower than similarvehicles from EU ( p > 0.01) and USA (p > 0.001)Method B: Cars with automatic transmission from Japan, noise significantly lower than similarvehicles from USA (p > 0.001) but were not found to be significantly lower than EU vehicles.The values of p shown in the brackets indicate the probability of the result being correct for thewhole population, eg when p = 0.01 there is a 99% probability that the result is correct and whenp = 0.001 a 99.9% probability).