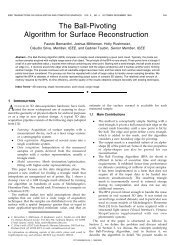
(a) Original isosurface. (b) Importance map. (c) <strong>Warping</strong> function.(d) Warped volume. (e) Extracted warped isosurface. (f) unwarped isosurface.Figure 2: <strong>Volume</strong> warping pipeline. In this example an importance map is given by the user. The map assigns maximum importance to thejaws of the Skull model. Consequently this region is agressively inflated in the warped volume. The resulting isosurface is densely tessellatedaround the jaws and coarse elsewhere. A close-up of the output mesh is shown in Figure 3.volume, areas designated as important by the map are inflated tothe expense of less important ones. Consider the example of Figure1: The model on the left handside is extracted from an unoptimizedvolume, i.e. the volume has not been warped. The close viewillustrates the uni<strong>for</strong>mity of the tessellation. The central modelis extracted from the warped volume. Importance is given to thebranches and small fluctuations along the model’s surface. Hencethese regions are inflated consequently.Once a mesh is extracted from the warped volume, the vertexlocations are unwarped in order to locally rescale the isosurfaceto its original proportions. The rescaled isosurface looks identicalto the one extracted without warping the volume, with the differencethat the sampling of the mesh is finer in areas regardedas important. The model on the right handside of Figure 1 is theunwarp version of the central model. The close-up view showsthe adaptive tessellation as a result of the warping operation. Theextraction algorithm is applied to a smaller (warped) version of theinput volume in order to get a total vertex count identical to theone obtained with the extraction from an unoptimized volume. Ourmethod is there<strong>for</strong>e more economic in computational and storagerequirements with the benefit of producing an adaptively sampledisosurface. Obviously our method requires to previously warp theinput volume; <strong>for</strong> this task we use an efficient multigrid approachallowing the operation to be per<strong>for</strong>med efficiently.Our method has several advantages: For example, our algorithmdoes not require the use of any complex data structures, such asoctrees and is relatively simple to implement. Furthermore, ourmethod allows the user to control the importance map such thatthe extraction is best suited to the goal of the visualization. Theimportance map can be computed automatically by analyzingthe content of the volume, but can also be fully specified by theuser. Our method relies on the fact that a warped volume can beresized (i.e. downsampled) up to a certain extend without loss ofdetails. A rapid analogy in signal processing is the downsamplingof a discrete signal without aliasing. This is possible only if nofrequency component (in the underlying continuous function) ishigher than half the resampling frequency (Shannon’s SamplingTheorem). There<strong>for</strong>e a warped volume can be downsized withoutloss in details up to a critical size. Obviously this size dependsdirectly on the characteristics of the dataset, i.e. on the amount ofhigh-frequency details.As said previously, our method does not require the use of a specificextraction algorithm. Hence our method can be used jointlywith the latest extraction techniques. Finally, our algorithm producesisosurfaces that are adapted to the volume structure and theuser’s specifications and does not suffer from any mesh discontinuitiesor gap-filling problems that typically require additionnal pro-
cessing [11].2 Previous workMany researchers have sought to extend common isosurfaceextraction methods, such as Marching Cubes [6], to produce adaptivelytessellated isosurfaces (see <strong>for</strong> example [?].) A prevalentidea, as is presented by Saupe [10], <strong>for</strong> the solution to this problemrequires the use of algorithms and data structures that are oftenvery specific to certain visualization scenarios and typically requirelarge amounts of additional storage. Commonly, structures such asoctrees [14, 12] and interval trees [3] have been applied to addressthis problem. Furthermore, to facilitate the transition from finelysampled regions to coarser ones, multiresolution hierarchies areused [8, 7]. These techniques provide results of quality howevertheir costs in storage can be a limitation.Several techniques have been implemented that also providefeature-driven extraction [15, 5] as our method. These techniquesdo not give to the user the flexibility in determining which areasto refine without the use of a multiresolution hierarchy. One approachto address this problem has been to use compressed volumes[12, 13] or the extracted isosurface itself [9]. However, onceagain, these techniques require the use of intensive calculations andcomplex data structures.3 ApproachOur method has four stages represented in the example of Figures2a-f. Given an input volume (the isolevel to be extracted isrepresented in Figure 2a), an importance map is first specified<strong>for</strong> the isolevel, as suggested in Figure 2b. The map is given asa volume dataset (not having necessarily the same size as theinput dataset). However in the examples of this paper, we givean intuitive representation of a map as a painted isosurface. Thedarker the shade of isosurface region the more important the areain the volume. The map can be given by the user, as in Figure 2b,or computed automatically (e.g. as in Figure 4, see next section.)In the map of Figure 2b we assign the highest importance to thejaws of the skull model.A warping function is computed using the map and a relaxationalgorithm. The function is modeled using a tridimensional regulargrid of user-defined resolution, as suggested in Figure 2c. The inputvolume is then resampled using the warping function, leading to awarped volume (Figure 2d). Finally, a mesh is extracted from thewarped volume (Figure 2e) and the vertex locations are unwarpedusing again the warping function depicted in Figure 2c. In the resultingadaptive isosurface represented in Figure 2f, the mesh isdenser in important areas. In Figure 3 we illustrate the dramaticincrease in mesh density in the jaws.3.1 Feature-sensitive importance mapA powerful component of our pipeline is the importance map.The values in the map define a measure of importance <strong>for</strong> eachcorresponding voxel (or group of voxel) location. Importancemaps <strong>for</strong> volume visualization have previously been investigated,<strong>for</strong> example, by Bajaj etal in [1]. This map is used to compute thewarping function (e.g. as in Figure 2c) which, in turn, is used toresample the volume (e.g. as in Figure 2d.) The importance mapcan be explicitly defined by the user as it is in Figure 2b. In thisexample, the jaws has been designated as important. Alternatively,a common goal is create adaptive isosurfaces that preserve areasof significant detail across the entire volume. To do so we proposeside view of skullFigure 3: Close-up view of the adaptive tessellation of the jaws(example model in the volume warping pipeline depicted in Figures2a-f.)a method to compute an importance map based on the number ofcrossings <strong>for</strong> the given isolevel in an user-defined neighborhood<strong>for</strong> each voxel. We call the map neighborhood-crossing map.We explain the algorithm to compute the map in more detailbelow. For each voxel we search <strong>for</strong> intensity values within auser-defined range of the isolevel. If such a crossing is found,then each voxel in a neighborhood surrounding the voxel is thenchecked <strong>for</strong> an isolevel crossing. Each time an isolevel crossing isfound, a counter is incremented. The resulting number of crossingsis stored <strong>for</strong> each voxel in the importance map. The isolevel, itsrange, and the size of the neighborhood kernel are specified by theuser.In Figure 4 we give a representation of the neighborhoodcrossingmap obtained <strong>for</strong> the Bonsai tree dataset. The isosurfaceextracted from the volume warped using the importance map aboveis shown in Figure 1. More examples of neighborhood-crossingmaps can be seen in Figures 8 and 9.3.2 <strong>Volume</strong> warpingWe describe now the volume warping operation more <strong>for</strong>mally.We start with a scalar function É Ê defined on theunit cube É. Our goal is to generate an adaptive polygon-meshapproximation of the level set Ë Ô ´Ôµ Ä, where Äis the isolevel of interest. We first compute a warping functionÛ É É (we actually estimate Û ½ , see Figure 5). Then,we generate a uni<strong>for</strong>m polygon-mesh approximation Å ¼ of theisolevel Ë ¼ Ô ¼ ¼´Ô ¼ µÄ, where ¼ Æ .The continous function is represented as a regularly sampledvolume dataset « ¼ « Æ ¼ ½ ¾, andincorporates trilinear interpolation to achieve continuity. Theuni<strong>for</strong>m polygon mesh Å ¼ is computed as an isosurface extractedfrom the warped scalar function ¼ , which, <strong>for</strong> this purpose, mustalso be represented as a regularly sampled dataset ¼ . To generate ¼ , we use the 3D equivalent of inverse texture mapping. Weevaluate the inverse warping function at the coordinates of the