Volume Warping for Adaptive Isosurface Extraction - ResearchGate
Volume Warping for Adaptive Isosurface Extraction - ResearchGate
Volume Warping for Adaptive Isosurface Extraction - ResearchGate

Create successful ePaper yourself
Turn your PDF publications into a flip-book with our unique Google optimized e-Paper software.
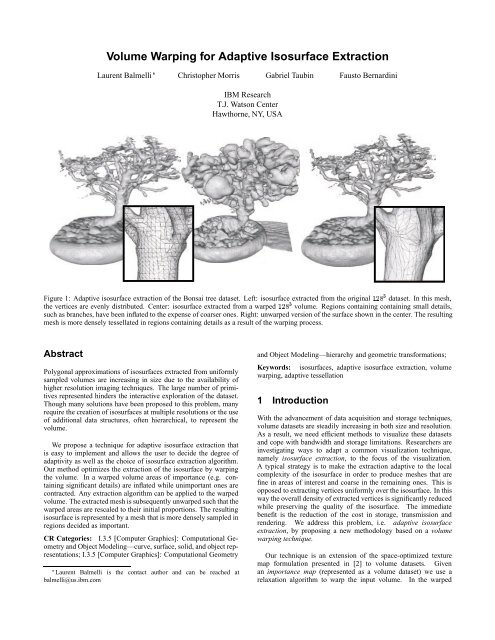
<strong>Volume</strong> <strong>Warping</strong> <strong>for</strong> <strong>Adaptive</strong> <strong>Isosurface</strong> <strong>Extraction</strong>Laurent Balmelli £ Christopher Morris Gabriel Taubin Fausto BernardiniIBM ResearchT.J. Watson CenterHawthorne, NY, USAFigure 1: <strong>Adaptive</strong> isosurface extraction of the Bonsai tree dataset. Left: isosurface extracted from the original ½¾ ¿ dataset. In this mesh,the vertices are evenly distributed. Center: isosurface extracted from a warped ½¾ ¿ volume. Regions containing containing small details,such as branches, have been inflated to the expense of coarser ones. Right: unwarped version of the surface shown in the center. The resultingmesh is more densely tessellated in regions containing details as a result of the warping process.AbstractPolygonal approximations of isosurfaces extracted from uni<strong>for</strong>mlysampled volumes are increasing in size due to the availability ofhigher resolution imaging techniques. The large number of primitivesrepresented hinders the interactive exploration of the dataset.Though many solutions have been proposed to this problem, manyrequire the creation of isosurfaces at multiple resolutions or the useof additional data structures, often hierarchical, to represent thevolume.We propose a technique <strong>for</strong> adaptive isosurface extraction thatis easy to implement and allows the user to decide the degree ofadaptivity as well as the choice of isosurface extraction algorithm.Our method optimizes the extraction of the isosurface by warpingthe volume. In a warped volume areas of importance (e.g. containingsignificant details) are inflated while unimportant ones arecontracted. Any extraction algorithm can be applied to the warpedvolume. The extracted mesh is subsequently unwarped such that thewarped areas are rescaled to their initial proportions. The resultingisosurface is represented by a mesh that is more densely sampled inregions decided as important.CR Categories: I.3.5 [Computer Graphics]: Computational Geometryand Object Modeling—curve, surface, solid, and object representations;I.3.5 [Computer Graphics]: Computational Geometry£ Laurent Balmelli is the contact author and can be reached atbalmelli@us.ibm.comand Object Modeling—hierarchy and geometric trans<strong>for</strong>mations;Keywords: isosurfaces, adaptive isosurface extraction, volumewarping, adaptive tessellation1 IntroductionWith the advancement of data acquisition and storage techniques,volume datasets are steadily increasing in both size and resolution.As a result, we need efficient methods to visualize these datasetsand cope with bandwidth and storage limitations. Researchers areinvestigating ways to adapt a common visualization technique,namely isosurface extraction, to the focus of the visualization.A typical strategy is to make the extraction adaptive to the localcomplexity of the isosurface in order to produce meshes that arefine in areas of interest and coarse in the remaining ones. This isopposed to extracting vertices uni<strong>for</strong>mly over the isosurface. In thisway the overall density of extracted vertices is significantly reducedwhile preserving the quality of the isosurface. The immediatebenefit is the reduction of the cost in storage, transmission andrendering. We address this problem, i.e. adaptive isosurfaceextraction, by proposing a new methodology based on a volumewarping technique.Our technique is an extension of the space-optimized texturemap <strong>for</strong>mulation presented in [2] to volume datasets. Givenan importance map (represented as a volume dataset) we use arelaxation algorithm to warp the input volume. In the warped
(a) Original isosurface. (b) Importance map. (c) <strong>Warping</strong> function.(d) Warped volume. (e) Extracted warped isosurface. (f) unwarped isosurface.Figure 2: <strong>Volume</strong> warping pipeline. In this example an importance map is given by the user. The map assigns maximum importance to thejaws of the Skull model. Consequently this region is agressively inflated in the warped volume. The resulting isosurface is densely tessellatedaround the jaws and coarse elsewhere. A close-up of the output mesh is shown in Figure 3.volume, areas designated as important by the map are inflated tothe expense of less important ones. Consider the example of Figure1: The model on the left handside is extracted from an unoptimizedvolume, i.e. the volume has not been warped. The close viewillustrates the uni<strong>for</strong>mity of the tessellation. The central modelis extracted from the warped volume. Importance is given to thebranches and small fluctuations along the model’s surface. Hencethese regions are inflated consequently.Once a mesh is extracted from the warped volume, the vertexlocations are unwarped in order to locally rescale the isosurfaceto its original proportions. The rescaled isosurface looks identicalto the one extracted without warping the volume, with the differencethat the sampling of the mesh is finer in areas regardedas important. The model on the right handside of Figure 1 is theunwarp version of the central model. The close-up view showsthe adaptive tessellation as a result of the warping operation. Theextraction algorithm is applied to a smaller (warped) version of theinput volume in order to get a total vertex count identical to theone obtained with the extraction from an unoptimized volume. Ourmethod is there<strong>for</strong>e more economic in computational and storagerequirements with the benefit of producing an adaptively sampledisosurface. Obviously our method requires to previously warp theinput volume; <strong>for</strong> this task we use an efficient multigrid approachallowing the operation to be per<strong>for</strong>med efficiently.Our method has several advantages: For example, our algorithmdoes not require the use of any complex data structures, such asoctrees and is relatively simple to implement. Furthermore, ourmethod allows the user to control the importance map such thatthe extraction is best suited to the goal of the visualization. Theimportance map can be computed automatically by analyzingthe content of the volume, but can also be fully specified by theuser. Our method relies on the fact that a warped volume can beresized (i.e. downsampled) up to a certain extend without loss ofdetails. A rapid analogy in signal processing is the downsamplingof a discrete signal without aliasing. This is possible only if nofrequency component (in the underlying continuous function) ishigher than half the resampling frequency (Shannon’s SamplingTheorem). There<strong>for</strong>e a warped volume can be downsized withoutloss in details up to a critical size. Obviously this size dependsdirectly on the characteristics of the dataset, i.e. on the amount ofhigh-frequency details.As said previously, our method does not require the use of a specificextraction algorithm. Hence our method can be used jointlywith the latest extraction techniques. Finally, our algorithm producesisosurfaces that are adapted to the volume structure and theuser’s specifications and does not suffer from any mesh discontinuitiesor gap-filling problems that typically require additionnal pro-
cessing [11].2 Previous workMany researchers have sought to extend common isosurfaceextraction methods, such as Marching Cubes [6], to produce adaptivelytessellated isosurfaces (see <strong>for</strong> example [?].) A prevalentidea, as is presented by Saupe [10], <strong>for</strong> the solution to this problemrequires the use of algorithms and data structures that are oftenvery specific to certain visualization scenarios and typically requirelarge amounts of additional storage. Commonly, structures such asoctrees [14, 12] and interval trees [3] have been applied to addressthis problem. Furthermore, to facilitate the transition from finelysampled regions to coarser ones, multiresolution hierarchies areused [8, 7]. These techniques provide results of quality howevertheir costs in storage can be a limitation.Several techniques have been implemented that also providefeature-driven extraction [15, 5] as our method. These techniquesdo not give to the user the flexibility in determining which areasto refine without the use of a multiresolution hierarchy. One approachto address this problem has been to use compressed volumes[12, 13] or the extracted isosurface itself [9]. However, onceagain, these techniques require the use of intensive calculations andcomplex data structures.3 ApproachOur method has four stages represented in the example of Figures2a-f. Given an input volume (the isolevel to be extracted isrepresented in Figure 2a), an importance map is first specified<strong>for</strong> the isolevel, as suggested in Figure 2b. The map is given asa volume dataset (not having necessarily the same size as theinput dataset). However in the examples of this paper, we givean intuitive representation of a map as a painted isosurface. Thedarker the shade of isosurface region the more important the areain the volume. The map can be given by the user, as in Figure 2b,or computed automatically (e.g. as in Figure 4, see next section.)In the map of Figure 2b we assign the highest importance to thejaws of the skull model.A warping function is computed using the map and a relaxationalgorithm. The function is modeled using a tridimensional regulargrid of user-defined resolution, as suggested in Figure 2c. The inputvolume is then resampled using the warping function, leading to awarped volume (Figure 2d). Finally, a mesh is extracted from thewarped volume (Figure 2e) and the vertex locations are unwarpedusing again the warping function depicted in Figure 2c. In the resultingadaptive isosurface represented in Figure 2f, the mesh isdenser in important areas. In Figure 3 we illustrate the dramaticincrease in mesh density in the jaws.3.1 Feature-sensitive importance mapA powerful component of our pipeline is the importance map.The values in the map define a measure of importance <strong>for</strong> eachcorresponding voxel (or group of voxel) location. Importancemaps <strong>for</strong> volume visualization have previously been investigated,<strong>for</strong> example, by Bajaj etal in [1]. This map is used to compute thewarping function (e.g. as in Figure 2c) which, in turn, is used toresample the volume (e.g. as in Figure 2d.) The importance mapcan be explicitly defined by the user as it is in Figure 2b. In thisexample, the jaws has been designated as important. Alternatively,a common goal is create adaptive isosurfaces that preserve areasof significant detail across the entire volume. To do so we proposeside view of skullFigure 3: Close-up view of the adaptive tessellation of the jaws(example model in the volume warping pipeline depicted in Figures2a-f.)a method to compute an importance map based on the number ofcrossings <strong>for</strong> the given isolevel in an user-defined neighborhood<strong>for</strong> each voxel. We call the map neighborhood-crossing map.We explain the algorithm to compute the map in more detailbelow. For each voxel we search <strong>for</strong> intensity values within auser-defined range of the isolevel. If such a crossing is found,then each voxel in a neighborhood surrounding the voxel is thenchecked <strong>for</strong> an isolevel crossing. Each time an isolevel crossing isfound, a counter is incremented. The resulting number of crossingsis stored <strong>for</strong> each voxel in the importance map. The isolevel, itsrange, and the size of the neighborhood kernel are specified by theuser.In Figure 4 we give a representation of the neighborhoodcrossingmap obtained <strong>for</strong> the Bonsai tree dataset. The isosurfaceextracted from the volume warped using the importance map aboveis shown in Figure 1. More examples of neighborhood-crossingmaps can be seen in Figures 8 and 9.3.2 <strong>Volume</strong> warpingWe describe now the volume warping operation more <strong>for</strong>mally.We start with a scalar function É Ê defined on theunit cube É. Our goal is to generate an adaptive polygon-meshapproximation of the level set Ë Ô ´Ôµ Ä, where Äis the isolevel of interest. We first compute a warping functionÛ É É (we actually estimate Û ½ , see Figure 5). Then,we generate a uni<strong>for</strong>m polygon-mesh approximation Å ¼ of theisolevel Ë ¼ Ô ¼ ¼´Ô ¼ µÄ, where ¼ Æ .The continous function is represented as a regularly sampledvolume dataset « ¼ « Æ ¼ ½ ¾, andincorporates trilinear interpolation to achieve continuity. Theuni<strong>for</strong>m polygon mesh Å ¼ is computed as an isosurface extractedfrom the warped scalar function ¼ , which, <strong>for</strong> this purpose, mustalso be represented as a regularly sampled dataset ¼ . To generate ¼ , we use the 3D equivalent of inverse texture mapping. Weevaluate the inverse warping function at the coordinates of the
3.3 RelaxationAs explained in the previous section, the warping function isrepresentated using two associated grids and ¼ . The functionis computed using an extension of the relaxation algorithmdescribed in [2] to tridimensional grids. We briefly describe therelaxation process below and refer the reader to [2] <strong>for</strong> more details.Figure 4: Importance map <strong>for</strong> the Bonsai tree dataset. The map isrepresented as a painted isosurface. The darker the shade of isosurfaceregion the more important the area in the volume.G✔✬G'Figure 5: <strong>Warping</strong> and inverse warping .centroid Ô ¼ « of each voxel in ¼ to obtain a point Ô « in the domainof , and set the value ¼ « of the voxel equal to the result ´Ô «µof evaluating the original scalar function the computed point Ô «.Note that this procedure does not require the warped data set ¼ tobe of the same size as the input dataset . The sampling rate canbe changed (increased or decreased) during the inverse mappingstep.The warping function is represented by two associated grids, denotedby and ¼ (Figure 5), with the same connectivity, andagain, trilinear interpolation <strong>for</strong> continuity. A more complex interpolationscheme can be used, but we found trilinear interpolationto be good enough <strong>for</strong> our experiments <strong>for</strong> both the volume dataand the warping function A regular grid ¼ covers the dataset ¼ ,and the (inverse) warped grid covers the dataset . To evaluatethe inverse warping function at a point Ô ¼ ¾ É, we first needto determine which cell ¼ the point belongs, then compute trilinearcoordinates of the point with respect to the eight vertices of thecontaining cell on ¼ , and finally evaluate the trilinear coordinatesat the eight vertices of the corresponding cell on . Since thegrid covering ¼ is regular, determining which cell Ô ¼ belongs tois simply done by quantization. Evaluating the <strong>for</strong>ward warpingfunction is more expensive because, since the grid is not regular,determining which cell a point Ô ¾ É belongs to requires a spatialsearch. However, this is irrelevant because our approach does notrequire to evaluate the <strong>for</strong>ward warping function at all.Figure 7: .Initially, the vertices in the grid are initialized to a uni<strong>for</strong>m cubein the unit volume. At each step of the relaxation, a displacementvector is computed <strong>for</strong> each vertex. These vectors are evaluated bysampling the intensity of the importance map at each vertex locationin the volume. Note that since the importance map does nothave necessarily the same size as the original volume, trilinear interpolationis used to retrieve the intensity. A weight is evaluated<strong>for</strong> each pair of neighbor vertices 1 using their sampled intensity. Aweight will be large <strong>for</strong> a vertex sampling a high activity region.As a result, vertices in low activity regions are pulled by the onessampling high activity regions (e.g. as suggested in Figure 7.)To improve convergence accuracy and speed, we use a multigridapproach. Initially, the warping function is modeled with a coarsegrid, e.g. a ¿ ¢ ¿ ¢ ¿ grid (see the left handside of Figure 7.) Whenthe relaxation converges <strong>for</strong> the current grid resolution, the gridis subdivided using linear interpolation (right handside of Figure7.) Then, the process is reiterated until convergence and againthe grid is subdivided, etc. In order to ensure that the warpingfunction spans the whole volume during the relaxation process,constraints are applied to vertices lying on faces and at corners.Corner vertices are not allowed to move, whereas face verticescan only move within their face. In Figure 7 only the internal gridvertices are represented using a sphere <strong>for</strong> clarity.3.4 <strong>Isosurface</strong> extractionOnce the volume is warped, any isosurface extraction algorithm canbe used to generate the corresponding mesh. This flexibility is alloweddue to the fact that areas of interest have already been expandedwithin the warped volume in contrast to the remaining areasof lesser interest which have been contracted. Subsequently, any extractionalgorithm will define these regions appropriately. Our volumewarping and extraction pipeline is implemented in OpenDx 2 .In this environment the Alligator extraction algorithm [4] is implemented(a modification of the Marching Cubes algorithm [6]). InFigure 10 we show the result obtained using a standard implementationof the Marching Cubes algorithm. The isosurface is extractedfrom a ½¾ ¿ volume dataset warped using the importance map de-1 We consider only the neighbors in the six cardinal directions.2 www.opendx.org
Figure 6: <strong>Extraction</strong> from downsampled datasets. First row: extraction from optimized volume. Second row: extraction from warped volume.The volumes are warped using the importance map shown in Figure 8. The volume dimensions are, from left to right, ½¾ ¿ , ¿ , ¿ and¿¾ ¿ , respectively.picted in Figure 8. The same isosurface obtained using the Alligatoralgorithm [4] is shown in the second row of Figure 8 (left handside.)the mesh, i.e. Å, the vertex location must be unwarped. Sincethe vertices of the warped mesh lie on edges of the grid ¼ , thefinal location of each vertex is computed using the same warpingfunction used to warp the volume, i.e.Å ´Å ¼ µ (1)The output polygon mesh Å has the same connectivity as Å ¼ .4 ResultsWe tested our volume warping with common volume datasets.These datasets have size ½¾ ¿ and are freely available on theInternet 3 .Figure 10: Unwarped isosurface obtained when using a standardimplementation of the Marching Cubes algorithms [6]. The isosurfaceis extracted from a ½¾ ¿ volume dataset warped using theimportance map depicted in Figure 8. The same isosurface obtainedusing the Alligator algorithm [4] is shown in the second row of Figure8 (left handside.)3.5 Unwarping of the extracted isosurfaceThe vertices Å ¼ of the extracted isosurface are recovered from thewarped volume ¼ . In order to obtain the original proportion ofIn Figures 8 and 9 we show experimental results. In bothfigures, the importance map used to warp the volume is shownin the central frame. In the first rows, we show the volumesextracted from the unoptimized and warped dataset, respectively.Both datasets (Skull and Foot) have size ½¾ ¿ . In both figures,the model at the second row, right handside has a number ofvertices close to the one obtained using the unoptimized ½¾ ¿volume. For the Skull model, this is obtained with a warped ½¼¿ ¿volume, whereas <strong>for</strong> the Foot model this is obtained <strong>for</strong> a warped½½ volume. For the latter dataset, we observed that the numberof vertices obtained from the extraction decreases very quicklywhen downsampling the volume. We suggest that this behavior isdue to an important amount of noise in the dataset <strong>for</strong> the chosenisolevel. The isosurface extracted from the warped ½¼¿ ¿ volume(second row, right handside in Figure 9) is smooth compared to theone obtained <strong>for</strong> the unoptimized volume, while conserving most3 www.gris.uni-tuebingen.de/areas/scivis/volren/datasets/datasets.html
of the significant details. Finally, we show examples of adaptivetessellations in the third row of both figures.We give in the table below the number of extracted vertices obtainedwith our implementation <strong>for</strong> different volume dimensions.We use isolevels 42, 35, 50 <strong>for</strong> the Bonsai, Skull and Foot dataset,respectively (the volumes are encoded using two bytes per intensity.)Model Original Warped½¾ ¿ ½¾ ¿ ½¼¿ ¿ ¿ ¿ ¿¾ ¿Bonsai 69’811 157’337 77’909 67’676 30’373 5’748Skull 186’009 313’840 162’762 143’661 64’480 12’801Foot 125’052 175’890 77’340 67’820 30’545 6’193Table 1: Number of vertices extracted from the unoptimized andwarped datasets with our implementation.We show in Figure 6 that details are longer preserved in a warpedvolume compared to an unoptimized one when reducing the sizeof the datasets. In the figure, the isosurfaces in the first row areextracted from the (unoptimized) Skull dataset, where the secondrow contains the ones extracted from a warped dataset. The datasetis warped using the importance map shown in Figure 8. The numberof extracted vertices in each case is given in the table below.½¾ ¿ ¿ ¿ ¿¾ ¿Unoptimized 186’009 68’510 29’647 4’669Warped 313’840 143’661 64’480 12’801Table 2: Number of vertices extracted from the reduced unoptimizedand warped datasets.5 Conclusion6 AcknowledgementsWe would like to thank Gregory Abram <strong>for</strong> his assistance withOpenDX. The volume warping pipeline was implemented entirelyin OpenDX and was used to generate the isosurfaces shown in thispaper.References[4] Alan D. Kalvin. Segmentation and surface-based modelingof objects in 3-D biomedical images. Ph.d. thesis, New YorkUniversity, 1991.[5] Leif P. Kobbelt, Mario Botsch, Ulrich Schwanecke, and Hans-Peter Seidel. Feature-sensitive surface extraction from volumedata. In SIGGRAPH 2001, Computer Graphics Proceedings,Annual Conference Series, pages 57–66. ACM Press /ACM SIGGRAPH, August 2001. ISBN 1-58113-292-1.[6] William Lorenson and Harvey Cline. Marching cubes: Ahigh resolution 3d surface construction algorithm. ComputerGraphics, 21(4):163–169, July 1987.[7] Ralf Neubauer, Mario Ohlberger, Martin Rumpf, and RalphSchwörer. Visualization in Scientific Computing ’97, chapterEfficient visualization of large-scale data on hierarchicalmeshes. Springer, Wien, 1997. ISBN 3-211-83049-9.[8] Mario Ohlberger and Martin Rumpf. Hierarchical and adaptivevisualization on nested grids. Computing, 59(4):365–385,1997.[9] Dietmar Saupe and Jens-Peer Kuska. Compression of isosurfaces<strong>for</strong> structured volumes. In Vision, Modelling and Visualization2001, Stuttgart, Germany, November 2001. IEEE.[10] Dietmar Saupe and Jürgen Toelke. Optimal memory constrainedisosurface extraction. In Vision, Modelling and Visualization2001, Stuttgart, Germany, November 2001. IEEE.[11] Raj Shekhar, Elias Fayyad, Roni Yagel, and J. Fredrick Cornhill.Octree-based decimation of marching cubes surfaces.In Visualization 1996, pages 335–344. IEEE, October 1996.ISBN 0-89791-864-9.[12] Francisco Velasco and Juan Carlos Torres. Cells octree: a newdata structure <strong>for</strong> volume modeling and visualization. In Vision,Modelling and Visualization 2001, Stuttgart, Germany,November 2001. IEEE.[13] Ruediger Westermann. A multiresolution framework <strong>for</strong> volumerendering. In Arie Kaufman and Wolfgang Krueger, editors,1994 Symposium on <strong>Volume</strong> Visualization, pages 51–58,1994.[14] Jane Wilhelms and Allen Van Gelder. Octrees <strong>for</strong> fasterisosurface generation. ACM Transactions on Graphics,11(3):201–227, July 1992. ISSN 0730-0301.[15] Z. J. Wood, M. Desbrun, P. Schröder, and David Breen. Semiregularmesh extraction from volumes. In Visualization 2000,pages 275–282. IEEE, October 2000. ISBN 0-7803-6478-3.[1] Chandrajit Bajaj, Insung Ihm, and Sanghun Park.Visualization-specific compression of large volume data.In Proceedings of Pacific Graphics 2001, pages 212–222,Tokyo, Japan, October 2001.[2] Laurent Balmelli, Gabriel Taubin, and Fausto Bernardini.Space-optimized texture maps. To appear in Proceedingsof Eurographics, September 2002. preprint available athttp://www.balmelli.net/download/RC22328.pdf.[3] Paolo Cignoni, Paola Marino, Claudio Montani, EnricoPuppo, and Roberto Scopigno. Speeding up isosurface extractionusing interval trees. Transactions on Visualization andComputer Graphics, 3(2):158–170, April - June 1997. ISSN1077-2626.
Figure 8: Skull model. First row, left to right: extraction from unoptimized ½¾ ¿ volume (186’007 vertices) and warped ½¾ ¿ volume(313’840 vertices), respectively. Framed: importance map used <strong>for</strong> computing the warping function. Second row, left to right: unwarpedsurface extracted from (warped) ½¾ ¿ volume and ½¼¿ ¿ volume (162’762 vertices). Third row, left to right: tessellation of the isosurfaceextracted from an unoptimized ¿ volume and optimized ¿ volume, respectively.
Figure 9: Foot model. First row, left to right: extraction from unoptimized ½¾ ¿ volume (125’052 vertices) and warped ½¾ ¿ volume(175’890 vertices), respectively. Framed: importance map used <strong>for</strong> computing the warping function. Second row, left to right: unwarpedsurface extracted from (warped) ½¾ ¿ volume and ½½ ¿ volume (96’935 vertices), respectively. Third row, left to right: tessellation of theisosurface extracted from the unoptimized ½¾ ¿ volume and warped ½½ ¿ volume, respectively.