APPLICATION OF GIS AND REMOTE SENSING IN 3D MODELLING ...
APPLICATION OF GIS AND REMOTE SENSING IN 3D MODELLING ...
APPLICATION OF GIS AND REMOTE SENSING IN 3D MODELLING ...

Create successful ePaper yourself
Turn your PDF publications into a flip-book with our unique Google optimized e-Paper software.
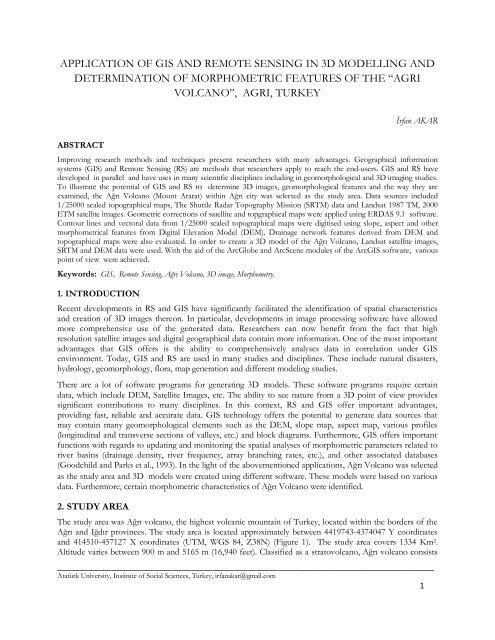
<strong>APPLICATION</strong> <strong>OF</strong> <strong>GIS</strong> <strong>AND</strong> <strong>REMOTE</strong> <strong>SENS<strong>IN</strong>G</strong> <strong>IN</strong> <strong>3D</strong> MODELL<strong>IN</strong>G <strong>AND</strong>DETERM<strong>IN</strong>ATION <strong>OF</strong> MORPHOMETRIC FEATURES <strong>OF</strong> THE “AGRIVOLCANO”, AGRI, TURKEYİrfan AKARABSTRACTImproving research methods and techniques present researchers with many advantages. Geographical informationsystems (<strong>GIS</strong>) and Remote Sensing (RS) are methods that researchers apply to reach the end-users. <strong>GIS</strong> and RS havedeveloped in parallel and have uses in many scientıfic disciplines including in geomorphological and <strong>3D</strong> imaging studies.To illustrate the potential of <strong>GIS</strong> and RS to determine <strong>3D</strong> images, geomorphological features and the way they areexamined, the Ağrı Volcano (Mount Ararat) within Ağrı city was selected as the study area. Data sources included1/25000 scaled topographical maps, The Shuttle Radar Topography Mission (SRTM) data and Landsat 1987 TM, 2000ETM satellite images. Geometric corrections of satellite and topgraphical maps were applied using ERDAS 9.1 software.Contour lines and vectoral data from 1/25000 scaled topographical maps were digitised using slope, aspect and othermorphometrical features from Digital Elevation Model (DEM). Drainage network features derived from DEM andtopographical maps were also evaluated. In order to create a <strong>3D</strong> model of the Ağrı Volcano, Landsat satellite images,SRTM and DEM data were used. With the aid of the ArcGlobe and ArcScene modules of the Arc<strong>GIS</strong> software, variouspoint of view were achieved.Keywords: <strong>GIS</strong>, Remote Sensing, Ağrı Volcano, <strong>3D</strong> image, Morphometry.1. <strong>IN</strong>TRODUCTIONRecent developments in RS and <strong>GIS</strong> have significantly facilitated the identification of spatial characteristicsand creation of <strong>3D</strong> images thereon. In particular, developments in image processing software have allowedmore comprehensive use of the generated data. Researchers can now benefit from the fact that highresolution satellite images and digital geographical data contain more information. One of the most importantadvantages that <strong>GIS</strong> offers is the ability to comprehensively analyses data in correlation under <strong>GIS</strong>environment. Today, <strong>GIS</strong> and RS are used in many studies and disciplines. These include natural disasters,hydrology, geomorphology, flora, map generation and different modeling studies.There are a lot of software programs for generating <strong>3D</strong> models. These software programs require certaindata, which include DEM, Satellite Images, etc. The ability to see nature from a <strong>3D</strong> point of view providessignificant contributions to many disciplines. In this context, RS and <strong>GIS</strong> offer important advantages,providing fast, reliable and accurate data. <strong>GIS</strong> technology offers the potential to generate data sources thatmay contain many geomorphological elements such as the DEM, slope map, aspect map, various profiles(longitudinal and transverse sections of valleys, etc.) and block diagrams. Furthermore, <strong>GIS</strong> offers importantfunctions with regards to updating and monitoring the spatial analyses of morphometric parameters related toriver basins (drainage density, river frequency, array branching rates, etc.), and other associated databases(Goodchild and Parks et al., 1993). In the light of the abovementioned applications, Ağrı Volcano was selectedas the study area and <strong>3D</strong> models were created using different software. These models were based on variousdata. Furthermore, certain morphometric characteristics of Ağrı Volcano were identified.2. STUDY AREAThe study area was Ağrı volcano, the highest volcanic mountain of Turkey, located within the borders of theAğrı and Iğdır provinces. The study area is located approximately between 4419743-4374047 Y coordinatesand 414510-457127 X coordinates (UTM, WGS 84, Z38N) (Figure 1). The study area covers 1334 Km 2 .Altitude varies between 900 m and 5165 m (16,940 feet). Classified as a stratovolcano, Ağrı volcano consists_____________________________________________________________________________________Atatürk University, Institute of Social Sciences, Turkey, irfanakar@gmail.com1
of lava, volcanic breccia and trass. Slopes feature early basalt streams. Located to the southeast of Ağrıvolcano is little Mount Ağrı. little Mount Ağrı is 3896 m high.3. DATA <strong>AND</strong> METHODFigure 1: The Study Area.Data resources for this study consisted of 1/25000 scaled topographic maps, L<strong>AND</strong>SAT 2000 ETM and1989 TM satellite images and SRTM data. In order to perform <strong>3D</strong> modeling and to identify certainmorphometric characteristics of the study area, geometric corrections on 1/25000 scaled topography mapswere performed using ERDAS imagine 9.1 and Arc<strong>GIS</strong> 9.2 software. Vectoral data on topography maps(contour lines, hills, rivers) were digitised using Arc<strong>GIS</strong> 9.2 software. The Archydro tool of Arc<strong>GIS</strong> 9.2software was used to generate flow accumulation and natural flow models of rivers. DEM, 3 arcsecond (90 m)SRTM data and L<strong>AND</strong>SAT satellite images were used to create <strong>3D</strong> models of the study area. ArcGlobe andGlobal Mapper 7.0 software were used for <strong>3D</strong> applications. Slope and aspect maps were generated and theirareal distribution identified graphically. Global Mapper 7.0 software was used to create <strong>3D</strong> models generatedfrom SRTM data in Hgt format, which is gathered at 3 arcsecond (90 m) intervals.4. <strong>3D</strong> MODELS4.1. <strong>3D</strong> Modeling from SRTM DataThe Shuttle Radar Topography Mission (SRTM) satellite went into orbit in 2000 in order to obtain<strong>3D</strong> topographic data from Earth by means of radar interferometry, and successfully completed itsmission within 11 days. SRTM is one of the most important single pass spacecrafts. The SRTMinstrument was made up of three sections, the main radar antenna, the mast, and the outboard radar antenna(Figure 3). SRTM data consists of two bands, namely C-band and X-band. The SRTM C-bandoperated with the ScanSAR mode and collected data on almost the entire Earth. The X-band did nothave the ScanSAR mode and therefore contains square-shaped data gaps (Jacobsen, 2004). The C-band collected data at 3 arcsecond (90m) intervals with a scan width of 225 km and the X-bandcollected data at 1 arcsecond (30m) intervals with a scan width of 45 km (Sefercik, 2007). Please refer
to figure 2 for the data collection method of the SRTM satellite. Topographic data from the C-bandwere used in this study to create the C-Band Altitude Model of Ağrı volcano Global Mapper 7.0software was used to create the <strong>3D</strong> model (Figure 4).Figure 2 : SRTM Data Collection Geometry.Figure 3: Instrument of SRTM.Figure 4 : <strong>3D</strong> Model of Ağrı Volcano Generated from SRTM Data.4.2. <strong>3D</strong> Generation from Satellite ImagesToday, satellite images taken at different times with different spatial resolutions are used to create <strong>3D</strong> models.Landsat satellite images are among the data used for this purpose. L<strong>AND</strong>SAT TM (08.31.1989) and ETM(08.13.2000) satellite images were used for this study (Figure 5 and 6). L<strong>AND</strong>SAT satellite images havedifferent features (Table 1). The 3, 2, 1 band (0.45-0.69 μm) combination of ETM and TM satellite imageswere used to create <strong>3D</strong> models. DEM generated from 1/25000 scaled topographic maps was used for <strong>3D</strong>models created from satellite images.Figure 5 : Landsat TM image overlaid on DEMstudy area.Figure 6 : Landsat ETM image overlaid on DEMstudy area._____________________________________________________________________________________Atatürk University, Institute of Social Sciences, Turkey, irfanakar@gmail.com3
5.1. Slope CharacteristicsSlope is the difference in altitude between two points located at a certain horizontal distance (Bilgin,2001). Water and other materials start flowing in parallel with the slope direction due to gravity.Therefore, slope is very important with regards to hydrological and geomorphological studies. <strong>GIS</strong> definesslope as the maximum rate of change from each cell on the raster base to other surrounding cells(Burrough and Mcdonell, 1998). The desired definition can be selected and the slope map generatedaccording to the study. The Surface Analysis module of <strong>3D</strong> Analyst was used to generate the percentageslope map (10x10) of the area from the DEM at 10 m intervals. The Spatial Analyst module was also usedto do areal calculations of slope values and their digital equivalents (Figure 9). These values andcharacteristics provide quantitative and reliable information on the study area. Slope values tended toincrease on the NE slope of the mountain and sections where glacial valleys are located. This will be seenclearly when the <strong>3D</strong> slope model is examined (Figure 10). The red zones correspond to sections withhigher slope values and green zones and shades of green correspond to sections with lower slope values.Slope values are divided into 6 groups. These groups are shown in the table below.Figure 9 : Slope map of study area.Figure 10 : <strong>3D</strong> Slope Model of Ağrı Volcano.5
5.2. Aspect CharacteristicsHaving been defined as the direction of the slope surface, aspect is measured at (0-360 o ) degreesclockwise. Flat areas are assigned a -1 value because they do not face any direction. Aspect factor plays animportant role in the duration and severity of humidity, precipitation, wind and sun on the land. Measuredin degrees, aspect is calculated by using definite differences (Wilson and Gallant, 2000). As in theidentification of slope characteristics, the Surface Analysis module of <strong>3D</strong> Analyst was used to identifyaspect characteristics of the study area. Aspect was divided into 9 groups including four cardinaldirections, four intercardinal directions and flat areas areas (Figure 11). Areal calculations of aspect valueswere made and maps generated accordingly. ArcGlobe was used to generate the <strong>3D</strong> aspect model (Figure12).Figure 11 : Aspect of Study Area.Figure 12 : <strong>3D</strong> Aspect Model of Ağrı Volcano.5.2. Drainage Properties Generated from DEMFor DEM generation, contour line curves on the 1/25000 scaled topographic maps were manuallydigitised and DEM of the study area was obtained with a grid interval of 10 m. The Hydrology Toolsmodule of Arc<strong>GIS</strong> 9.2 software was used to generate rivers from DEM. The higher the DEM resolution,the more realistic the rivers are ; otherwise, large flat areas will produce an unnatural drainage network(Maidment, 2002; Özdemir, 2006). After DEM was selected, the noise and abnormal heights on the DEMwere corrected in order to eliminate interruption of the river network (Tarboton and Bras et. al., 1991;Özdemir, 2006). The Filled DEM data was used to generate Flow Directions (Figure 13). The D8 method
was used to determine natural flow directions. There are eight valid output directions relating to the eightadjacent cells into which flow could travel. This approach is commonly referred to as an eight direction(D8) flow model and follows an approach presented in (Jensen and Domingue 1988). The direction offlow is determined by finding the direction of steepest descent, or maximum drop, from each cell. Thedistance is determined between cell centers. Another model generated by using DEM in hydrology studiesis the Flow Accumulation model obtained from the Flow Direction model (Figure 15). Water flowdirections are identified from DEM and a water flow directions model is created accordingly. Startingfrom the top right corner on the water flow directions model, the flow accumulation values are calculatedcell by cell. If a cell does not receive a flow from another cell, its value will be zero (Figure 16). Each grid(pixel) cell on the DEM has a numeric value. The flow from the cell can only be to one neighbouring cellwith a lower altitude value. There are 8 possible directions for each cell. Figure 14 shows the possibleflow directions from cell 50 and the values to be assigned to cell 50 in the new water flow direction model.These values define the flow directions in software operating under <strong>GIS</strong>. Accordingly, if flow is to theright of cell 50, the flow direction value of cell 50 will be 8; and if flow is to the left of cell 50, the flowdirection value will be 4; and if flow is to the bottom of cell 50, the flow direction will be 2 (Jenson andDomingue 1988; ESRI 1992a, 1992b).Fifgure 13 : Flow Direction of Ağrı volcano. Figure 14 : Calculation method of FlowDirection.Figure 15 : Flow Accumulation of Ağrı volcano. Figure 16 : Calculation method of FlowAccumulation.7
CONCLUSİONIt is not possible to show all applications of <strong>GIS</strong> and RS in this study. Therefore, only some of the topicshave been reviewed. <strong>3D</strong> models of Mount Ağrı were created and some of its morphometric characteristicswere specified. In the <strong>3D</strong> models, it is clearly seen that Mount Ağrı is a strato volcanic type mountain.Also, when we look at the morphometric characteristics, it is observed that slope values range from 0 to60 degrees. The dominant direction is the Northeast in the aspect values. It is observed that surface watershave a significant impact on formation of the Mount Ağrı. The flow collection and natural flow modelsproduced using DEM of the Mount Ağrı prove this point clearly. <strong>GIS</strong> and RS, which both have significantresources for utilization and analysis of spatial characteristics, have been used in multi-directional mannerin this study also. <strong>GIS</strong> and RS have important potential in assessment and interpretation of the dataproduced within the same geometric features.REFERENCESBilgin, T. (2001) General Cartography II, Filiz Bookhouse,, ISBN: 975-368-136-4., pp. 237-241, Istanbul,Turkey.Burrough, p.A., Mcdonell, r.a (1998) Principles of geographical ınformation systems.(oxford university press,), p.190. Newyork.ESRI ., (1992a) Grid Commands Refernces, Arc/Info User’s Guide, Environmental Systems ResearchInstitute, Inc., USA.ESRI .,(1992b.) Cell-based Modelling with Grid, , Arc/Info User’s Guide, Environmental SystemsResearch Institute, Inc., USA.Goodchild, M.F., Parks, B.O., Steyaert, L.T. (1993) Environmental Modeling with <strong>GIS</strong> (SpatialInformation Systems). Oxford University Press, New York, USA. "Some years ago I met with anumber of astronauts who were preparing to man the SpaceLab module on one of the U.S. spaceshuttles."Jacobsen, K.. (2004) Analysis of Digital Elevation Models based on Space Information. EARSeLSymposium, Dubrovnik, 2004, 8 p. (on CD-ROM).Jenson., S.K., Domingue., J.O., (1988) Extracting topographic structure from digital elevation data forgeographical information system analysis. Photogrametric Engineering Remote Sensing 54, 1593–1600.Kumler, M:P. (1994) An Intensive Comparison of Triangulated Irregular Networks (T<strong>IN</strong>s) and DigitalElevation Models (DEMs), Cartographica, 31 (2):1-99.Maidment, D.R.. (2002) ArcHydro <strong>GIS</strong> for Water Resources, Esri Press, California.Özdemir, H. (2006,) Comparision of drainage morphometries drived from topographic sheets and DEMin the view of flood studies, 1.Remote Sensing-<strong>GIS</strong> workshop and Panel, ISBN : 975-561-290-4,(CD), ITU Civil Engineering Faculty Remote Sensing Division, Istanbul, Turkey, 27-28November.Sefercik, U. G. (2007) Radar İnterferometri Tekniği İle Sym Üretimi ve Doğruluk DeğerlendirmeleriTMMOB Harita Ve Kadastro Mühendisleri Odası 11.Türkiye Harita Bilimsel ve Teknik Kurultayı. Ankara2-6 April.Tarboton D. G., Bras, R. L., Rodriguez-Iturbe, I. (1991) On the Extraction of Channel Networks fromDigital Elevation Data, Hydrological Processes. Vol. 5, 81-100.Wilson, J.P., Gallant, J.C. (2000) Terrain Analysis; Principles and Applications, Jhon Wiley&Sons,Inc.USA.