
You also want an ePaper? Increase the reach of your titles
YUMPU automatically turns print PDFs into web optimized ePapers that Google loves.
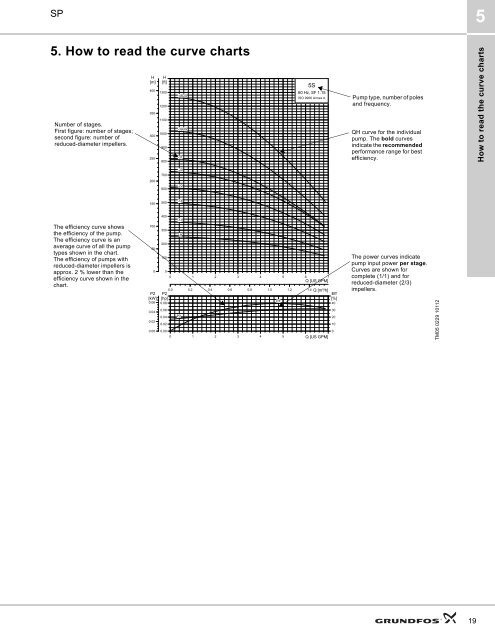
SP55. How to read the curve chartsNumber of stages.First figure: number of stages;second figure: number ofreduced-diameter impellers.H[m]400350300250H[ft]1300120011001000900800-48DS-39DS-315S60 Hz, SF 1.15ISO 9906 Annex APump type, number of polesand frequency.QH curve for the individualpump. The bold curvesindicate the recommendedperformance range for bestefficiency.How to read the curve charts200700600-26-22150500-18The efficiency curve showsthe efficiency of the pump.The efficiency curve is anaverage curve of all the pumptypes shown in the chart.The efficiency of pumps withreduced-diameter impellers isapprox. 2 % lower than theefficiency curve shown in thechart.100500P2[kW]0.060.040.020.004003002001000P2[hp]0.080.060.040.020.00-13-90 1 2 3 4 5 6 7Q [US GPM]0.0 0.2 0.4 0.6 0.8 1.0 1.2 1.4 Q [m³/h]Eff[%]Eff40P20 1 2 3 4 5 Q [US GPM]3020100The power curves indicatepump input power per stage.Curves are shown forcomplete (1/1) and forreduced-diameter (2/3)impellers.TM05 0229 1011219