At June 30, 2010, considering the total outstanding exposure in foreign currency, if the Rupee had weakened /strengthened by 5% against the US dollar with all other variables held constant, profit for the year would havebeen higher / lower by Rs. 1.10 million (2009: Rs. 1.7 million), mainly as a result of foreign exchange gains /losses on translation of foreign currency import loans.32.3.3 Equity price risk managementThe Company’s listed equity securities are susceptible to market price risk arising from uncertainties about futurevalues of the investment securities. The Company manages the equity price risk through diversification and offerproper review of individual and total equity instruments. Reports on the equity portfolio are submitted to theCompany’s senior management on a regular basis.At the balance sheet date, the exposure to listed units of mutual funds at fair value is Rs. 754.49 million (2009:Rs. 121.79 million). A decrease / increase of 5% in the net asset value per unit would have an impact ofapproximately Rs. 37.72 million (2009: Rs. 6.09 million) on the income of the Company, depending on whetheror not the decline is significant and prolonged.At the balance sheet date, the exposure to listed equity securities at fair value is Rs. 9.55 million (2009: Rs.215.15 million). A decrease / increase of 5% on the KSE market index would have an impact of approximatelyRs.0.478 million (2009: Rs. 10.76 million) on the other comprehensive income of the Company, depending onwhether or not the decline is significant and prolonged . In addition the Company has exposure of Rs. 100.53million (2009: Rs. 70.12 million) to unlisted equity securities of a wholly owned subsidiary and in listed equitysecurities carried at cost as investment in associate of Rs. 65.29 million (2009: Rs. 65.29 million) having fairvalue of Rs. 3,864 million (2009: Rs. 3,185 million) are held for strategic rather than trading purpose. TheCompany does not actively trade in these securities. A decrease / increase of 5% on the KSE market index wouldhave an impact of approximately Rs.193.20 million (2009: Rs. 159.25 million) on the fair value of these listedequity securites.32.4 Determination of fair values32.4.1 Fair value of financial instrumentsFair value is the amount for which an asset could be exchanged, or a liability settled, between knowledgeablewilling parties in an arms length transaction other than in a forced or liquidation sale.The carrying values of all financial assets and liabilities reflected in the financial statements approximate their fairvalues.32.5 Financial instruments by categoryThe accounting policies for financial instruments have been applied for line items below:Fair valueLoan & Available through profitadvances for sale or lossRupees in 000TotalAssets as per balance sheet- December 31, 2010Long term investments - 175,391 - 175,391Long term deposits 10,544 - - 10,544Trade debtors 69,763 - - 69,763Loans and advances 1,658 - - 1,658Deposits, prepayments and other receivables 88,842 - - 88,842Short term investments - - 754,487 754,487Cash and bank balances 24,474 - - 24,474195,281 175,391 754,487 1,125,159
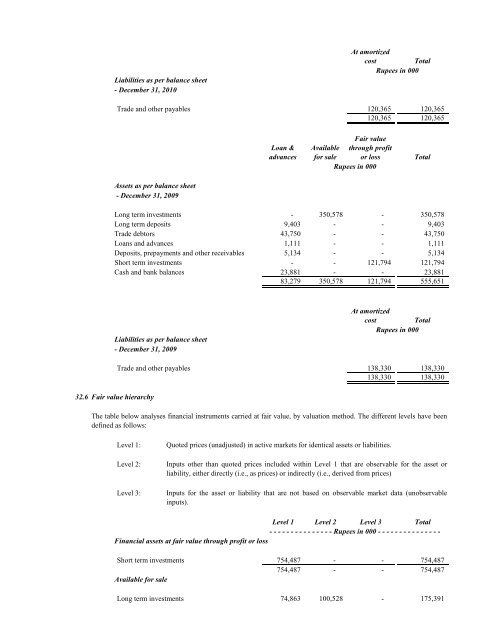
Liabilities as per balance sheet- December 31, 2010At amortizedcostTotalRupees in 000Trade and other payables 120,365 120,365120,365 120,365Loan &advancesFair valueAvailable through profitfor sale or lossRupees in 000TotalAssets as per balance sheet- December 31, 2009Long term investments - 350,578 - 350,578Long term deposits 9,403 - - 9,403Trade debtors 43,750 - - 43,750Loans and advances 1,111 - - 1,111Deposits, prepayments and other receivables 5,134 - - 5,134Short term investments - - 121,794 121,794Cash and bank balances 23,881 - - 23,88183,279 350,578 121,794 555,651Liabilities as per balance sheet- December 31, 2009At amortizedcostTotalRupees in 00032.6 Fair value hierarchyTrade and other payables 138,330 138,330138,330 138,330The table below analyses financial instruments carried at fair value, by valuation method. The different levels have beendefined as follows:Level 1:Level 2:Level 3:Quoted prices (unadjusted) in active markets for identical assets or liabilities.Inputs other than quoted prices included within Level 1 that are observable for the asset orliability, either directly (i.e., as prices) or indirectly (i.e., derived from prices)Inputs for the asset or liability that are not based on observable market data (unobservableinputs).Level 1 Level 2 Level 3 Total- - - - - - - - - - - - - - - Rupees in 000 - - - - - - - - - - - - - - -Financial assets at fair value through profit or lossShort term investments 754,487 - - 754,487754,487 - - 754,487Available for saleLong term investments 74,863 100,528 - 175,391