clicking here - Veterinary Diagnostic Laboratory - University of ...
clicking here - Veterinary Diagnostic Laboratory - University of ...
clicking here - Veterinary Diagnostic Laboratory - University of ...

You also want an ePaper? Increase the reach of your titles
YUMPU automatically turns print PDFs into web optimized ePapers that Google loves.
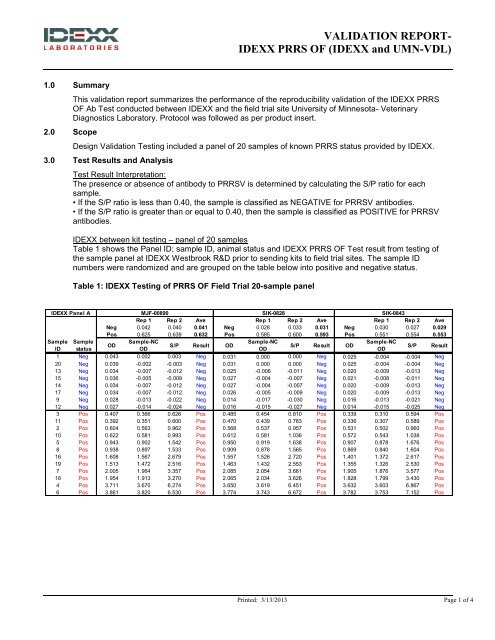
VALIDATION REPORT-IDEXX PRRS OF (IDEXX and UMN-VDL)1.0 Summary2.0 ScopeThis validation report summarizes the performance <strong>of</strong> the reproducibility validation <strong>of</strong> the IDEXX PRRSOF Ab Test conducted between IDEXX and the field trial site <strong>University</strong> <strong>of</strong> Minnesota- <strong>Veterinary</strong><strong>Diagnostic</strong>s <strong>Laboratory</strong>. Protocol was followed as per product insert.Design Validation Testing included a panel <strong>of</strong> 20 samples <strong>of</strong> known PRRS status provided by IDEXX.3.0 Test Results and AnalysisTest Result Interpretation:The presence or absence <strong>of</strong> antibody to PRRSV is determined by calculating the S/P ratio for eachsample.• If the S/P ratio is less than 0.40, the sample is classified as NEGATIVE for PRRSV antibodies.• If the S/P ratio is greater than or equal to 0.40, then the sample is classified as POSITIVE for PRRSVantibodies.IDEXX between kit testing – panel <strong>of</strong> 20 samplesTable 1 shows the Panel ID; sample ID, animal status and IDEXX PRRS OF Test result from testing <strong>of</strong>the sample panel at IDEXX Westbrook R&D prior to sending kits to field trial sites. The sample IDnumbers were randomized and are grouped on the table below into positive and negative status.Table 1: IDEXX Testing <strong>of</strong> PRRS OF Field Trial 20-sample panelIDEXX Panel A MJF-00890 SIK-0828 SIK-0843Rep 1 Rep 2 Ave Rep 1 Rep 2 Ave Rep 1 Rep 2 AveNeg 0.042 0.040 0.041 Neg 0.028 0.033 0.031 Neg 0.030 0.027 0.029Pos 0.625 0.639 0.632 Pos 0.585 0.600 0.593 Pos 0.551 0.554 0.553Sample SampleSample-NCSample-NCSample-NCODS/P Result ODS/P Result ODID statusODODODS/P Result1 Neg 0.043 0.002 0.003 Neg 0.031 0.000 0.000 Neg 0.025 -0.004 -0.004 Neg20 Neg 0.039 -0.002 -0.003 Neg 0.031 0.000 0.000 Neg 0.025 -0.004 -0.004 Neg13 Neg 0.034 -0.007 -0.012 Neg 0.025 -0.006 -0.011 Neg 0.020 -0.009 -0.013 Neg15 Neg 0.036 -0.005 -0.009 Neg 0.027 -0.004 -0.007 Neg 0.021 -0.008 -0.011 Neg14 Neg 0.034 -0.007 -0.012 Neg 0.027 -0.004 -0.007 Neg 0.020 -0.009 -0.013 Neg17 Neg 0.034 -0.007 -0.012 Neg 0.026 -0.005 -0.009 Neg 0.020 -0.009 -0.013 Neg9 Neg 0.028 -0.013 -0.022 Neg 0.014 -0.017 -0.030 Neg 0.016 -0.013 -0.021 Neg12 Neg 0.027 -0.014 -0.024 Neg 0.016 -0.015 -0.027 Neg 0.014 -0.015 -0.025 Neg3 Pos 0.407 0.366 0.626 Pos 0.485 0.454 0.810 Pos 0.339 0.310 0.594 Pos11 Pos 0.392 0.351 0.600 Pos 0.470 0.439 0.783 Pos 0.336 0.307 0.589 Pos2 Pos 0.604 0.563 0.962 Pos 0.568 0.537 0.957 Pos 0.531 0.502 0.960 Pos10 Pos 0.622 0.581 0.993 Pos 0.612 0.581 1.036 Pos 0.572 0.543 1.038 Pos5 Pos 0.943 0.902 1.542 Pos 0.950 0.919 1.638 Pos 0.907 0.878 1.676 Pos8 Pos 0.938 0.897 1.533 Pos 0.909 0.878 1.565 Pos 0.869 0.840 1.604 Pos16 Pos 1.608 1.567 2.679 Pos 1.557 1.526 2.720 Pos 1.401 1.372 2.617 Pos19 Pos 1.513 1.472 2.516 Pos 1.463 1.432 2.553 Pos 1.355 1.326 2.530 Pos7 Pos 2.005 1.964 3.357 Pos 2.085 2.054 3.661 Pos 1.905 1.876 3.577 Pos18 Pos 1.954 1.913 3.270 Pos 2.065 2.034 3.626 Pos 1.828 1.799 3.430 Pos4 Pos 3.711 3.670 6.274 Pos 3.650 3.619 6.451 Pos 3.632 3.603 6.867 Pos6 Pos 3.861 3.820 6.530 Pos 3.774 3.743 6.672 Pos 3.782 3.753 7.152 PosPrinted: 3/13/2013 Page 1 <strong>of</strong> 4
VALIDATION REPORT-IDEXX PRRS OF (IDEXX and UMN-VDL)Figure 1 shows the measurement discrimination plots and intra-class correlation coefficients (r icc ) for thepanel testing at IDEXX. Each <strong>of</strong> the kit pairs demonstrated an r icc value above 0.99, which indicates ahigh degree <strong>of</strong> correlation.Figure 1: Kit-kit agreement with the 20-sample panel- IDEXX Test Results<strong>University</strong> <strong>of</strong> Minnesota <strong>Veterinary</strong> <strong>Diagnostic</strong> <strong>Laboratory</strong> (UMN-VDL) – 20-sample panelTable 2 shows sample ID, sample status, and IDEXX PRRS OF test results from testing <strong>of</strong> IDEXX 20-sample panel at the UMN-VDL. Categorical agreement with sample status for all three kits was 100%.Table 2: UMN-VDL Testing <strong>of</strong> PRRS OF Field Trial 20-sample panelIDEXX Panel A MJF-00890 SIK-0828 SIK-0843Rep 1 Rep 2 Ave Rep 1 Rep 2 Ave Rep 1 Rep 2 AveNeg 0.039 0.035 0.037 Neg 0.037 0.034 0.036 Neg 0.029 0.031 0.030Pos 0.618 0.637 0.628 Pos 0.64 0.644 0.642 Pos 0.664 0.658 0.661Sample SampleSample-NCSample-NCSample-NCODS/P Result ODS/P Result ODID statusODODODS/P Result1 Neg 0.036 -0.001 -0.002 Neg 0.040 0.004 0.006 Neg 0.033 0.003 0.005 Neg20 Neg 0.040 0.003 0.005 Neg 0.037 0.001 0.002 Neg 0.041 0.011 0.017 Neg13 Neg 0.035 -0.002 -0.003 Neg 0.032 -0.004 -0.006 Neg 0.036 0.006 0.009 Neg15 Neg 0.033 -0.004 -0.006 Neg 0.028 -0.008 -0.012 Neg 0.033 0.003 0.005 Neg14 Neg 0.033 -0.004 -0.006 Neg 0.028 -0.008 -0.012 Neg 0.032 0.002 0.003 Neg17 Neg 0.031 -0.006 -0.010 Neg 0.028 -0.008 -0.012 Neg 0.034 0.004 0.006 Neg9 Neg 0.025 -0.012 -0.019 Neg 0.019 -0.017 -0.026 Neg 0.015 -0.015 -0.023 Neg12 Neg 0.025 -0.012 -0.019 Neg 0.018 -0.018 -0.028 Neg 0.017 -0.013 -0.020 Neg3 Pos 0.386 0.349 0.556 Pos 0.535 0.499 0.777 Pos 0.439 0.409 0.619 Pos11 Pos 0.384 0.347 0.553 Pos 0.521 0.485 0.755 Pos 0.435 0.405 0.613 Pos2 Pos 0.629 0.592 0.943 Pos 0.670 0.634 0.988 Pos 0.689 0.659 0.997 Pos10 Pos 0.608 0.571 0.909 Pos 0.658 0.622 0.969 Pos 0.691 0.661 1.000 Pos5 Pos 0.903 0.866 1.379 Pos 1.015 0.979 1.525 Pos 1.111 1.081 1.635 Pos8 Pos 0.898 0.861 1.371 Pos 0.961 0.925 1.441 Pos 1.045 1.015 1.536 Pos16 Pos 1.416 1.379 2.196 Pos 1.502 1.466 2.283 Pos 1.722 1.692 2.560 Pos19 Pos 1.570 1.533 2.441 Pos 1.501 1.465 2.282 Pos 1.839 1.809 2.737 Pos7 Pos 1.812 1.775 2.826 Pos 2.114 2.078 3.237 Pos 2.116 2.086 3.156 Pos18 Pos 1.856 1.819 2.896 Pos 2.084 2.048 3.190 Pos 2.225 2.195 3.321 Pos4 Pos 3.102 3.065 4.881 Pos 2.947 2.911 4.534 Pos 3.084 3.054 4.620 Pos6 Pos 2.995 2.958 4.710 Pos 2.944 2.908 4.530 Pos 3.406 3.376 5.107 PosPrinted: 3/13/2013 Page 2 <strong>of</strong> 4
VALIDATION REPORT-IDEXX PRRS OF (IDEXX and UMN-VDL)Figure 2 shows the measurement discrimination plots and intra-class correlation coefficients (r icc ) for the20-sample panel testing at UMN-VDL. Once again each <strong>of</strong> the kit pairs demonstrated an r icc value above0.99, which indicates a high degree <strong>of</strong> correlation.Figure 2: Kit-kit agreement 20-sample panel- UMN-VDL Test ResultsOverall Agreement – 20-sample panelThe categorical agreement for the 20-samples set across the three R&D kit lots and between IDEXX andUMN-VDL was 100%. Table 3 shows the site-to-site agreement by kit lot, as measured by intraclasscorrelation coefficient (r icc ) for panel results generated between IDEXX and UMN-VDL. In all cases, the r iccvalue is greater than 0.900, which represents a high level <strong>of</strong> agreement.This demonstrates that the testperformance is highly reproducible under variable laboratory conditions and operators.Table 3: Intra-Class Correlation Coefficients between IDEXX and UMN-VDLPrinted: 3/13/2013 Page 3 <strong>of</strong> 4
S/PIDEXXUMN-VDLIDEXXUMN-VDLIDEXXUMN-VDLVALIDATION REPORT-IDEXX PRRS OF (IDEXX and UMN-VDL)Figure 3 shows a multivariate chart <strong>of</strong> the 20-sample set results from each <strong>of</strong> the kit lots tested. The figureshows the 0.40 S/P cut-<strong>of</strong>f as a dashed line.Figure 3 – 20- Sample Set (N=20)76543210Lot MJF-0890Lot SIK-0828Lot SIK-0843While t<strong>here</strong> is some variability in the assay response for strong samples (the S/P values <strong>of</strong> the strongpositives run by UMN-VDL were lower than in IDEXX), the general reproducibility <strong>of</strong> the assay is verygood.Printed: 3/13/2013 Page 4 <strong>of</strong> 4