ATOMIC ABSORPTION SPECTROSCOPY - University of Michigan
ATOMIC ABSORPTION SPECTROSCOPY - University of Michigan
ATOMIC ABSORPTION SPECTROSCOPY - University of Michigan

Create successful ePaper yourself
Turn your PDF publications into a flip-book with our unique Google optimized e-Paper software.
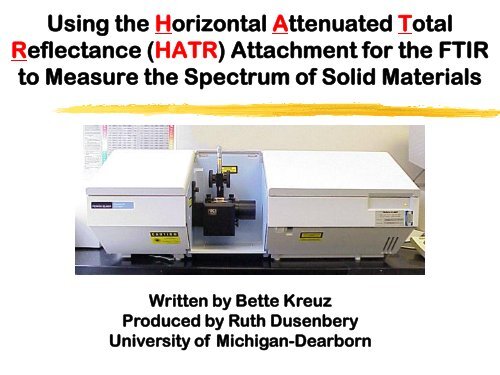
Using the Horizontal Attenuated TotalReflectance (HATR) Attachment for the FTIRto Measure the Spectrum <strong>of</strong> Solid MaterialsWritten by Bette KreuzProduced by Ruth Dusenbery<strong>University</strong> <strong>of</strong> <strong>Michigan</strong>-Dearborn
Slide 1aHorizontal attenuated total reflectance isa relatively recent method used to obtaininfrared spectra on FTIR instruments.It is an extremely useful tool to obtainspectra for solids without resorting to theuse <strong>of</strong> support materials.
Slide 1
Slide 2aThis method is based on internal reflection<strong>of</strong> the IR radiation by the sample, ratherthan transmission through the sample.The sample is pressed against a densecrystal and the radiation from the sourcepenetrates a very small distance into thesample.
Slide 2IR radiation undergoesinternal reflection by the sample.PressSampleSolid with highRefractive IndexIR radiationFROMMonochrometerIR radiationTOTransducer
Slide 3aDuring penetration <strong>of</strong> the IR radiation,energy is absorbed by the sample atwavelengths characteristic <strong>of</strong> its molecularstructure before being reflected from thecrystal to the detector.HATR spectra are therefore similar to, butnot identical to transmission spectra.The same wavenumbers are absorbed, butthe intensities may vary.
Slide 3IR radiation undergoesinternal reflection by the sample.Energy isabsorbed based onthe molecularstructure <strong>of</strong> thesample.PressSampleSolid with highRefractive IndexIR radiationFROMMonochrometerIR radiationTOTransducer
Slide 4aHATR measures the pattern <strong>of</strong> wavelengthsabsorbed by the sample.This is done by comparing the IR radiationreflected from the crystalwithout and with the sample present bymeans <strong>of</strong> the background and sample scans.
Slide 4HATR measures the pattern <strong>of</strong> wavelengthsabsorbed by the sample.SourceCrystalDetectorBackgroundScanSourceSampleCrystalDetectorSampleScan
Slide 5aThis method utilizes a standard FT IRinstrument with an HATR attachmentplaced in the sample compartment.
Slide 5
Slide 6aThe HATR attachment consists <strong>of</strong> a samplestage in the middle <strong>of</strong> which is a dense, resilientcrystal, such as zinc selenide (ZnSe).The press assembly and controls ensure close,reproducible contact between the sample andthe ZnSe crystal.The base assembly houses the opticalcomponents <strong>of</strong> the attachment.
Slide 6HATR componentsPress AssemblySampling StageControl KnobZnSe Crystal inCenter <strong>of</strong> StageBase Assemblywith OpticalComponents
Slide 7aIn order to obtain a quality spectrum, abackground scan must be obtained beforeeach sample.The sampling area must be clean and free<strong>of</strong> any materials, including the cleaningsolvent.Cleaning solvent must be removed with aKim Wipe and any residue allowed toevaporate before a spectrum is obtained.
Slide 7
Slide 8aA typical background scan should appearas the one pictured here.The CO 2 peak at about 2400 cm -1 mayvary in intensity.
Slide 8CO 2 Peak~2400 cm -1
Slide 9aIf extraneous peaks appear in thebackground at about 2800 to 3000 cm -1 ,as shown here, the stage should berecleaned or additional time allowed forsolvent evaporation.The background scan should then bererun.
Slide 93000-2800 cm -1Contaminant peaks
Slide 10aOnce the background has been correctlyestablished, choose “Overwrite thePrevious Background,” then click onthe delete icon on the monitor display.
Slide 10Choose “Overwrite the Previous Background,”then click on the delete icon on the monitor display.
Slide 11aIf necessary, solid crystalline samplesshould be finely ground with either amortar and pestle or a glass rod against awatchglass. This allows for better contactwith the ZnSe crystal.
Slide 11Finely grind crystalline samples for better contactwith the ZnSe crystal.
Slide 12aThe sample is placed on the ZnSe crystal witha microspatula.Enough sample should be used to completelycover the ZnSe crystal and provide intimatecontact.
Slide 12Sample should completely cover the ZnSe Crystalindicated with the arrow below.
Slide 13aThe sample is firmly pressed against thecrystal by using the control knobs to bring thesample press down against the sample.Be sure that the press is rotated completely tothe lowest level.
Slide 13Be surethat thepress isrotatedcompletelyto thelowestlevel.
Slide 14aSelect the “Scan” option on the control panel.The sample is then scanned in the usualmanner and given an appropriate name forlater retrieval.
Slide 14Select the “Scan” option on the control panel.
Slide 15aThe resulting spectrum should have welldefinedpeaks.The percent transmission <strong>of</strong> the larger peaksshould be between 20 and 40%.
Slide 15Example <strong>of</strong> a Spectrum with Well-Defined Peaks
Slide 16aAn inappropriate background scan can causethe appearance <strong>of</strong> inverted peaks and theresultant elongation <strong>of</strong> the %T scale.In such a case, the background needs to bererun along followed by another sample scan.
Slide 16Example <strong>of</strong> a Spectrum run with poor Background DataNoteinvertedpeaks andelongation<strong>of</strong> %Tscale
Slide 17aPoor contact between the sample and thecrystal produces poorly defined peaks at verysmall %T values and a noisy baseline.The sample should be rerun with one <strong>of</strong> thefollowing changes:‣Increase the pressure from the press,‣Add more sample to the ZnSe crystal, or‣Grind the sample to a finer consistency.
Slide 17Example <strong>of</strong> a Spectrum run with Insufficient Sampleor Insufficient Contact with ZnSe CrystalNote verysmall %Tvaluesand noisybaseline
Slide 18aOnce a suitable spectrum has been obtained,the sample should be removed from thecrystal with a KimWipe moistened with anappropriate solvent.Discard the sample and KimWipe in theappropriate containers.
Slide 18Discardsample andKimWipe intheappropriatecontainers.Removesample withKimWipemoistenedwith anappropriatesolvent.
Slide 19aFrequently experimental IR spectra arecompared to literature or standard spectra toevaluate the purity and identity <strong>of</strong> the sample.These spectra <strong>of</strong>ten were run with a supportmaterial added for the purpose <strong>of</strong> obtaining ahigh quality spectrum before the use <strong>of</strong> HATRattachments.
Slide 19IR Spectrum<strong>of</strong>Acetaniliderun in NujolSupport
Slide 20aWhen making comparisons to a standardspectrum, it is essential to note carefully theconditions under which the spectrum was run,since some support materials may also absorbIR radiation.The support substances may thereforecontribute peaks to the sample spectrum.The IR spectrum <strong>of</strong> a pure support material,Nujol, is shown here.
Slide 20IRSpectrum<strong>of</strong> pureNujolsupportmaterial
Slide 21aThe peaks due to the support material in thestandard spectrum must be identified and“eliminated” from the spectrum in order tomake the proper comparison <strong>of</strong> the spectrumto the HATR spectrum which does not containpeaks from the support material.
Slide 21NUJOL Spectrum (shaded)Overlayed on Acetanilide in NUJOL Spectrum
Slide 22aThis module has dealt specifically withutilizing an HATR attachment to run spectra <strong>of</strong>crystalline solids.IR spectra <strong>of</strong> other types <strong>of</strong> samples can alsobe obtained with this attachment, but thesample handling techniques will vary, as willany cautions to be observed in theinterpretation <strong>of</strong> the resulting experimentalspectra.
Slide 22