Bells Canyon - Utah Geological Survey
Bells Canyon - Utah Geological Survey
Bells Canyon - Utah Geological Survey

You also want an ePaper? Increase the reach of your titles
YUMPU automatically turns print PDFs into web optimized ePapers that Google loves.
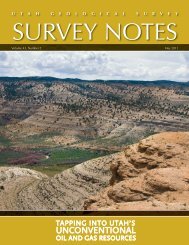
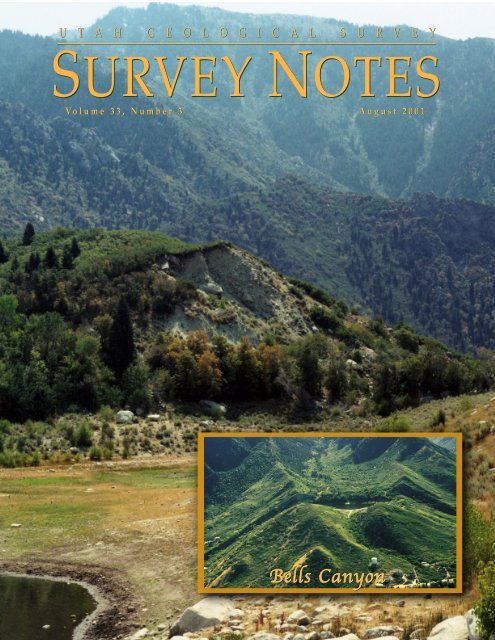
U T A H G E O L O G I C A L S U R V E YSURVEY NOTESVolume 33, Number 3 August 2001<strong>Bells</strong> <strong>Canyon</strong>
TABLE OF CONTENTSNew mapping of earthquake hazardsalong the Wasatch fault . . . . . . . . . . 1Geocaching . . . . . . . . . . . . . . . . . . . . . . 4Investigating seismic hazards of theHurricane fault . . . . . . . . . . . . . . . . . 5Energy news: Geothermal resources . .7Magna Earthquake . . . . . . . . . . . . . . . . 8Teacher’s Corner: Celebrate EarthScience Week . . . . . . . . . . . . . . . . . . 9Glad You Asked: sand, gravel, rock . .10GeoSights: Paul Bunyuns Woodpile . .11Web Highlights . . . . . . . . . . . . . . . . . . 12<strong>Survey</strong> News . . . . . . . . . . . . . . . . . . . 13New Publications . . . . . . . . . . . . . . . . 13Design by Vicky ClarkeCover: View to the southeast of the main scarpof the Wasatch fault at <strong>Bells</strong> <strong>Canyon</strong> in southeasternSalt Lake Valley (inset: view from theair of the Wasatch fault zone traversing glacialmoraine at <strong>Bells</strong> <strong>Canyon</strong>).State of <strong>Utah</strong>Michael O. Leavitt, GovernorDepartment of Natural ResourcesKathleen Clarke, Executive DirectorUGS BoardRobert Robison, ChairGeoff BedellCraig NelsonE.H. Deedee O’Brien Charles SemborskiSteve ChurchRon BruhnStephen Boyden (Trust Lands Administration-ex officio)UGS StaffAdministrationRichard G. Allis, DirectorKimm Harty, Deputy DirectorJohn Kingsley, Assoc. DirectorDaniel Kelly, Acct. Officervacant, Secretary/ReceptionistCheryl Ostlund, Admin. SecretaryLinda Bennett, Accounting Tech.Michael Hylland, Tech. Reviewer<strong>Survey</strong> Notes StaffEditor: Jim StringfellowEditorial Staff: Vicky Clarke, Sharon HamreCartographers: Patricia Speranza,James Parker, Lori DouglasGeologic Hazards Gary ChristensonWilliam Lund, Barry Solomon,Francis Ashland, Richard Giraud,Greg McDonald, Neil StoreyEnergy and Mineral Resources David TabetRobert Gloyn, Robert Blackett, Roger Bon,Thomas Chidsey, Bryce T. Tripp, Craig Morgan,J. Wallace Gwynn, Jeff Quick, Kevin McClure,Sharon Wakefield, Carolyn Olsen, CherylGustin, Tom Dempster, Mike Kirschbaum,Brigitte HuckaGeologic Mapping Grant WillisHellmut Doelling, Jon King, Bob Biek,Kent Brown, Michael Wright,Basia Matyjasik, Douglas SprinkelGeologic Information and OutreachSandra Eldredge, William CaseChristine Wilkerson, Mage Yonetani,Patricia Stokes, Mark Milligan, Carl Ege,Rob Nielson, Jo Lynn Campbell, Brian MartinEnvironmental Sciences Michael LoweDavid Madsen, James Kirkland, Charles Bishop,Martha Hayden, Janae Wallace, Hugh Hurlow,Alison Corey, Kim Nay, Dave Schmitt,John AlexanderSeveral articles in this isssue of<strong>Survey</strong> Notes discuss earthquakehazards along the Intermountainseismic belt through <strong>Utah</strong>. Estimatesfrom cumulative geologic slip ratesalong the major faults of the easternboundary of the Basin and Range suggesteast-west extension at a longtermrate of several millimeters peryear (mm/yr). Monitoring confirms atleast this rate of movement during the1990s (compare this rate with tenthsof mm/yr in the central Basin andRange, or with tens of mm/yr alongthe plate boundary in California).<strong>Utah</strong> experiences a magnitude 7earthquake once every several hundredyears, and a magnitude 5.5 orlarger earthquake on average onceevery 10 years. Economic loss estimatesfor a magnitude 7 earthquakein Salt Lake County are in the rangeof billions to more than 10 billion dollars.These figures should be wellknownto the <strong>Utah</strong> earth science community,but the implications for disasterpreparedness of the wider communityare not well recognized. Howmany of us have actually taken precautionsin our own houses andoffices to minimize the damage of abig shake?The ongoing challenge for the UGSand other state agencies such as the<strong>Utah</strong> Division of ComprehensiveEmergency Management is to increaseawareness of the local geologic hazards,and to encourage mitigationmeasures, including recovery planningfor the inevitable occurrence ofdamaging events. Recent collaborativework by URS Corporation, UGS,TheDirector’sPerspectiveby Richard G. Allisand the University of <strong>Utah</strong> has produceda series of earthquake groundshakingmaps for the Salt Lake Valley(Ivan Wong and others, in preparationas a UGS publication). We hope thesemaps, one set of which shows thevariation in intensity of groundmotion in the event of a major earthquakeon the underlying Wasatchfault, will stimulate interest andawareness (and action!) of the potentialdamage. These maps will be publishedlater this year and will beaccessible on our web site. We arenow working on a larger, WasatchFront set of maps (Provo – Ogden,which should be available next year)for a scenario of a Wasatch faultearthquake.Recent improvements in the Universityof <strong>Utah</strong>’s strong motion seismicnetwork around the Wasatch Frontallow maps showing levels of groundshaking (called ShakeMaps) to begenerated within minutes of an earthquake.The enhanced network had itsfirst test in July with a magnitude 3.4earthquake beneath northwest SaltLake City (see article on p. 8 abouteffects felt at the UGS office). TheShakeMap can be seen athttp://www.seis.utah.edu/shake.These maps allow emergencyresponse teams to immediately focuson the worst-affected areas. We hopethat the ShakeMaps for modern earthquakes,and the ground-shaking scenariomaps for future large events,will increase the awareness of planners,decision makers, and the generalpublic on preparing for the effects oflarge earthquakes in <strong>Utah</strong>.<strong>Survey</strong> Notes is published three times yearly by <strong>Utah</strong> <strong>Geological</strong> <strong>Survey</strong>, 1594 W. North Temple, Suite 3110, Salt Lake City, <strong>Utah</strong>84116; (801) 537-3300. The UGS is an applied scientific agency that creates, evaluates, and distributes information about <strong>Utah</strong>’sgeologic environment, resources, and hazards to promote safe, beneficial, and wise use of land. The UGS is a division of theDepartment of Natural Resources. Single copies of <strong>Survey</strong> Notes are distributed free of charge to residents within the UnitedStates and Canada and reproduction is encouraged with recognition of source.
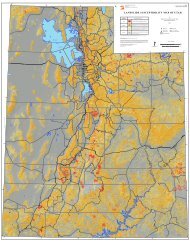
S URVEY N OTES 1New Mapping of Earthquake Hazardsalong the Wasatch Frontby Barry J. SolomonIntroductionLarge earthquakes can disrupt liveswith devastating effects on communitiesand individuals. The effects oflarge earthquakes throughout theworld draw our attention whenreported by the media, and elicitstrong emotions of fear and sympathy.But many recent earthquakesoccurred in distant and exotic locations—Turkey,India, Taiwan, and ElSalvador. These earthquakes resultedin costly tragedies, but are they reallyrelevant to residents of the WasatchFront or other parts of <strong>Utah</strong>? Shouldwe be that concerned with earthquakesafter facing anxieties related tomassive freeway reconstruction andpreparation for the upcomingOlympics? The answer to these questionsmay be more obvious once weconsider large earthquakes occurringin urban areas closer to home—SanFernando, 1971 (near Los Angeles);Loma Prieta, 1989 (near San Francisco);Northridge, 1994 (near Los Angeles);and Nisqually, 2001 (near Seattle).These earthquakes caused billions ofdollars in damage and claimed manylives. Now consider this—the FederalEmergency Management Agencyrecently released a report that ranks<strong>Utah</strong> among states that face the highestearthquake risk in the nation. Thereport, HAZUS99 Estimated AnnualizedEarthquake Losses for the United States,ranks <strong>Utah</strong> seventh in the nation forabsolute earthquake risk (the annualaverage earthquake loss) and sixth forrelative risk (the ratio of the annualaverage earthquake loss to thereplacement value of building inventory).These are sobering statistics.Although the size, timing, and locationof future earthquakes are difficultto predict, variations in soil behaviorShould we be that concerned with earthquakesafter facing anxieties related tomassive freeway reconstruction andpreparation for the upcoming Olympics?and damage during earthquakes arecontrolled largely by mappable geologicand geotechnical site conditions.The <strong>Utah</strong> <strong>Geological</strong> <strong>Survey</strong> (UGS) ispresently involved in evaluating theseconditions to assess the potential forearthquake hazards in two areasalong the seismically active WasatchFront: the central Cache Valley ofnorthern <strong>Utah</strong>, and the centralWasatch Front region.Our evaluations, partially funded bythe U.S. <strong>Geological</strong> <strong>Survey</strong> NationalEarthquake Hazards Reduction Program(NEHRP), will lead to the productionof maps of earthquake hazardssuch as amplified earthquakeground motion, surface fault rupture,liquefaction, and earthquake-inducedslope failure. Such maps are valuabletools for government officials andland-use planners to (1) guide safeand responsible development throughincorporation into a land-use plan orzoning ordinance, (2) prepare earthquake-planningscenarios and lossestimates, (3) require site-specificinvestigations, or (4) increase earthquakeawareness, education, andtraining. Geologists and engineersmay use technical information on themaps to devise plans for addressingthe hazards.The primary purpose of our studies isto map earthquake hazards in specificareas. However, our studies alsoserve as pilot projects to test GeographicInformation System (GIS)mapping techniques for use elsewherein <strong>Utah</strong>. A GIS is a computerized systemthat allows users to access andmanage varied sets of geographicallyrelated information. InformationEarthquake-hazard study locations (shaded).Active faults include several segments of theWasatch fault zone (BC-Brigham City, W-Weber, SLC-Salt Lake City, P-Provo, N-Nephi), the West Cache fault zone (WCFZ),and the East Cache fault zone (ECFZ).
2S URVEY N OTESrelated to earthquake hazardsincludes soil and rock properties aswell as earthquake and fault characteristics.Prior to the advent of GIS,manipulating this information was alaborious, error-prone process. GIStechnologies facilitate data managementand map production.Earthquake Hazards of the CentralCache ValleyIn our first project we mapped earthquakehazards in the central CacheValley of northern <strong>Utah</strong>. This areacontains <strong>Utah</strong>’s tenth-largest city(Logan) as well as the smaller communitiesof Hyde Park, Hyrum, Mendon,Newton, North Logan, Millville,Providence, Smithfield, andWellsville. Three active fault zonesnearby (the Wasatch, West Cache, andEast Cache fault zones) pose a significantthreat to the region, which wasthe site of the most damaging earthquakein <strong>Utah</strong>’s history. A magnitude5.7 earthquake occurred on August 30,1962, near Richmond, about 10 milesnorth of Logan. Over three-fourths ofthe houses in Richmond were damaged,and landslides and rock fallsblocked highways and canals. Severallarge buildings in Logan and Richmondsuffered structural damage, andthe total estimated earthquake losswas about $1 million (1962 dollars).The consequences of a similar earthquaketoday would be much moresevere given the development that hasoccurred in the intervening 39 years,resulting in increased population andproperty values.Earthquake-hazard mapping is mosteffective for hazard reduction whenconducted prior to development.Cache Valley is largely rural but experiencingrapid growth as populationexpands from urban areas. Thus, ourmapping will be available to reducethe exposure of new development toearthquake hazards in the centralCache Valley. However, earthquakehazardmapping requires the interpretationof existing geotechnical data todetermine the characteristics ofunderlying soils and their response toearthquakes. Because of the ruralDevelopment in the central Cache Valley extends westward from Logan (in the foreground) intolargely rural areas at the base of the Wellsville Mountains (in the distance).Earthquake-hazard mapping is mosteffective for hazard reduction whenconducted prior to development.nature of the central Cache Valley,geotechnical data from boreholes areclustered in population centers andare sparse elsewhere. Boreholes arealso typically drilled to shallowdepths, so the meager geotechnicaldata from deeper soils are insufficientto assess certain earthquake hazards.To supplement geotechnical data, werelied upon information derived fromabundant water wells. In contrast tothe limited depth and irregular distributionof geotechnical boreholes,water wells in the central Cache Valleyare typically deeper and are widelyand uniformly distributed. For ourstudy, we analyzed data from 182geotechnical boreholes and 1,032water wells, as well as informationfrom existing surficial-geologic maps.Although results of our study havenot yet been published by the UGS, areport was submitted to the U.S. <strong>Geological</strong><strong>Survey</strong>. A copy of the report(Seismic Hazards Mapping of the CentralCache Valley, <strong>Utah</strong>—a Digital Pilot Project,by J.P. McCalpin and B.J.Solomon) is available for inspection inthe <strong>Utah</strong> Department of NaturalResources Library. The reportincludes a discussion of analyticaltechniques, step-by-step proceduresfor GIS mapping of earthquake hazards,and hazard maps at a scale of1:24,000. Mapped earthquake hazardsinclude amplified earthquake groundmotion, surface fault rupture, liquefaction,and earthquake-induced slopefailure. The hazard maps, most developedfrom recently published mathematicalrelationships between characteristicsof geologic materials andtheir observed association with historicalearthquakes worldwide, show therelative degree of hazard.Although the potential for each hazardis largely independent of the others,certain areas of the central CacheValley are at greater risk from combinationsof earthquake hazards. Thegreatest hazard is generally in the centerof the valley where relatively thickclay, deposited by Lake Bonnevillebetween about 14,000 and 24,000years ago, is locally overlain by morerecent saturated, sandy alluvium. Theclay contributes to greater amplificationof certain types of earthquakeground motions, whereas the alluviumcontributes to a higher potentialfor liquefaction and liquefactioninducedlateral spreading. Much ofthe remainder of the valley floor andthe mountains bordering the valleyare subject to low and moderateearthquake hazards, although moresevere hazards exist locally. Most
S URVEY N OTES 3Contorted beds are possible evidence of prehistoric liquefaction in Lake Bonneville deltaic sandsnear the mouth of Green <strong>Canyon</strong>, North Logan.. . . as development proceeds into currentlyundeveloped areas, extending from bothvalley margins into the center of the valleyand into the mountains, exposure toearthquake hazards will increase.development in the central Cache Valleyis along the valley margins, whichhave generally lower earthquake-hazardpotentials. However, as developmentproceeds into currently undevelopedareas, extending from both valleymargins into the center of the valleyand into the mountains, exposureto earthquake hazards will increase.An Earthquake Scenario for the SaltLake City segment, Wasatch FaultZoneOur hazard maps of the central CacheValley reflect the response of susceptiblegeologic materials to earthquakesin the region, regardless of the earthquakesource. Another technique formapping earthquake hazards, however,reflects the risk posed by a specificearthquake. This type of analysisbegins with defining the size andlocation of the earthquake (the scenarioearthquake), calculating its associatedground motions, and mappingthe geologic effects such as grounddeformations due to ground failure(for example, liquefaction and landsliding).The resultant earthquakehazardmaps showing geologic effectscan then be used to generate an estimateof the consequences to a regionof the scenario earthquake. The estimatewill describe the scale and extentof damage and disruption, includingquantitative estimates of casualtiesand costs for repair and replacementof damaged buildings and facilities,losses of function for critical facilities,and the extent of induced hazardssuch as fire, flood, or contaminationby hazardous materials. A similarestimate at a national scale was preparedfor the HAZUS99 report citedabove.In our second project, we are mappinggeologic effects of a scenario earthquakein the populous region of thecentral Wasatch Front, centered uponthe Salt Lake City metropolitan area.This region lies astride the Wasatchfault zone, one of the longest andmost active normal-slip faults in theworld. The fault zone is divided intoten segments, each capable of generatingstrong earthquakes. The Salt LakeCity segment is one of the more activesegments, having generated four surface-faultingearthquakes in the past6,000 years. These earthquakes haveoccurred on average every 1,350years; the most recent one occurredbetween about 1,100 and 1,550 yearsago. Geologic studies indicate thatTHE UGS RESPONSE TO AMAJOR EARTHQUAKEWhen an earthquake occurs, emergencyresponseactivities are complex andinvolve many private and public organizations.The UGS plays a key role inthis emergency response as the lead statescientific agency responsible for understanding,documenting, and respondingto geologic hazards. These activities willbe most effective with advance planning.To that end, the UGS has prepared the<strong>Utah</strong> <strong>Geological</strong> <strong>Survey</strong> Earthquake-Response Plan and Investigation FieldGuide to direct the UGS response to significantearthquakes in <strong>Utah</strong>. This documentupdates our previous plan andincorporates lessons learned from recentsignificant earthquakes elsewhere.The plan defines criteria for selection ofearthquakes to be investigated, delineatesroles of UGS personnel duringresponse, and outlines investigationobjectives and procedures. The plan isdesigned to facilitate the role assigned tostate geological surveys specified in theprogram of post-earthquake investigationsconducted under the auspices ofthe National Earthquake Hazard ReductionsReauthorization Act of November16, 1990.The plan recognizes the critical need fordocumenting geologic effects of earthquakes,and for advising public officialsmanaging response and recovery.Lessons learned can be incorporated intostandards and practices for future hazardreduction. Providing a timelyforum for information exchange amonggeoscientists and engineers is a key elementof this plan, which includes provisionsfor a “post-earthquake informationclearinghouse” with nightly meetingsduring the response period to help coordinateinformation gathering and availability.the magnitude of a surface-faultingearthquake on the Salt Lake City segmentis 7, the size of our scenarioearthquake. An earthquake of thissize centered in the Salt Lake Cityarea would place more than 1.3 millionpeople at risk, with preliminaryestimates of human fatalities of 7,600and damages of about $12 billion.Significant effects of our scenario
4earthquake may be felt within a largearea of northern <strong>Utah</strong>, extendingnorth-south from Ogden to Provo andeast-west from Park City to Tooele.Because of this large area, we willmap earthquake hazards at a scale of1:250,000. Mapped hazards willinclude those mapped for the centralCache Valley, and will be based onsimilar relationships between thenature of geologic materials and theirhistorical response to earthquakeselsewhere. We will also incorporatethe results of previous studies of othergeologic hazards to ensure comprehensiveconsideration of the effects ofimportant hazards in the loss estimation.These other hazards include tectonicsubsidence (tilting of the valleyfloor toward the surface fault rupture),flooding due to dam failure,and flooding due to a seiche (anearthquake ground-shaking-generatedwave causing a sudden rise in waterlevel) in Great Salt Lake.Hazard Maps and Risk ReductionMapping earthquake hazards is aninteresting geological exercise, but themaps have very practical applications.Earthquake-hazard maps focus ourattention on important issues regardingearthquake risk reduction.Earthquake hazards along theWasatch Front are relatively greatbecause of the presence of theWasatch fault zone and other activefaults in the region. However, the distributionof earthquake hazards is notuniform. For example, saturatedflood plains along valley bottoms maypose a high liquefaction hazard but alow hazard for slope failure. Landslidespose a greater hazard on steepvalley and mountain slopes, wherethe potential for liquefaction may benegligible. Earthquake-hazard mapsillustrate the distribution of hazardsbased upon the physical characteristicsof geologic materials.Earthquake risks along the WasatchFront are relatively high because ofthe level of development within seismicallyactive, high-hazard areas.However, the level and age of developmentare also not uniform. Earthquakerisk is greatest where developmentconcentrated in seismically hazardousareas is old and prone toS URVEY N OTESearthquake damage. By mappingearthquake hazards along the WasatchFront in a Geographic InformationSystem, the UGS provides a mechanismfor estimating earthquake risk.This can be analyzed in a GIS by overlayinggeologic-hazard map layerswith relevant building and infrastructureinformation, such as transportationroutes, utilities, and the locationof critical facilities. Analyses can thenbe used to make informed decisionson hazard-reduction and emergencyresponsepolicies, priorities, strategies,and funding levels. Rehabilitatingolder buildings in hazardous areasand applying appropriate seismiccodes to the design and constructionof new buildings can reduce earthquakelosses. Effective planning foremergency response can directresources toward communities mostsubject to risk. The earthquake-hazardmaps show the relative hazard tohelp us prepare for earthquakes priorto their occurrence, rapidly and effectivelyrespond once an earthquakehappens, and improve our understandingof our interaction with thegeologic environment.Geocaching - Treasure hunting with a high-tech twistby Mark MilliganTired of hunting for lost Spanishmines in the Uinta Mountains andfinding nothing but sore feet? Fed upwith panning for gold in the WestDesert and discovering nothing butsand? Ready to give up that metaldetector and your prized pile of rustedtin cans and nails it took you threeweekends under the hot sun touncover? Geocaching may be foryou! New technology has inspired anew breed of weekend treasurehunters - adventurers armed with aGlobal Positioning System (GPS)receiver.Like a scavenger hunt, geocachingentails looking for a cache of hidden“treasure” using a GPS receiver and aprovided set of coordinates. Othergeocachers place all sorts of goodiesin a coffee can, ammunition can, orsimilar container and hide it. Theperson hiding the cache records thesite’s latitude and longitude, thenposts the coordinates on the Internet.Geocaching is a fun way to get outwhile learning and using navigationskills.The Geologic Information and OutreachProgram’s geocacheIn celebration of national Earth ScienceWeek (October 8 - 12) the GeologicInformation and Outreach (GIO)Program will hide a geocache onMonday, October 8. Like others onthe Internet, our geocache has twosimple rules: (1) if you take an item,then you must leave something in itsplace; and (2) record your visit in thecache’s log book. Often caches have atheme. Our theme is minerals androcks (of course) and that is just whatyou will find in the coffee can thatcontains our cache. Not just drivewaygravel, but fun and interestingspecimens (real keepers!). The coordinatesfor our geocache are: N 40°46’ 38.0” and W 111° 56’ 01.2”. (Hint:we did not venture more than a fewblocks from our office.) So jump onthe geocache band wagon and findsome treasure.For other caches and more informationon geocaching, including adviceon setting up your own cache, enterthe key word “geocache” in yourfavorite Internet search engine.
S URVEY N OTES 5Investigating Past Earthquakeson the Hurricane Faultby William R. LundINTRODUCTIONThe <strong>Utah</strong> <strong>Geological</strong> <strong>Survey</strong> (UGS)and the Arizona <strong>Geological</strong> <strong>Survey</strong>are cooperators on a study of the Hurricanefault, one of the longest andmost active of several large, geologicallyyoung faults in southwestern<strong>Utah</strong> and northwestern Arizona. In<strong>Utah</strong>, the Hurricane fault trendsnorth, dips west, and displaces thenearly flat-lying rocks of the ColoradoPlateau down-to-the-west. The purposeof the study is to evaluate theHurricane fault’s potential for producingfuture large earthquakes.Extending from Cedar City, <strong>Utah</strong>, tosouth of the Grand <strong>Canyon</strong>, the 160-mile-long Hurricane fault has producedthousands of feet of verticaldisplacement over the past approximatelyfive million years. In morerecent geologic time, the fault has displacedmiddle Quaternary (600,000 to1,000,000 year old) basalt flows severalhundred to more than a thousandfeet and late Quaternary (
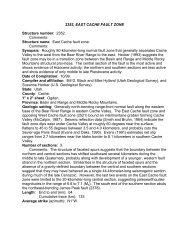
6show that the surface faulting at Coyote Gulch did notextend north to the Middleton site, indicating the likelypresence of a previously unrecognized rupture segmentboundary between the two sites. Based on the geometryof the fault, we believe the boundary is at a pronouncedright bend in the fault just north of Coyote Gulch. Wehave named the proposed new northern segment theCedar City segment.Developing Long-Term Fault-Slip Data from DisplacedBasalt FlowsFault slip rates (net fault displacement divided by time)allow us to study the behavior of faults over several earthquakecycles. The higher the slip rate, the more active andpotentially hazardous is the fault. Where it is possible todetermine slip rates for a variety of time intervals, we canevaluate changes in the fault’s behavior through time.Knowing if a fault is slowing down or speeding up isimportant when evaluating earthquake hazards. The Hurricanefault provides a rare opportunity to develop longtermslip rates from displaced basalt flows along its length.We used detailed geochemical data to correlate the displacedflows, and paleomagnetic data and new geologicmapping to evaluate the extent of near-fault deformationadjacent to the fault. We then calculated the net slip acrossthe fault, and dated the correlated basalts to determine thetime period over which the slip occurred.We identified four locations in <strong>Utah</strong> where displacedbasalts can be correlated across the Hurricane fault (seetable below). We also identified a fifth site east of CedarCity in Cedar <strong>Canyon</strong> where a basalt flow occupies theancestral channel of Coal Creek high on the north wall ofthe canyon. When the basalt flowed down the channel ofCoal Creek, it forced the stream to find a new path. CoalCreek has since re-established its channel and left thebasalt stranded high above the present stream. BecauseCoal Creek is graded to Cedar Valley and crosses the Hurricanefault at the mouth of Cedar <strong>Canyon</strong>, movement onthe fault controls the base level of the stream and thestream incision rate. Therefore, the rate of stream incisionis a proxy for slip on the fault. The following table showsthe net slip across the fault at each of the five basalt locations,the ages of the correlated basalts, and the resultingslip rate.Location Net Slip Basalt Age Slip Rate(meters) (million years) (mm/yr)Grass Valley 440 1.0 0.44Pah Tempe 73 0.353 0.21S. Black Ridge 368 0.81 0.45N. Black Ridge 476 0.86 0.55Cedar <strong>Canyon</strong> 335 0.63 0.53Long-term slip rates developed from displaced Quaternarybasalt flows in <strong>Utah</strong>.S URVEY N OTESLooking southeast at the Shurtz Creek fault scarp where theUGS attempted to trench the Hurricane fault. The scarp isabout 40 feet high.The Hurricane Cliffs looking northwest from near the <strong>Utah</strong>/Arizonaborder. The Hurricane fault is at the base of the cliffs; stratigraphicdisplacement across the fault is more than 2,000 feet.The table and figure show that slip on the Hurricane faultincreases from south to north. Additionally, although thedata are sparse, slip rates appear to increase incrementallyacross a suspected segment boundary at South BlackRidge, lending credence to the idea that a seismogenicboundary exists at that location. Although little change inlong-term slip rate is apparent north of South Black Ridge,slip rates determined for segmented faults elsewhere inthe western United States indicate that a seismogenicboundary could still be present between the proposed AshCreek and Cedar City segments.STUDY CONCLUSIONSResults of this study show that the Hurricane fault in <strong>Utah</strong>likely consists of three rupture segments, rather than twoas previously thought. The newly proposed segment atthe north end of the fault has been named the Cedar Citysegment. Of the three segments, the Cedar City segmenthas gone the longest without a surface-faulting earthquake.The single slip rate available for the new CedarCity segment closely approaches that of the Ash Creeksegment to the south, which has had a surface-faultingearthquake in recent geologic time. Therefore, given itshigh long-term record of activity and because it has gonethe longest without a surface-faulting earthquake, theCedar City segment is considered the most likely locationfor a large earthquake on the Hurricane fault in <strong>Utah</strong>.
S URVEY N OTES 7Energy NewsGEOTHERMAL RESOURCES OF UTAH-2001A Digital Atlas for <strong>Utah</strong>’s Geothermal Resourcesby Robert E. Blackett and Sharon I. WakefieldIn response to increasing interest innational renewable energy sources,the <strong>Utah</strong> <strong>Geological</strong> <strong>Survey</strong> (UGS), incooperation with the <strong>Utah</strong> EnergyOffice, is completing work on a new,interactive, digital publication basedupon geographic information system(GIS) technology. Geothermal Resourcesof <strong>Utah</strong>-2001, which will be publishedon compact disk (CD), contains datafrom publicly available reports anddata sets available through 2000. TheCD contains technical information forscientists and engineers, but its interactive,menu-driven reports, tables,and maps make it suitable for generalpublic use.The CD replaces a geothermalresource map of the state of <strong>Utah</strong> producedas part of a U.S. Department ofEnergy/UGS cooperative geothermalprogram in the late 1970s. Publishedin 1980, the Geothermal Resources of<strong>Utah</strong> map presented geothermal andwater-resource data at a scale of1:500,000. Although the informationpresented on the map was of a generalnature, it showed locations of thermalwells and springs and listed individualsource temperatures, waterqualitydata, and flow rates. The mapalso outlined areas of prospectivevalue for geothermal resources, andprovided descriptive informationabout individual geothermal areas. Itwas published through the U.S.National Oceanic and AtmosphericAdministration and is now out ofprint.The 1980 map needs replacingbecause it is out of date and availableonly in a few libraries, at a time wheninterest in renewable energy resourcesand technology is increasing. Sincepublication of the 1980 map, variousworkers completed a number of geothermal-relatedstudies, the result offederal, state, and privately fundedresearch. In addition to regional andstatewide resource assessments, thestudies also involve detailed analysesof individual geothermal areas. Inclusionof the data from these studiesmakes the new CD superior to the1980 map.The CD will contain (1) Adobe Acrobat®portable document format (PDF)documents describing geothermalresources of <strong>Utah</strong> and specific geothermalareas; (2) digital PDF maps of<strong>Utah</strong> and individual geothermalareas; (3) a 3,000-record database ofthermal wells and springs; (4) geothermal,geologic, geographic, cultural,and infrastructure-related spatialdata (ArcView®) files; (5) documentationand description of data sourcesand accuracy (metadata); (6) imagefiles; and (7) software (ArcExplorer®)to construct and view various GISthemes, maps, images, and reports.Readers of <strong>Survey</strong> Notes may refer tothe article and map in vol. 32, no. 3 tonote some of the complexity.The PDF documents, spatial data,metadata, image files, and softwareare organized into six subfolders:Docs: PDF documents containingreports on geothermal resourcesand heat flow in <strong>Utah</strong>, data tablesof thermal wells and springs, acomprehensive geothermal bibliographyof <strong>Utah</strong>, and user guidesfor the CD and the freeware.Geoth_db: A database containing nearly3,000 records of thermal wellsand springs in <strong>Utah</strong>.Images: GIS-generated geothermalmaps of <strong>Utah</strong> (PDF) and photos of<strong>Utah</strong> geothermal sites.Menu: Applications for driving theCD-ROM menu system.Shapes: Spatial data layers (asArcView® shapefiles) containingbase maps and infrastructuredata, as well as updated geothermalwell and spring data andheat-flow data for <strong>Utah</strong>. Metadatafiles that document the GIS layersare also included.Software: ArcExplorer® and AdobeAcrobat® Reader freeware. Arc-Explorer® enables users toretrieve and manipulate a varietyof maps using the ArcView®shapefiles. Adobe Acrobat®Reader allows users to view PDFdocuments.With the documents, databases, andsoftware on the CD, users will be ableto create individual GIS maps at varyingscales containing any number ofdata layers. Data layers could includegeothermal resources, land use, cultural,demographic, land grid, geologic,geographic, infrastructure, andother information as needed. GISusers can also import new or updateddata layers from the <strong>Utah</strong> AutomatedGeographical Reference Center website(http://agrc.its.state.ut.us/) andelsewhere.The Geothermal Resources of <strong>Utah</strong>-2001 CD is scheduled for publicationnear the end of 2001 and will be availablethrough the <strong>Utah</strong> Department ofNatural Resources Bookstore.
8S URVEY N OTESDNR Gets a Shakingfrom July’s Magna Earthquakeby Jo Lynn Campbell, Michael D. Hylland, and Gary E. ChristensonAt about 7:56 a.m. MDT on Sunday,July 8, the northwestern part of theSalt Lake Valley was shaken by amagnitude 3.4 earthquake. The epicenterwas 2.7 miles north-northeastof Magna and about 7.5 miles west ofthe Department of Natural Resources(DNR) building. No significant damagewas reported in the area; however,despite the small magnitude, theearthquake had things moving andshaking at DNR.UGS employee Bill Case was workingin his office, on the third floor, whenthe earthquake occurred. He said, “Ifelt a small jolt in my office and anunfamiliar noise at about 7:56 a.m. Itwas followed a few seconds later by astronger jolt, like a truck hitting thebuilding.” When Brian Martin reportedfor work in the DNR Bookstore onMonday morning, he saw that publicationswere strewn all over as aresult of the previous morning’searthquake. (Ironically, most of thepublications were from the GeologicHazards display.)The earthquake was an early test ofthe new strong-motion monitoringnetwork being installed along theWasatch Front by the University of<strong>Utah</strong> Seismograph Stations usingfunding from the U.S. <strong>Geological</strong> <strong>Survey</strong>.One of the aims of the new “realtime”network is to generate automatically,within minutes after an earthquake,computer maps showingground-shaking levels (ShakeMaps)that can be used particularly by emergencyresponders to determine wheredamages and injuries are likely to begreatest. (The new system will not befully automated before this fall, so theShakeMaps for the Magna earthquakewere created manually a few hoursafter the earthquake.) The “intensity”ShakeMap for the small Magna quakeshows that the maximum expectedintensity was classified as “light,” cor-Continued on next page....
S URVEY N OTES 9GEOLOGYTeacher’s CornerCelebrate Earth Science WeekOctober 7-13, 2001During the second week of October,<strong>Utah</strong> will join other states across thenation in celebrating the fourth annualEarth Science Week. Initiated in1998 by the American <strong>Geological</strong>Institute, the focus of the week’s activitiesis to help people understand theimportance of the earth sciences intheir lives.Proclamations signed by governors ofmany states, including <strong>Utah</strong>, recognizethat geology and the earth sciencesare fundamental to society andto our quality of life. A commonthread in the proclamations is that anunderstanding of geology and theearth sciences can help citizens makewise decisions for land managementand use, is crucial to addressing environmentaland ecological issues, andprovides the basis for preparing forand mitigating natural hazards.To encourage our young people tolearn more about the earth and environmentalsciences and to considerpursuing careers in these fields, theUGS will offer activities and demonstrationsat the <strong>Utah</strong> Core ResearchCenter during the week. Schoolgroups and others will be able tospend 1 1 /2 hours learning aboutrocks, minerals, and dinosaurs.Included in the sessions are hands-onactivities to investigate rock and mineralproperties, gold panning, andwatching how fossils are excavatedfor study. Participants will take hometheir own treasures of rock and mineralspecimens, as well as a plaster castof a fossil.<strong>Utah</strong> Core Research Center240 North Redwood RoadSalt Lake CityOctober 9 - 12 (Tuesday - Friday)8:00 a.m. - 5:00 p.m.To reserve a time, please call CarolynOlsen at 537-3359.....continued fom previous pageresponding to an instrumental intensityof IV. A companion ShakeMap (notshown) for technical users indicatesthat the earthquake produced nondamagingpeak ground accelerations(a measure of the strength of shakingat the ground surface, expressed as apercentage of gravitational acceleration,g) in the range of 0.04 g.<strong>Utah</strong> seems to be having its share ofsmall earthquakes lately, raisingawareness of earthquake dangers inthe state. Information on earthquakes,as well as other geologic hazards,can be obtained from the NaturalResources Map & Bookstore, 1594West North Temple, Salt Lake City(www.maps.state.ut.us; 801-537-3320),or by calling the <strong>Utah</strong> <strong>Geological</strong> <strong>Survey</strong>at 801-537-3300. Information onspecific earthquakes and the newShakeMap system can be obtainedfrom the University of <strong>Utah</strong> SeismographStations (www.quake.utah.edu;801-581-6274).
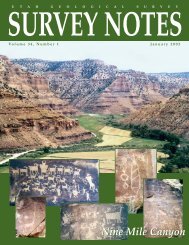
10S URVEY N OTES?????“Glad You Asked”by William F. CaseWhy is the Wasatch Front “blessed” with the abundant sand, gravel,and rock that were so useful for the “Olympian” Interstate 15 project?The <strong>Utah</strong> Department of Transportation’s May, 2001 publication,Interstate 15 User Guide On the Road Again Map, reportsthat 7 million cubic yards of sand and gravel fill and 2.5 millionsquare yards of concrete using crushed rock aggregatewere used in the reconstruction of Interstate 15 through theSalt Lake Valley. Most of this material came from localWasatch Front sources.Why is the Wasatch Front blessed with so much sand, gravel,and rock so close to construction sites? In a word, it’s becauseof <strong>Utah</strong>’s geology!The abundance of these resources along the Wasatch Front is aresult of up to a billion years of geological processes including(1) deposition of limestone and sandstone in shallow oceans,(2) uplift of mountain ranges, (3) fracturing and erosion ofrock, and (4) transport and deposition of sand and gravel bystreams, debris flows, glaciers, and lake processes.Most of the sandstone and limestone was deposited on beachesand in lagoons of oceans that lapped back and forth acrosswhat is now the Wasatch Front, one billion to 160 millionyears ago. These rocks are now exposed by the uplift of theWasatch Range along the Wasatch fault. In approximately 15million years the Wasatch Range moved up at least 1 mile (1.5km), relative to the down-dropping of the Salt Lake Valley.Continued weathering and erosion of the mountains graduallyturns big rocks into little ones (sand and gravel). The sandand gravel was transported to the canyon mouths by streams,glaciers, and debris flows.Basins in western <strong>Utah</strong> were once occupied by Lake Bonneville,an Ice Age lake as large as Lake Michigan. It beganfilling about 25,000 years ago when the climate became cooland wet. Snow and glacial ice accumulated in the WasatchRange, reaching a maximum about 19,000 years ago. Glacialice flowed down-valley as far as the mouth of Little Cottonwood<strong>Canyon</strong> during this maximum. Lake Bonneville rose toits highest elevation about 15,000 years ago and then overflowedinto the Snake River drainage in Idaho; the lake leveldropped over 300 feet (100 m) within a few months and thenstayed at this elevation for at least 500 years. The climatebecame warmer and drier and Lake Bonneville evaporatedleaving small lakes, including Great Salt Lake.Vigorous canyon streams carrying large amounts of sand andSand and gravel pit at the mouth of Big Cottonwood <strong>Canyon</strong>, Salt LakeCounty. (photo 1991)sand & gravel beachesView south showing gravel deposits, Traverse Range and Point of theMountain, Salt Lake County.gravel deposited deltas where they flowed into Lake Bonneville.Currents and waves of Lake Bonneville redepositedthe sand and gravel along the shoreline as beaches that makeup the familiar “bathtub rings” around the Wasatch Front.Occasionally, if the lake’s shoreline currents were strong andcarried a lot of sand and gravel, they would deposit a baracross a narrow gap in a valley; the Point of the Mountain atthe south end of the Salt Lake Valley is such a bar.The deltas, beaches, and bars deposited when Lake Bonnevillewas at the same elevation for 500 years or so are particularlylarge. Not surprisingly, these are where most of the sand andgravel pits are located. Mother Nature has indeed blessed theWasatch Front with extensive sand and gravel deposits to usefor construction and growth.
S URVEY N OTES 11GeoSightsby Carl EgePaul Bunyans Woodpile, Juab County, <strong>Utah</strong>Geologic information: Born from volcanicactivity approximately 30 millionyears ago, Paul Bunyans Woodpileis a unique geologic feature inJuab County, central <strong>Utah</strong>. Lookinglike a series of colossal woodpilesstacked up neatly by a giant (in thiscase Paul Bunyan), this site is a relicof <strong>Utah</strong>’s volcanic past. A volcano,similar to the large composite or stratovolcanosof the modern CascadeRange in the Pacific Northwest, wasactive in the vicinity of Paul BunyansWoodpile. This volcano became inactiveand later collapsed, forming acaldera or a large hole approximately8.5 miles in diameter and more than3,000 feet deep. After a brief period ofdormancy, the volcano became activewithin the caldera for a brief period oftime. Recent work conducted byBrigham Young University indicatesthat the Woodpile may be a series ofnumerous dikes, probably the resultof this later volcanic activity. Dikesare composed of an igneous rock andare oriented vertically. They formwhen magma is injected into preexistingcracks or fissures and latercools under the ground surface.View of Paul Bunyans Woodpile (looking northeast)The Woodpile is a classic example ofcolumnar jointing where the rock fracturesin prismatic patterns, producingparallel columns. These columnsform when cooling magma within thedike contracts, forming cracks similarto those on the surface of a coolingcake. Once a crack forms, it continuesto grow from subsurface cooling,thereby forming longer and longercolumns. Each column at Paul BunyansWoodpile is approximately 1foot in diameter and up to 15 feet inlength. The columns are three toseven sided depending on slight variationsin how the lava cooled. Thesecolumns are oriented horizontally andgive the appearance of having beentilted on their sides. Normally,columnar jointing is associated withlava flows, and the joints are orientedvertically. However, the horizontalorientation here appears to be theresult of subsurface cooling from thesides inward to the middle of thedikes.The Woodpile is also home to an arch.This arch was created by a processknown as frost action, which involvesexpansion and contraction associatedwith repeated cycles of freezing andthawing. In this process, water enterscracks in the rock and freezes; theexpanding ice creates separationalong the cracks. Eventually the rockwill break off, creating holes in a rockoutcrop. The estimated span of thearch is 20 feet long by 4 feet high.This arch can be seen by hiking fartherup the trail and viewing theWoodpile from the side.How to get there: From Salt LakeCity, travel south on I-15 to Santaquin(exit 248). Turn right (west) at the endof the off ramp onto U.S. Route 6.Travel west and then south on U.S.Route 6 for 35.7 miles to a sign indicatingPaul Bunyans Woodpileturnoff. Turn left (east) and proceedup the road for 3.2 miles to the trailhead to the Woodpile. This stretch ofroad can be quite rough so proceedwith caution. Do not attempt whenthe road is wet. Once at the trailhead, proceed through the gate andhike approximately 0.5 miles to theWoodpile. Make sure you close thegate after you. The trail is wellmarked and a relatively easy hike.Bring plenty of water and sunscreen.Useful maps: Lynndyl 1:100,000-scaletopographic map, Tintic Mountain1:24,000-scale topographic map, and a<strong>Utah</strong> highway map. Topographicmaps can be obtained from the NaturalResources Map & Bookstore, 1594West North Temple, Salt Lake City,UT, (801) 537-3320.
12S URVEY N OTESWeb HighlightsWhat to visit on our web sitewww.ugs.state.ut.usby Christine WilkersonThe <strong>Utah</strong> <strong>Geological</strong> <strong>Survey</strong>’s website consists of hundreds of pages ofcontent. So unless you’re looking forsomething specific, how do you knowwhat not to miss while visiting oursite. Let me introduce you to some ofour more visually interesting andinformative pages (in other words,those pages that contain numerousgraphics and that both non-geologistsand geologists can enjoy).Great Salt Lake: One of our mostpopular hard-copy brochures, CommonlyAsked Questions About <strong>Utah</strong>'sGreat Salt Lake and Ancient LakeBonneville, is also online. This onlinebrochure can answer the age-oldquestions, why is the Great Salt Lakesalty?, what lives in the lake?, andmore importantly what makes thelake stink? It also contains many photostaken around the lake includingthe West Desert pumping plant, thehistoric Saltair resort, the BonnevilleSalt Flats, and close-ups of oolites andbrine shrimp. What are oolites? Visitour web site and this online brochurewill tell you. (Hint: some of the mostbeautiful beaches around Great SaltLake are composed of oolitic sand.)Web address:www.maps.state.ut.us/online/pi-39/index.htmGeologic Maps: Have you everlooked at a geologic map and wonderedwhat all those colors, lines, andsymbols meant? (No, not all thosedark lines are new roads.) Here isyour chance to discover what a geologicmap is, how to read them, howgeologists make them, and why weneed them, by clicking on our onlinebrochure, Geologic Maps - What AreYou Standing On? Web address:www.maps.state.ut.us/online/pi-66/index.htm<strong>Utah</strong> Dinosaurs: Do you want toknow more about dinosaurs thanyour five-year-old? Then our informativedinosaur fact sheets are just thething for you. These pages containinformation about the differentdinosaurs discovered in <strong>Utah</strong> andsmall graphics of what most of thedinosaurs might have looked like.With sharper teeth and a more gracefulbuild, which dinosaur rivalsTyrannosaurus rex as the suprememeat-eater of the Mesozoic age?(Hint: it’s <strong>Utah</strong>’s state fossil.) Webaddress: www.ugs.state.ut.us/utahgeo/dinofossil/index.htmLandslide Guide: Homeowners frequentlyinquire about potential geologichazards at their residence. Ouronline brochure, Homeowner's Guideto Recognizing and Reducing LandslideDamage on Their Property, willtell you what areas are generallyprone to landslides and what to lookfor at your home that might indicatelandslide movement. Web address:www.maps.state.ut.us/online/pi-58/index.htmThis online brochure answers the many questionsyou may have about Great Salt Lake.www.maps.state.ut.us/online/pi-39/index.htmWhat is a geologic map? Find out here:www.maps.state.ut.us/online/pi-66/index.htmRecognize features indicating possible landslidemovement around your home.www.maps.state.ut.us/online/pi-58/index.htmSalt Lake City Building Stones:Have you ever wondered what stoneswere used for the interior and exteriorof <strong>Utah</strong>’s Capitol and where they
S URVEY N OTES 13came from? Or what building stonescover the outside of the AmericanStores Tower and how ancient theyare? Or what unique limestone wasused for the Hansen Planetarium/OldSalt Lake City Public Library buildingand how it formed? (Hint: thinkoolites again.) Even if these questionshave never even crossed your mind<strong>Survey</strong> NewsUGS loses its “new” energy team.With the reassessment of the EnergyOffice needs, we’ll lose Tom Brill, F.R.Jahan Bani, and Glade Sowards. Ahwell, office shuffleboard strikes again.Nicole King (receptionist) resigned atthe end of July to have a baby. NeilStorey has accepted the GIS analystbefore, you can still get the answersby visiting our online brochure, BuildingStones of Downtown Salt LakeCity. Web address:www.maps.state.ut.us/online/pi-60/index.htmThese are just a few of the fascinatingpages located on the <strong>Utah</strong> <strong>Geological</strong>position for the Hazards program.John Alexander is our new paleontologist/preparatorin the Paleontologysection of the Environmental program.A senior geologist position iscurrently being advertised. We arelooking for someone with remotesensing skills as well as familiaritywith information base management<strong>Survey</strong>’s web site. Other pagesinclude issues of <strong>Survey</strong> Notes; fault,liquefaction, and radon maps; rock,mineral, and fossil collecting localities;mineral activity summaries;ongoing petroleum studies; educationalresources; <strong>Utah</strong>’s geologic history,and more. Please visit our site atwww.ugs.state.ut.us.and web technologies to enhanceaccess to this information. Theseskills will complement in-houseexpertise and will provide opportunitiesfor the UGS to seek federal fundsin this area (e.g., NASA is looking forlinkages with state geological surveysto promote applications and use oftheir satellite data.)New Publications from UGS<strong>Utah</strong> <strong>Geological</strong> <strong>Survey</strong> 2001, 6 p.,8/01, PI-73 . . . . . . . . . . . . . . . FreeThis latest brochure gives a workingintroduction to the UGS and its services.Delineation of drinking water sourceprotection zones for CoveredBridge <strong>Canyon</strong> public water supplywell, <strong>Utah</strong> County, <strong>Utah</strong>, byCharles E. Bishop, 37 p., 8/01,RI-247 . . . . . . . . . . . . . . . . . . $4.30Evaluation of potential geologicsources of nitrate contamination inground water, Cedar Valley, IronCounty, <strong>Utah</strong>, with emphasis onthe Enoch area, by Mike Lowe andJanae Wallace, 50 p., 1 pl., 1:48,000.8/01, SS-100 . . . . . . . . . . . . . $9.95<strong>Utah</strong> <strong>Geological</strong> <strong>Survey</strong> earthquakeresponseplan and investigationfield guide, by Barry J. Solomon,24 p. + 32 p. appendix, 7/01,OFR-384 . . . . . . . . . . . . . . . . $3.50Natural Resources Map & Bookstore1594 W. North TempleSalt Lake City, UT 84116Telephone: (801) 537-33201-888-UTAH MAPFax: (801) 537-3395Email: nrugs.geostore@state.ut.uswww.maps.state.ut.usShipping RatesTotal pre-tax order amount0 - $ 5.00$ 5.01 - $ 10.00$ 10.01 - $ 20.00$ 20.01 - $ 30.00$ 30.01 - $ 50.00$ 50.01 - $ 70.00$ 70.01 - $ 90.00$ 90.01 - $ 110.00Shipping*$ 2.50$ 3.50$ 4.50$ 5.50$ 6.50$ 7.50$ 8.50$10.50Add $2.00 for each additional $10.00.*Rates apply for Domestic U.S. only.QTY PUBLICATION # ITEM DESCRIPTION ITEM COST TOTALSName ____________________________________________________________________Company/Agency ___________________________________________________________Address __________________________________________________________________City __________________________________________ State ________ Zip ___________Mastercard/Visa # ________________________________ Exp. Date _________________Signature _________________________________________________________________PurchaseOrder #CheckChargeCardSubtotal<strong>Utah</strong> residentsadd 6.6% salesShipping/Handling(tube charge)TOTAL$2.00
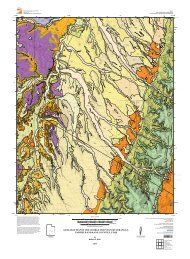
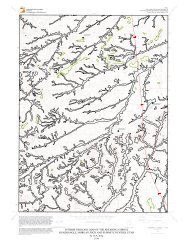
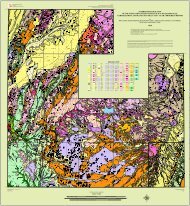
Geologic map of MoabGeologic map of the Moab and eastern part of the San RafaelDesert 30' x 60' quadrangles, Grand and Emery Counties, <strong>Utah</strong>, and Mesa County, Colorado,by Hellmut H. Doelling, 3 plates, scale 1:100,000.This full-color 42" x 25" map covers all of the south half of Grand County, home of the Paradox oil field,Arches National Park, and Deadhorse Point State Park. The mapping has taken over a decade to completeand represents a significant contribution to understanding the geology of this vast area. . . . . . . . . $36.50This map and other products are available at the Natural Resources Map & Bookstore,1594 West North Temple, Salt Lake City (www.maps.state.ut.us).<strong>Utah</strong> <strong>Geological</strong> <strong>Survey</strong>1594 W. North Temple, Suite 3110Box 146100Salt Lake City, UT 84114-6100Address service requested<strong>Survey</strong> NotesPRSRT STDU.S. PostagePAIDSalt Lake City, UTPermit No. 4728