Quantifying Social Vulnerability: A methodology for ... - EarthByte
Quantifying Social Vulnerability: A methodology for ... - EarthByte
Quantifying Social Vulnerability: A methodology for ... - EarthByte

You also want an ePaper? Increase the reach of your titles
YUMPU automatically turns print PDFs into web optimized ePapers that Google loves.
G E O S C I E N C E A U S T R A L I A<strong>Quantifying</strong> <strong>Social</strong> <strong>Vulnerability</strong>:A <strong>methodology</strong> <strong>for</strong> identifyingthose at risk to natural hazardsDwyer, A., Zoppou, C., Nielsen, O., Day, S. & Roberts, S.Record2004/14SPATIAL INFORMATION FOR THE NATION
<strong>Quantifying</strong> <strong>Social</strong> <strong>Vulnerability</strong>:A <strong>methodology</strong> <strong>for</strong> identifying thoseat risk to natural hazardsAnita Dwyer, Christopher Zoppou, Ole NielsenRisk Modelling Group, Geohazards Division,Geoscience Australia,Canberra, AustraliaSusan DayNational Centre <strong>for</strong> <strong>Social</strong> and Economic Modelling (NATSEM),University of Canberra,Canberra, AustraliaStephen RobertsDepartment of Mathematics, Mathematical Sciences Institute,The Australian National University,Canberra, Australia
Department of Industry, Tourism and ResourcesMinister <strong>for</strong> Industry, Tourism and Resources: The Hon. Ian Macfarlane, MPParliamentary Secretary: The Hon. Warren Entsch, MPSecretary: Mark PatersonGeoscience AustraliaChief Executive Officer: Neil Williamsc○Commonwealth of Australia 2004This work is copyright. Apart from any fair dealings <strong>for</strong> the purposes of study, research,criticism or review, as permitted under the Copyright Act, no part may bereproduced by any process without written permission. Inquiries should be directed tothe Communications Unit, Geoscience Australia, GPO Box 378, Canberra City, ACT,2601.ISSN: 1448-2177ISBN: 1 920871 09 8GeoCat No. 61168Bibliographic reference: Dwyer, A., Zoppou, C., Nielsen, O., Day, S., Roberts, S.,2004. <strong>Quantifying</strong> <strong>Social</strong> <strong>Vulnerability</strong>: A <strong>methodology</strong> <strong>for</strong> identifying those at riskto natural hazards. Geoscience Australia Record 2004/14Geoscience Australia has tried to make the in<strong>for</strong>mation in this product as accurate aspossible. However, it does not guarantee that the in<strong>for</strong>mation is totally accurate orcomplete. THEREFORE, YOU SHOULD NOT RELY SOLELY ON THIS INFOR-MATION WHEN MAKING A COMMERCIAL DECISION.2
ContentsContentsForewordAcknowledgmentsExecutive SummaryiiivviviiIntroduction 11 Indicator Selection 81.1 <strong>Social</strong>Indicators ............................ 81.2 <strong>Social</strong> vulnerability and indicators . . . ................ 91.2.1 Study 1: Earthquake Disaster Risk Index ........... 91.2.2 Study 2: Cities Project ..................... 121.2.3 Other vulnerability indicator studies . . . ........... 131.3 Selection Criteria . ........................... 141.3.1 Criteria . . ........................... 151.4 Selection of vulnerability indicators . . ................ 162 Risk Perception Questionnaire 182.1 Indicators and measurement ...................... 182.2 Perceptionofrisk............................ 192.3 Questionnaire development . ...................... 202.3.1 Collectionofnationaldata ................... 202.3.2 Generation of hypothetical individuals . . ........... 282.3.3 Questionnaire design ...................... 282.3.4 Respondent demographics . . . ................ 292.4 Questionnaire results .......................... 303 Decision Tree Analysis 323.1 Decision trees and social vulnerability . ................ 323.2 Perception based classification ..................... 333.3 Decisiontreeanalysis.......................... 353.4 Analysis of the risk perception questionnaire . . . ........... 353.4.1 Assigning classes of vulnerability ............... 373.4.2 Developingdecisionrules ................... 37iii
3.4.3 Therelativeimportanceofthe15indicators.......... 423.5 Decisionrulefindings.......................... 434 Synthetic Estimation 464.1 Perth Cities Project ........................... 474.1.1 StudyArea ........................... 474.2 Syntheticestimation........................... 484.3 Syntheticestimates<strong>for</strong>thePerthCasestudy.............. 504.3.1 Matching questionnaire variables ............... 504.4 <strong>Social</strong> vulnerability in the Case Study area ............... 524.4.1 Estimated social vulnerability of the study area . . . . .... 534.5 Mapping social vulnerability using hazard scenarios . . . . . ..... 544.5.1 Mapped scenarios . . ...................... 544.6 Usingtheresults ............................ 635 Discussion 665.1 Comparison with the Cities Project <strong>methodology</strong> ........... 675.2 Limitationsandfuturework ...................... 695.2.1 IndicatorSelection ....................... 695.2.2 Risk Perception Questionnaire . ................ 695.2.3 DecisionTreeAnalysis..................... 705.2.4 Syntheticestimation ...................... 705.3 Areas<strong>for</strong>refinementandfurtheranalysis................ 71A Risk Perception Questionnaire 72B Decision Tree Methodology 76C Microsimulation 81D Validation 84Bibliography 86Index 90iv
ForewordThe occurrence of natural hazards is not a phenomenon of recent times, however, understandingthe risk from natural hazards is a relatively recent trend and is currentlyincreasing at a greater rate than ever be<strong>for</strong>e. As population and infrastructure increases,social conditions fluctuate and the relationship between humans and their environmentbecomes more complex. All of these factors, and more, contribute to the wider pictureof risk, including risk from natural hazards. While natural hazards will continue tooccur, their capacity to become a disaster or merely a manageable event depends onmany factors, including the magnitude of the hazard, the vulnerability of people andtheir communities, the built environment and political systems.This report focuses on certain aspects of social vulnerability and its role in contributingto the risk from natural hazards. In particular, the study introduces a uniquemethod of measuring the vulnerability of individuals within a household in order tocontribute to the development of comprehensive natural hazard risk assessments. Theresearch undertaken <strong>for</strong> this report has been driven by two needs: firstly, to developa custom-made <strong>methodology</strong> of quantifying social vulnerability that can be incorporatedinto the risk models being developed by the Risk Research Group at GeoscienceAustralia. The Risk Research Group undertakes natural hazard research <strong>for</strong> the AustralianGovernment, with the aim of developing risk models that assist decision-makersin better managing natural hazard risk to Australian communities. Secondly, the researchoutlined in this report has been influenced by a need to integrate social issueswith hazard model development in order to investigate the greater risk to communities.Underlying this research is the need <strong>for</strong> a practical, albeit experimental, <strong>methodology</strong>of measuring elements of social vulnerability. There<strong>for</strong>e, the report is a step-by-stepaccount of the <strong>methodology</strong> development that aims to measure one aspect of socialvulnerability, the vulnerability of an individual within a household, as a means ofidentifying those at risk to natural hazards.v
AcknowledgmentsWe would like to thank Matt Hayne, Project Leader of the Risk Assessment MethodologiesProject at Geoscience Australia <strong>for</strong> his support in the development of this studyand his feedback on the report. Thanks also to Philip Buckle and John Handmer <strong>for</strong>their willingness to share their expertise, ideas and time with regards to social vulnerabilityover the past two years. Thank you also to David Robinson <strong>for</strong> his review andconstructive comments.Thank you to Dr Mihael Ankerst from The Boeing Company, Seattle, Washington<strong>for</strong> providing the the Perception Based Classification (PBC) software. And finally,thank you to all the people who completed the risk perception questionnaire.vi
Executive SummaryIn this study, a <strong>methodology</strong> is developed to assess the vulnerability of individualswithin households to risk from natural hazards. The <strong>methodology</strong> introduces a technique<strong>for</strong> measuring certain attributes of individuals living within a household thatcontribute to their vulnerability to a natural hazard impact. The <strong>methodology</strong> has fourmain steps;Step 1: Indicator SelectionAs the study is focusing specifically on measuring vulnerability, the indicators selectedhave been restricted to quantifiable indicators. Thirteen vulnerability indicatorsand two hazard indicators indicators were selected <strong>for</strong> the study. The thirteen indicatorsare: Age, Income, Gender, Employment, Residence Type, Household Type,Tenure Type, Health Insurance, House Insurance, Car Ownership, Disability, EnglishLanguage Skills and Debt/Savings. The two hazard indicators, residence damage andinjuries, were included so that the following steps in the study were linked to a hazardcontext. The indicators are specific to people living in urbanised areas within anAustralian city and were selected using selection criteria outlined in Chapter One.Step 2: Risk Perception QuestionnaireIn an attempt to identify how these indicators contribute to the vulnerability of a personwithin a household, a risk perception questionnaire was developed. The questionnairewas a means of collecting data on perceived vulnerability in lieu of the availability ofactual vulnerability data. The questionnaire respondents were asked to rank the abilityof hypothetical individuals to recover from a natural hazard impact based on their ownperceptions of the situation. The hypothetical individuals were developed using the15 indicators. The questionnaire was presented to ‘experts’ of disaster risk researchand ‘non-experts’ <strong>for</strong> comparative purposes. The questionnaire results provided 1100ranked hypothetical individuals, each with a unique set of indicator attributes.Step 3: Decision Tree AnalysisDecision tree analysis is a classification <strong>methodology</strong> used to analyse and classifylarge sets of data. In this study, decision tree analysis was applied to the questionnairedata in order to sort and classify the data to find relationships between the indicatorattributes. Based on data from the risk perception questionnaire, the decision tree analysisfound 11 decision rules that determine high vulnerability to natural hazards. Eachrule demonstrates that a combination of two or more indicator attributes are requiredvii
in order to predict the vulnerability of a person within a household, challenging the notionthat one personal attribute can determine vulnerability. The one exception is Rule1, which found that if a person suffers a life-threatening injury, they are automaticallyconsidered highly vulnerable.The attributes, referred to as vulnerability indicators, of most importance relateto various levels of; injury sustained, residence damage, house insurance, income andtype of house ownership. This finding suggests that individual and household finances,when combined with other specific indicators, play a significant role in determining anindividual’s vulnerability to a natural hazard impact.Step 4: Synthetic EstimationThe Australian Bureau of Statistics (ABS) do not release highly detailed data relatingto an individual, due to privacy laws. For example, we are permitted to know howmany people in one census district (a census district is approximately 200 householdsin size) are over 55, how many people live alone and how many people are low incomeearners. However, we are not permitted to know how many people are over 55 and livealone and earn a low income, which is referred to as cross-correlated data.As a result, synthetic estimation was undertaken <strong>for</strong> a study area of 224 censusdistrict areas in an area approximately 25 km north-east of Perth in Western Australia.In lieu of access to cross-correlated data to the real population, synthetic estimation,a technique using available data and microsimulation models, was used. Syntheticestimates of the population in the study area were developed, providing in<strong>for</strong>mation onwhich census districts contain households with people identified as ‘highly vulnerable’by the decision rules. The synthetic estimates can be mapped in order to provide auseful tool <strong>for</strong> representing aspects of social vulnerability to natural hazard impacts.Future StepsThe report demonstrates that aspects of social vulnerability can be quantified in orderto contribute to an understanding of risk to natural hazards. While experimental, the<strong>methodology</strong> outlines detailed processes that can be undertaken in order to capture andmeasure some of the complexities relating to social vulnerability.viii
IntroductionAustralia is exposed to a wide range of natural hazards, including earthquake, cyclone,landslide, flood, storm surge, severe wind, bushfire, coastal erosion, hail storm anddrought. At potential risk from these hazards are people, buildings, transport infrastructure,economies and communities, all of which are more greatly concentrated inurban centres. As one of the most urbanised nations in the world and with an everincreasing rate of urbanisation, Australia has a population that is largely concentratedwithin city areas [17]. The city, as articulated by Pelling, is ‘a focal point <strong>for</strong> a widercomplex of economic, social, political and environmental linkages and flows of power,energy and in<strong>for</strong>mation’ [58]. These complex linkages can often prove to be beneficial,such as providing greater accessibility to medical and educational services, greater developmentof social and cultural infrastructure and higher employment opportunities.While these services increase lifestyle capacity, it must also be noted that this densityof infrastructure can also increase the risk from natural hazard events. Exposure tophysical infrastructure is greater in urbanised areas, increasing the probability of injuryor death in a natural hazard impact. The reliance in urbanised areas on complexutility networks such as water, electricity and telecommunications, which are exposedin a hazard event, may also increase the overall risk.How each person will fare in the event of a natural hazard is influenced not justby exposure to infrastructure, but also by personal attributes, community support, accessto resources and governmental management. This network of factors affectingsocial vulnerability to natural hazards, combined with the complex linkages found incities and the behaviour of the hazard itself, all contribute to the development of a riskassessment.Natural Hazard Risk AssessmentsThe fields of natural hazard research, risk management and emergency managementuse similar terms which often have different meanings. Some applications of the variousterms stem from an academic or theoretical approach, while others come from apractical and managerial approach. As a result, there are many different and equallyvalid risk frameworks that have been developed. For the purpose of this report, therisk assessment framework adopted by the Risk Research Group has been used and ispresented in Figure 1. As many of the terms that contribute to this framework are usedthroughout this report, they are defined below.1
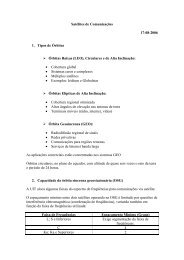
Building<strong>Vulnerability</strong> Model• Structural Type• Building Use• Building Codes• EngineeringAssessment<strong>Social</strong> <strong>Vulnerability</strong>Model1. Indicator Selection2. Risk PerceptionQuestionnaire3. Decision TreeAnalysis4. SyntheticEstimationEconomic<strong>Vulnerability</strong> Model• Direct Losses• Indirect Losses• GovernmentExpenditureHazardAssessment<strong>Vulnerability</strong>AssessmentRiskAssessmentFigure 1: The steps involved in per<strong>for</strong>ming a Risk Assessment as followed by the Risk ResearchGroup at Geoscience Australia. While most of the steps relate to traditional science disciplines suchas geophysics, geology and engineering, the framework has now expanded to include other importantfactors, such as social vulnerability and economic assessments.RiskRisk refers to the consequences of an event. The Risk Research Group uses a simpleexpression to define risk: ‘Risk = Hazard * Elements Exposed * <strong>Vulnerability</strong>’.This expression of risk is represented by the three-dimensional pyramid in Figure 2.The pyramid figure expands on the risk triangle developed by Crichton, where Crichtonstated that: ”’Risk’ is the probability of a loss, and this depends on three elements,hazard, vulnerability and exposure. If any of these three elements in risk increasesor decreases, then risk increases or decreases respectively” [19]. The risk pyramidaims to represent the three elements of risk in three dimensions, with the volume ofthe pyramid representing risk. Each edge of the pyramid is proportional to the threefactors; hazard, vulnerability and elements exposed. The greater the contribution ofone of the factors, the greater the volume and there<strong>for</strong>e risk.Natural HazardA natural hazard is considered to be a specific natural event characterised by a certainmagnitude and likelihood of occurrence. Common to all natural hazards is the uncertaintyassociated with both the hazards’ occurrence, the magnitude and the spatialextent of the hazard’s impact.2
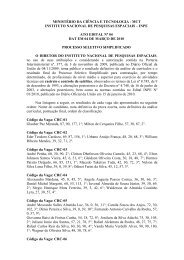
Figure 2: The risk pyramid shows the three independent factors that contribute to risk: hazard, exposureand vulnerability in a 3D <strong>for</strong>mat.Elements Exposed‘Elements exposed’ refers to the factors, such as people, buildings and networks, thatare subject to the impact of specific hazard. Other elements that are not explored in thisreport but which are also exposed include the economy and the natural environment.<strong>Vulnerability</strong><strong>Vulnerability</strong> refers to the capacity of an element exposed during the impact of a hazardevent. Definitions of vulnerability to natural hazards generally refer to the characteristicsof an element exposed to a hazard - road, building, person, economy - thatcontributes to the capacity of that element to resist, cope with and recover from theimpact of a natural hazard [51].<strong>Social</strong> <strong>Vulnerability</strong>This study is investigating aspects of social vulnerability, an element that has beenrecognised as integral to understanding the risk to natural hazards [7, 59, 29]. For thepurpose of this report, social vulnerability to natural hazard impacts has been simplifiedinto four different levels;• Individual within household (relating to personal attributes)• Community (relating to how we interact with those around us)• Regional/Geographical (relating to how far we are from services)• Administrative/Institutional (relating to disaster funding and mitigation studies)These four levels are shown schematically in Figure 3. This simplification aims toillustrate that there are diverse factors contributing to social risk from natural hazards,including those that relate to how hazards are managed by the region or nation we3
live in, while others relate directly to individual attributes. This study focuses on onlyone aspect of social vulnerability, which is shown by the first level of vulnerability inFigure 1 and relates to an individual and their household. For the purpose of this study,this level of social vulnerability is defined as; the ability of an individual within ahousehold to recover from a natural hazard impact.RecoveryIdeally, ‘recovery’ in this situation would be determined by a person or communitybeing able to revert to their social and economic state prior to being adversely affectedby a natural hazard. However, natural hazard impacts are life-changing moments <strong>for</strong>many people. There<strong>for</strong>e, in the context of this study, ‘recovery’ will refer to an individualwithin a household who attains a lifestyle state that is comparable to the oneprior to the natural hazard impact.Risk AssessmentRisk assessment refers to the analysis of various factors in order to establish the probabilityof a certain outcome from an uncertain event or suite of events. Such factorsinclude the magnitude and probability of a hazard, the vulnerability of populationsand the built environment and the overall loss or impact. Essentially, a natural hazardrisk assessment is a study undertaken to determine the range of possible consequencesfrom a natural hazard and is shown in Figure 1.Risk ManagementRisk management is the process of managing the possible outcomes from an uncertainevent and traditionally involves four steps; ”Mitigation, Preparedness, Response andRecovery”. The first two steps generally refer to the actions or measures taken prior toan impact, while the last two steps involve post-impact actions.Risk management is a popular practice in financial and investment companies, researchinstitutes and political studies. It involves measures of likelihood or probabilityand consequence. With regards to natural hazards, risk management refers to the activitiesundertaken to identify, control and minimise the impacts of natural hazards[51].Mitigation<strong>Vulnerability</strong> can be reduced by putting in place various measures that develop resiliencyto a natural hazard impact. For example, if a building is vulnerable because itsroof tiles are not tied down, then tying down the roof tiles can be a <strong>for</strong>m of mitigation.Or, if a person is considered vulnerable because they do not understand what to doin the event of a cyclone, a simple education program will reduce their vulnerability.Essentially, these activities <strong>for</strong> reducing vulnerability, there<strong>for</strong>e risk, are called mitigationstrategies, which is one step in the risk management process. It is the ultimateaim of a risk assessment to produce sufficient and accurate in<strong>for</strong>mation that will allowa risk manager to put in place effective mitigation strategies.4
Theme Individual in a household CommunityAccess to servicesOrganisational/InstitutionalConceptualFrameworkPersonal• How do personal attributesand living situations affectvulnerability?• How do finances contribute torecovery?Community• How do social networks affectvulnerability?• How does an individual’srelationship with communitiescontribute to recovery?Geographical• How does access to medical,welfare and support servicesaffect vulnerability?• How does distance to centrescontribute to recovery?Institutional• How does state and local riskmanagement policies affectvulnerability?• How does federal fundingcontribute to recovery?PossibleQuantitativeIndicators1 Age2 Income3 Residence Type4 Tenure Type5 Employment6 English Skills7 Household Type8 Disability9 House Insurance10 Health Insurance11 Debt and Savings12 Car13 Gender14 Injuries15 Residence Damage1 Reciprocity2 Sense of efficacy3 Cooperation4 <strong>Social</strong> Participation5 Civic participation6 Community Support7 Network size8Frequency and mode ofcommunication9 Emotional support10 Integration into the community11 Common action12 Bonding13 Bridging14 Linking15 Isolation1 Major Cities2 Inner Regional3 Outer Regional4 Remote5 Very Remote2Local GovernmentResponsibilityState compensation/assistanceagreement3 Previous NDRA Funding4 NDRMSP Funding5 Charity/fundraising cause<strong>Social</strong> <strong>Vulnerability</strong> ModelFigure 3: A schematic representation of some of the various factors contributing to social vulnerability. This study will focus on the first level of social vulnerability, whichrelates to the vulnerability of an individual within a household.15
Objectives of the studyThe research detailed in this report is the result of ongoing risk model developmentin the Risk Research Group at Geoscience Australia. It has been identified that thedevelopment of comprehensive risk models requires a better understanding of socialvulnerability to natural hazard impacts. There<strong>for</strong>e, this study aims to contribute to theRisk Research Group’s model development by integrating a quantitative <strong>methodology</strong>of measuring aspects of social vulnerability to natural hazards.By measuring some of the complex factors contributing to social vulnerability, wecan assist risk managers in better safeguarding their communities. Some of the keyquestions explored in this report include:• What factors contribute to the vulnerability of a person and their household to anatural hazard impact? Are physical attributes, such as age, disability and injury,more important than financial attributes, such as income, house ownership anddebt, in contributing to vulnerability?• Is vulnerability to a natural hazard impact perceived to be the same <strong>for</strong> differenthazards?• Can an approach be developed that is repeatable and comparable from one locationto another?• Can a single personal attribute determine vulnerability, or is vulnerability dependenton certain combinations of numerous attributes?• Can combinations of vulnerability attributes of individuals within a householdbe mapped?While these questions are not definitive of all points explored in this report, theyare some of the key drivers behind the selection of methodologies, measurement processesand applications. The method is specific to urban communities in industrialisedcountries, however minor changes and the use of different data would make it possible<strong>for</strong> various communities in many different situations to be assessed. There<strong>for</strong>e, oneof the main hopes of this study is to contribute to the ongoing global development ofvulnerability assessments that significantly value-add to total risk assessments.Format of the reportThe <strong>methodology</strong> development involves four main processes, or steps, and so Chapters1-4 will correspond to each of the four sequential steps, while the final chapterwill involve a discussion of the entire <strong>methodology</strong> and validation methods. The foursignificant processes involved in the <strong>methodology</strong> are represented by Figure 4 and are:• Step 1: Indicator Selection• Step 2: Risk Perception Questionnaire• Step 3: Decision Tree Analysis6
1. Indicator Selection2. Risk PerceptionQuestionnaire3. Decision TreeAnalysis4. Synthetic EstimationFigure 4: Four processes of investigating the vulnerability of a person within a household.• Step 4: Synthetic EstimationThe final chapter in this report, Chapter Five, addresses some of these issues indetail and raises some points <strong>for</strong> further research and development.7
Chapter 1Indicator SelectionLiterature review1. Indicator Selection2. Risk PerceptionQuestionnaire3. Decision TreeAnalysisDevelop selectioncriteriaSelectvulnerability indicators4. Synthetic Estimation1.1 <strong>Social</strong> IndicatorsIndicators are used to assess change over time of processes or phenomena that aredifficult to directly measure [16]. The use of social indicators to monitor the changein status of people and communities has a long history in social science research andhence <strong>for</strong>ms the basis of the indicators used in this <strong>methodology</strong>. <strong>Social</strong> indicatorsprovide a means of measuring social characteristics to provide decision-makers withan effective and influential tool.The applied use of indicators to critique social conditions originated around the1830s, when social re<strong>for</strong>mers in Europe, the UK and the USA used social statisticsto improve public health conditions [16]. By the 1960s, social indicators were usedby many governments around the world as a powerful component of policy development[48]. Many research and development agencies, such as the United Nations andWorld Bank devote substantial resources into developing social indicators and collectingrelevant data on these indicators in order to develop comparative assessments of8
communities across the globe. The Australian Bureau of Statistics (ABS) developedthe Socio-Economic Indexes <strong>for</strong> Areas (SEIFA), which has indices of advantage, disadvantage,economic resources, education and occupation to contribute to social andwelfare policy development in Australia. These indices provide some of the mostcomprehensive and up-to-date profiles of the Australian population.However, it must be remembered that indicators only provide an ‘indication’ ofmuch broader and complex social concepts. Researchers commonly note that goodindicators must have a clear conceptual basis in order to measure what is intended[16]. As a result, the development of a list of indicators will inevitably exclude somefeatures of a concept. Nonetheless, indicators can be used as a benchmark <strong>for</strong> assessingsocial effects and trends, and although some researchers have noted concerns with theuse of social indicators, most note the importance of continuing investigations intotheir use [39, 38].1.2 <strong>Social</strong> vulnerability and indicatorsThe concept of ‘measuring’ aspects of social vulnerability to natural hazards is one thathas been explored widely in emergency and disaster literature <strong>for</strong> more than 30 years.However, research has largely focused on qualitative assessment methodologies ratherthan quantitative risk modelling. In part, this is due to the complex nature of people,social structures and culture, however, it is also due to the multi-disciplinary approachrequired to undertake such research. No single investigation into vulnerability indicatorswill provide a holistic and comprehensive answer, however, there are aspects ofvulnerability that can be explored and represented through the development and applicationof quantitative vulnerability indicators. Since the 1990s, the application ofindicators that ‘measure’ social vulnerability to a natural hazard has been explored.King and MacGregor [39] further explore this concept, arguing that ‘how’ and ‘why’we measure vulnerability are just as important as ‘what’ we measure.Most criticism targeted at incorrect application of vulnerability indicators is duelargely to some of the key variables of social vulnerability being ignored or inadequatelyrepresented. There is a danger in trying to achieve a holistic answer to socialvulnerability using a single method or discipline, as it is a complex, dynamic and variableaspect of disaster risk research.The development of indicators of social vulnerability to natural hazards is a relativelysmall area of research, particularly within applications to industrialized nations.Some studies have investigated methodologies of vulnerability indicator developmentwithin a comprehensive risk assessment, including the Earthquake Disaster Risk Index[20] and the Cities Project [29, 28, 44]. Both of these methodologies acknowledge thatsocial vulnerability is as much a part of risk as building damage, hazard magnitude andeconomic loss.1.2.1 Study 1: Earthquake Disaster Risk IndexThe Earthquake Disaster Risk Index (EDRI) was developed by Rachel Davidson [20],who describes it ‘as a composite index that allows direct comparison of the relativeoverall earthquake disaster risk of cities worldwide, and describes the relative con-9
Indicators Mexico City San Francisco Tokyoxh1 21 46 49xh2 12 48 44xh3 82 41 32xh1-xh3 27 46 45xh4 19 33 37xh5 20 65 65xh6-xh7 31 39 48xh4-xh7 23 46 50xe1-xe4 45 43 89xe5 54 33 93xe6 27 65 66xv1-xv5 43 23 24xv6 32 56 28xc1 36 39 97xc2-xc3 46 26 76xr1 68 34 17xr2-xr3 54 23 18xr4-xr5 68 70 -4xr6 38 16 42xr7-xr9 34 39 38EDRI 38 37 54Table 1.1: EDRI ranks <strong>for</strong> Mexico City, San Francisco and Tokyo, demonstrating that all factors,including hazard and vulnerability are significant in calculating total risk. For further in<strong>for</strong>mation, referto Davidson’s thesis. [20].tributions of five factors to that overall risk’. The relationship between these factorsand their associated measurable indicators used in the EDRI are shown in Figure 1.1.The EDRI is one of the earliest risk indices to incorporate both structural and physicaldamage indicators with social and economic indicators, providing a more holisticapproach to measuring overall impact from a natural hazard. Davidson demonstratesthat even in urban regions with low seismicity an earthquake could turn into a majordisaster depending upon other characteristics of that city, such as population, use ofadequate building codes, national GDP and housing vacancy rate. One of the strengthsof the EDRI is that it has been re-evaluated over time so that trends in hazard intensity,economics and socio-demographics can be monitored.Davidson developed an EDRI index of numerous cities around the world, providinga relative risk ranking of each city. In the calculation of the EDRI <strong>for</strong> each city,five main factors are measured and contribute to the overall EDRI rank (Figure 1.1).The relevance of each factor used to calculate the EDRI <strong>for</strong> Mexico City, San Franciscoand Tokyo is shown in Table 1.1. A city such as Mexico City has a low hazardscore compared with San Francisco, but a much higher vulnerability score. There<strong>for</strong>e,the overall EDRI rank <strong>for</strong> Mexico City and San Francisco are similar, but <strong>for</strong> differentreasons.10
Figure 1.1: The five factors contributing to earthquake risk and their associated measurable indicatorsused in the Earthquake Disaster Risk Index (EDRI) [20].11
1.2.2 Study 2: Cities ProjectThe Cities Project <strong>methodology</strong> <strong>for</strong> assessing relative community vulnerability was developedby Granger [29], who notes that a major influence in developing the <strong>methodology</strong>was Davidson’s EDRI. The main difference between the two studies is that theCities Project ranks numerous small areas, such as Census districts or local governments,within one city against each other, while the EDRI ranks numerous internationalcities against each other. Granger also notes that the EDRI is computationallyand data intensive and <strong>for</strong> the purpose of small area comparison, the Cities Project<strong>methodology</strong> uses existing data and is designed to assist local governments [28]. Inoutlining the <strong>methodology</strong>, Granger and Hayne comment that there are few ‘workedthroughexamples of a risk-index’ such as the EDRI [28]. Both methodologies are twoof the most comprehensive quantitative risk assessments available <strong>for</strong> natural hazardrisk decision makers.The Cities Project <strong>methodology</strong> <strong>for</strong> assessing community vulnerability involvesthe development of indicators that contribute to an overall ‘relative risk rank’. Theindicators are derived largely from the Australian Bureau of Statistics (ABS) 1996Census [52] data and are grouped into categories referred to as the ‘5 esses’. Thesecategories are Setting, Society, Security, Sustenance and Shelter. Within these fivethemes, the indicators are a collection of physical, structural, economic and lifestylefactors chosen to measure a community’s vulnerability. The indicators have been chosen<strong>for</strong> their suitability <strong>for</strong> assessing risk from a range of natural hazards across a singlecity and provide a vulnerability estimate at the level of Census Collector’s District(Census District), which is approximately 200 households. Granger notes:”Because we are interested in showing the relative importance of eachCensus District to overall community vulnerability it was assumed thatthe most appropriate statistic to use would be the rank of the Census Districtin each measure. The use of rank is not without its problems. Inclusionof several variables that are highly correlated, or indeed derivedfrom the same basic statistic, will obviously bias the outcome. Similarly,the inclusion of variables that have little, if any, bearing on communityvulnerability could also distort the results. We feel, however, that with thecareful selection of variables, rank is an appropriate statistic to reflect therelative significance of Census Districts.” [28].The Cities Project focuses on the vulnerability issues surrounding individuals andhouseholds. The ‘5 esses’ indicators and their measurable variables used in the South-East Queensland Report [28] are listed in Table 1.2 and are considered representative<strong>for</strong> major urban areas. Some of the indicators are explained below:• Age: Those over 65 and those under 5 where considered more vulnerable• Gender: Females were considered more vulnerable than males.• Average House Occupancy: Larger households were considered more vulnerablethan smaller households.The addition of the value <strong>for</strong> each indicator contributes to a final vulnerabilityassessment that is dimensionless. However, the final risk index calculates a relative12
Setting Shelter Sustenance Security SocietyTerminalfacilitiesHouses Logistic Facilities Public safety Community facilitiesPopulation Average house occupanctiesWater supply facili-Business premises Large familiesdensityGender Flats TelecommunicationeconomicRelative socio-Single parentdis-familiesadvantage index(SEIFA/ABS)Average flat occupancsourcesLifeline length Economic Re-VisitorsResidential ratio People under 5 years Education andoccupationRoad network densityPeople over 65 years New residentsCars Households renting No religiousadherenceHouseholds with noUn-employment Elderly livingcaraloneTable 1.2: <strong>Vulnerability</strong> indicators, grouped by the 5 esses (Setting, Scene, Shelter, Security, Society),used in the Cities Project on multi-hazard risk assessment in South-East Queensland [28]rank <strong>for</strong> each area, in this case the census district, being studied. For each of the censusdistricts, values <strong>for</strong> each of the 31 indicators shown in Table 1.2 were added, with thefinal score representing a relative rank of vulnerability. The ranking <strong>methodology</strong> doesnot explore the relationship between indicators, that is, there is an assumption that eachindicator is independent. In addition, each indicator (except <strong>for</strong> two where Granger hasweighted some facilities/buildings as greater than other indicators depending upon asubjective judgement) has the same weight. However, the strength of this <strong>methodology</strong>is that it is relatively simple and consistent.1.2.3 Other vulnerability indicator studiesThere are many studies of community vulnerability to natural hazards. With the exceptionof EDRI and the Cities Projects, there are few comprehensive, quantitativeand applied methodologies. However, there are some other important studies that,while not necessarily comprehensive in terms of assessing physical, social and economicvulnerability, do investigate quantitative assessments of vulnerability to naturalhazards using indicators. Some of the more useful studies include:• A Hurricane Disaster Risk Index (HDRI) [41] This study is based on theEDRI <strong>methodology</strong> [20], but explores risk to hurricanes rather than earthquakes.Four factors of risk; (i) hazard, (ii) exposure, (iii) vulnerability, (iv) emergencyresponse and recovery are measured and analysed to give various cities an HDRIrank.• Creating a Safer City: A Comprehensive Risk Assessment <strong>for</strong> the City ofToronto [24] This study is similar to the Cities Project as it assesses the risk toone city from multiple natural hazards. Using a simple cumulative approach to13
anking the different administrative areas of Toronto, rather than requiring anyalgorithms as employed by the EDRI and HDRI, this risk assessment also recognisesthe importance of including hazard factors combined with social factors.Some of the hazard factors include spatial extent of hazard and probable magnitude,while some of the social factors include housing and age distribution ofpeople. Like the Cities Project, the Toronto assessment does not weight any ofthe social variables.• Transportation Per<strong>for</strong>mance, Disaster <strong>Vulnerability</strong> and Long-Term Effectsof Earthquakes [15] In reviewing the affects of the 1995 Kobe earthquakeon infrastructure, Chang based her vulnerability ranking on five indices:1)Relative Damage Index (dependent on damaged buildings per population), 2)<strong>Vulnerability</strong> index (percent of jobs found in small businesses), 3) EmploymentChange Index (change in total number of jobs in the administrative area betweenthe 1996 and 1991 censuses), 4) Competitiveness Change Index (the unexplainedresidual from the shift-share analysis normalized to 1996 employment, or whatis typically referred to as the change in competitiveness <strong>for</strong> the locality), 5)Accessability Index (highway transport accessibility). These indices establishrelative rankings of the various administrative areas in Kobe to provide an earthquakerisk assessment following the 1995 Kobe earthquake. This study is oneof the few that has integrated impacts to network systems in developing a quantitativeindex, which is integral to assessing how and when people recover froma natural hazard impact.• HAZUS Model [4] Restricted to flood, earthquake and hurricane hazards in theUSA, the HAZUS model is perhaps one of the very few integrated risk assessmentmodels. With input from many researchers and with over ten years ofdevelopment, the HAZUS model is a technical model that also employs limitedquantitative measurements of social vulnerability factors, such as ethnicity andgender. However, other social factors, such as age, disability, insurance levelsand the links that social vulnerability has to greater economic losses are notincluded.1.3 Selection CriteriaThe indicators selected <strong>for</strong> various studies depends on the purpose of the study, theresearch discipline being explored and the final application. Academics and organisationsinvolved with indicator development commonly devise selection criteria toensure that the most appropriate indicators are selected <strong>for</strong> their purpose. Commonthemes are listed in Table 1.3. The criteria <strong>for</strong> indicator selection <strong>for</strong> this study hasborrowed largely from established reviews and literature, in particular, the Rossi andGilmartin [61] study referred to in the development of the EDRI and are outlined inthe section below.14
Andrews and Davidson, 1997 Cobb and Rix<strong>for</strong>d,Withey, 1976 [2] [20]1998 [16]Monitored overtimeDisaggregated torelevant sociallevelCoherent Data quality Multiple indicators<strong>for</strong> same phenomenonKrumpe, 2000[40]QuantitativeKing and Macgregor,2000 [39]Developed with atheoretical modelValidity Clear and conceptualbasisData availability Narrow range Reliable Fixed set oftested indicatorsQuantitative Make substantivejustice a priorityObjectivity Reveal causes,not symptomsUnderstandable Have control overresourcesDirectnessResponsive Existing dataavailabilitySensitiveDiscriminatingIndicativeSignificantTable 1.3: Selection criteria <strong>for</strong> the development of an indicator set. This study borrows from establishedcriteria lists, but it is by no means exhaustive of appropriate criteria, merely representative.1.3.1 Criteria• Support Concept The most important aspect of indicator development is toensure the indicators selected serve the needs of the research question” [39].Indicators, there<strong>for</strong>e, must be viewed as tools used to articulate a concept.• Validity Indicators need to accurately represent concepts expressed in the modelor be acknowledged as valid substitutes <strong>for</strong> these concepts [20]. To ensure validity,the indicators must use credible data and be verifiable.• Data Availability and Quality Most criteria lists specify that data must be available<strong>for</strong> each indicator and from a reliable source. To ensure quality, the datamust be credible and reproducible.• Sensitivity Indicators assume a temporal aspect, as they are designed to measurechange in a system or process. Indicators must be aligned with the time-scaleon which they capture change, whether days, months or years. This will ensurethat the indicators are sensitive to change over time and there<strong>for</strong>e provide greaterinsight into the details of the factor being measured.• Simplicity Indicators are used to represent concepts to a variety of people andthere<strong>for</strong>e should be easily understood while also reflecting the complexity of theconcept represented. There<strong>for</strong>e, it is ideal that indicators are unambiguous andaccessible.• Quantitativeness Indicators must be measurable via a readily understood method.Clear methods of measurement will encourage wider indicator acceptance andlimit the bias or subjectivity of the data collator. A well explained method ofquantitative measurement will provide clarity and can be comprehended by decisionmakers.15
Number Indicator References1 Age [66, 59, 12, 39, 29]2 Income [66, 59, 8]3 Residence Type [59, 8]4 Tenure [59, 45]5 Employment [14]6 English Skills [14, 45]7 Household Type [39, 29, 14, 45]8 Disability [59, 14]9 House Insurance [67]10 Health Insurance11 Debt and Savings12 Car [66, 29, 14]13 Gender [59, 26, 29]14 Injuries [4]15 Residence Damage [4]Table 1.4: The thirteen socio-economic indicators and two hazard indicators used in this study toestablish the vulnerability of a person within a household to natural hazard impacts.• Recognition The concept of measuring vulnerability is not new, however, thetechniques used can often vary and new developments are made over time. Forthe purpose of this study it is considered important to use indicators that havealready been recognised by researchers as important contributors to social vulnerability.• Objectivity Indicators must have classifications that can be explored further byother methods, such as surveys, statistics and data analysis, and by other researchers.There<strong>for</strong>e, the indicator should remain the same over time, howeverthe data <strong>for</strong> the classifications will change to reflect trends.1.4 Selection of vulnerability indicatorsThe indicators chosen <strong>for</strong> this study, listed in Table 1.4, have been selected from extensiveliterature reviews, discussions with researchers and with the aim of exploringquantitative methods of assessing the vulnerability of an individual within a householdto a natural hazard. While not exhaustive of factors that contribute to a person’s vulnerability,this combination of quantifiable variables should provide an indication ofwhich people are the most vulnerable in a community in the event of a natural hazardimpact. Other factors contributing to a person’s ability to recover include spiritual,emotional and psychological capacity, as well as sense of community and other lesstangible factors. These factors are listed in Table 1.5 and while investigating qualitativeindicators is beyond the scope of this study, it is noted that they are also importantin understanding social vulnerability to natural hazards.The indicators in Table 1.4 have been selected with a similar philosophy to theEDRI. That is, the indicators of social vulnerability are only relevant when used incombination with a hazard assessment. However, this study varies from the EDRI andother vulnerability studies listed, as it explores the relationship between the selected16
IndicatorReferencesSense of Community [1, 39, 13]Emotional Capacity [14, 57]Psychological Capacity [25, 57]Trust in Authority Figure [26, 37, 22]Understanding of Natural Hazard [39, 1, 29]Perception of Risk [37, 63, 33, 25]Capacity <strong>for</strong> Change [23, 34]Core Beliefs and Values [39]Preparedness and capabilities of Local Government [33, 37]Table 1.5: Nine qualitative indicators of a person’s vulnerability to natural hazard impacts. Theseindicators are complex and more difficult to quantify than those shown in Table 1.4 and are not includedin this study.vulnerability indicators of a person within a household.As this study is focusing on investigating aspects of social vulnerability and nothazard, two indicators relating to hazard have been included in order to provide acontext <strong>for</strong> investigating vulnerability. These indicators are Injuries and ResidenceDamage and are listed as indicators 14 and 15 in Table 1.4. Indicators 1 to 13 are socioeconomicvariables that provide an insight into an individual’s characteristics, whilethe indicators Injuries and Residence Damage relate to the impact of the hazard. Theinclusion of these two indicators allows us to investigate social vulnerability in termsof recovery, as outlined in the introduction, while also investigating the relationshipthe other indicators have with Injuries and Residence Damage. There<strong>for</strong>e, while it isacknowledged that the indicators Injuries and Residence Damage are not vulnerabilityindicators, but hazard indicators, they are included as the 15 selected indicators withinthis report.Although the indicators listed in Table 1.4 are frequently noted in the literatureas contributing to a person’s vulnerability, they do not necessarily, in isolation, makea person vulnerable. However, a combination of these indicators, or the relationshipbetween indicators, may render an individual highly vulnerable to a natural hazardimpact. One of the main objectives of this study is to explore whether a combination ofquantitative indicators, based on the likelihood of one indicator being associated withothers, will provide a more accurate representation of vulnerability. To investigatethis further, we must gain further insight into perceptions of vulnerability and risk.The next chapter outlines a Risk Perception Questionnaire that was developed anddistributed in order to explore the relationships between the 15 selected indicators andtheir importance in various natural hazard scenarios.17
Chapter 2Risk Perception Questionnaire1. Indicator SelectionDevelopquestionnaire2. Risk PerceptionQuestionnaire3. Decision TreeAnalysis4. Synthetic EstimationGenerate hypotheticalindividualsDistributequestionnaire2.1 Indicators and measurementThe use of indicators to measure the vulnerability of people and communities has beenexplored in various natural hazard assessment studies, as discussed in Chapter One[29, 20, 24, 4]. Most do not apply weights to the vulnerability indicators and hence theindicators are generally considered to be independent and equally important variables.That is, the effects of a combination of particular indicator values compared with othercombinations are not explored. Some studies weight indicator values according to subjectiveperceptions of the importance of certain indicators [28]. However, the studiesreferred to in Chapter 1 have not explored the effects that combinations of indicatorswill have on a person’s vulnerability. For example, an elderly person may not be vulnerablejust because of age, but when combined with living alone, not having a car,having a disability and a low income, vulnerability may increase. However, if an elderlyperson lived with other people, had both house and health insurance and had avery high level of savings, then their vulnerability may decrease. This chapter willintroduce a means of addressing this issue.18
Indicators and weightingAs a condition of her application of weights to indicators, Davidson notes that ‘noamount of clever mathematical manipulation will uncover the ‘correct’ weights <strong>for</strong>the EDRI, because no single correct set of weights exists apriori[20]’. Davidson’sstudent, Lambert, further explored Davidson’s study of indicator weights to employthe analytical hierarchy process (AHP) <strong>for</strong> weighting the indicators of vulnerability inher study of the Hurricane Disaster Risk Index.To investigate the possibility of applying weights, two approaches can be taken;one which investigates the subjective application of weights based on a researchers’local knowledge, experience and intuition. This approach is generally qualitative andcan vary greatly according to the perspective of the researcher. The second approachcan employ more objective methods, focusing on a quantitative approach that minimisesa researcher’s opinion or bias. This study does not dismiss the subjective approach,which is appropriate in some situations, and recognises that every approachwill have some level of subjectivity. However, there is a need to further investigateif and how objectivity, through quantitative approaches, can be used to understandaspects of vulnerability.2.2 Perception of riskMany indicators of vulnerability to natural hazards cannot be measured by data setsdue to the scarcity of comprehensive and relevant data pertinent to natural hazardevents. However, the role of risk ’perception’ can be of significance when studyingsocial vulnerability measures. Slovic noted that if people perceive a risk to be real,then they will behave accordingly [63]. There<strong>for</strong>e, capturing in<strong>for</strong>mation regardingpeople’s perception of risk is valuable in understanding people’s behaviour. Whileperception of risk is not the same as actual risk, it does provide some insight into howpeople may behave in the event of a natural hazard in the absence of the availabilityof actual data-sets. Perception of risk also provides a view into what people value andwhat importance they place on certain factors in the event of an actual natural hazardimpact. Such in<strong>for</strong>mation is useful in determining how people will recover if thesefactors are affected during a hazard eventEach day people conduct their own risk management decisions, which includeconsciously and subconsciously reviewing the possible consequences and benefits ofrisk. For example, does the consequence of running across the road against a red lightoutweigh the benefit of arriving on the other side to catch the bus in time? Peoplewill make different decisions based on their own perception of risk which, in turn,is founded in their own education, experience, fear and emotional capacity. Studiesof risk perception are vast and span many research disciplines from psychology andgeography to engineering systems and sociology. It is beyond the scope of this study toengage in the epistemology of risk perception, however the basic concepts are essentialto the use of the selected indicators in a quantitative assessment of vulnerability.Early research investigating strategies <strong>for</strong> studying perceived risks involved thedevelopment of the psychometric paradigm by Fischhoff et al. [25]. The paradigminvestigates the means by which people make quantitative decisions on their perceivedrisk to a situation and is widely referred to in the literature. While some researchers19
have challenged the psychometric paradigm, it has demonstrated that perceived riskcan be quantified and predicted in the demonstrated situations [63, 25, 37]. It mustalso be acknowledged that a comparison between perceived risk to natural hazards andactual risk measured after an impact has not been explored using the psychometricparadigm. However, in situations where actual risk is often unknown or untested, suchas the risk from natural hazards, perceived risk may be considered a substitute <strong>for</strong>actual risk. There<strong>for</strong>e, any investigation into quantitative assessments of vulnerabilityto natural hazards, where the impact of the hazard is untested, should take into accountthe perception of the natural hazard risk.2.3 Questionnaire developmentThe development of the questionnaire is based on asking participants to rank the vulnerabilityof ten hypothetical individuals, where vulnerability is defined as ‘a person’sability to recover’, to various natural hazard impacts. For the purpose of this study,this rank will be considered a measure of social vulnerability. The individuals will beranked according to the participant’s perception of the impact of the natural hazardas per the indicators used in Table 1.4. Essentially, it is a measure of the perceivedcapacity of a person to recover from an impact event given the variables presented.2.3.1 Collection of national dataIn order to develop hypothetical individuals that are as realistic as possible, that is,that they resemble an urban Australian community, reliable data sources are required.At the time of the data source collection <strong>for</strong> this study, the 1996 Census undertakenby the Australian Bureau of Statistics (ABS) was the most current and comprehensivedata source. While most of the data was obtained from the ABS Census, not all of the15 indicators are represented in the Census, as noted in the section below. The datasources are used to provide a fair representation of Australians that could be exposedto a natural hazard. The data and context <strong>for</strong> 12 of the indicators are shown in thefollowing figures. The rational <strong>for</strong> their selection is also discussed. The two hazard indicatorsand one vulnerability indicator, House Insurance, do not have cross-correlateddata <strong>for</strong> representation in figures, so their context and rational is explained as follows:Indicator 9: House InsuranceApproximately one-third of Australian houses are uninsured, <strong>for</strong> both house and/orcontents insurance. Insurance becomes a significant factor in a person’s ability tofinance repairs or rebuild after a natural hazard impact [8].Indicator 14: InjuriesThe HAZUS risk assessment program has an injury classification scale, which hasbeen slightly modified <strong>for</strong> this study. Four classes have still been used, however, theclass of ’killed or mortally injured’ has been replaced with ’no injuries’. The fourclasses are there<strong>for</strong>e: 1)No injury, 2)Basic medical treatment without hospitalisation,3)Hospitalisation but expected to recover and 4)Hospitalisation with life-threatening20
injuries. This study is investigating vulnerability, defined as ’ability to recover’ of anindividual within a household, which is not applicable to the deceased. However, asthe impact of a natural hazard is greater than the physical injuries received, the class’no injuries’ has been included.Indicator 15: Residence DamageThe HAZUS risk assessment program has a building damage state classification scale,which has been slightly modified <strong>for</strong> this study. An extra class of ’no damage’ hasbeen added to the HAZUS classes with a total of five classes. The classes are: 1)Nodamage, 2)Slight damage, 3)Moderate damage, 4)Extensive damage and 5)Completedamage.Figure 2.1: Indicator 1: Age. Population by Age: The distribution of the Australianpopulation by age in 1996 [52].There is a uni<strong>for</strong>m decline in the population number after 50 years of age, with fewindividuals over 104 years of age. The average life expectancy of non-indigenous bornAustralians is 75 years <strong>for</strong> males and 81 years <strong>for</strong> females [56]. Mobility, access toresources, and financial capacity are some of the recovery issues <strong>for</strong> older and youngerpeople [14, 39, 66, 59, 29].21
Figure 2.2: Indicator 2: Income. Weekly Individual Income by Age: Individualweekly income (after tax) distribution by age in 1996 [52].The median income of 15-19 year olds is $40-$70. The median income rises to $300-$399 <strong>for</strong> 20-24 year olds, $400-$499 <strong>for</strong> 35-54 year olds, declining to $160-$199 <strong>for</strong>those over 55 years of age [56]. Income is one of the key indicators representing abilityto pay <strong>for</strong> services and resources that may otherwise not be readily available after ahazard impact, such as accommodation, cars, clothing and com<strong>for</strong>t items [8, 66, 29].Figure 2.3: Indicator 3: Residence Type. Residence Type by percentage of population:The distribution of household types in 1996 [53].Over 78% of the population live in a house. Flats are the next most common dwellingtype, with 12% falling into this category. Residence type provides an insight into thephysical safety of people, <strong>for</strong> example, a flood will be less of a risk to those living onthe 4th floor of a multi-storey building than an earthquake.22
Figure 2.4: Indicator 4: Tenure Type. Tenure Type: The distribution of householdtypes in 1996 by average weekly household income from the Household ExpenditureSurvey, Australian Bureau of Statistics [56].Approximately 53% of home owners have an average weekly income of $160, with51% having $414. The majority of 20-34 year olds have not purchased a home and25% of them rent privately. 5% of the population rent from a housing trust. Structuraldamage to a residence after a natural hazard impact will create varying financialburdens according to whether the residence is rented, owned or mortgaged [59]Figure 2.5: Indicator 5: Employment Employment by Age: The distribution of employment(working more than hour per week) by age within Australia in 1996 [52].Over 78% of 25-54 year olds are employed in Australia, while 38% of 15-19 year oldsare employed. 52% of those eligible to retire still work. Employment, regardless ofincome, indicates that a person is part of a network of people and has the capacity toearn money, both of which are important in the event of a natural hazard impact.23
Figure 2.6: Indicator 6: English Skills. Proficiency in English by Age: The proportionof the Australian population, by age, that can speak English well in 1996 [53].In 1996, 99% of Australians spoke some level of English, with 15% speaking a languageother than English at home. Communication in disaster risk management isessential and can be difficult if proficiency in English is an obstacle to effective communication[14]. Migrants and refugees may have come from situations where there isa mistrust of Government, affecting their trust of authority’s advice or warnings.Figure 2.7: Indicator 7: Household Type. Household composition by Income QuintileGroup: The distribution of household types within Australia [53].Over 6% of households in Australia are single parents with dependents, 24% are livingalone and 9% live in group housing. In a disaster the most immediate support networkis often the immediate household and hence extended family, friends, partner or agroup house implies some level of support network. Those who live alone may be lesslikely to have an immediate support network and may be more vulnerable if injured athome during an impact.24
Figure 2.8: Indicator 8: Disability. Users of all CSDA (Commonwealth-State DisabilityAgreement) Services: The proportion of the Australian population with disabilitiesby age [50].Approximately 0.3% of the Australian population live with a disability, according tothe Australian Institute of Health and Welfare. Of these, 76% have a mental/emotionaldisability, 13% a physical disability, 5% a sensory disability and 6% a neurologicaldisability. People with sensory disabilities (speech, hearing, vision) are at greater riskfrom not receiving in<strong>for</strong>mation be<strong>for</strong>e, during and after a hazard event. It must be notedthat ’people with a disability’ is one of the hardest groups to measure, as many peopledon’t identify as a person with a disability, while the elderly do not often identifyas disabled but merely ’old’. For this study, data relating to the use of Governmentdisability services is used.Figure 2.9: Indicator 10: Health Insurance Private Hospital Insurance: The proportionof the Australian population by age that has health insurance [18]. Approximately40% of the population 55 years of age and greater has health insurance. Australia’shealth system ensures that medical treatment is available to everyone during times ofcrisis. However, long-term treatment, including elective surgery, could be at risk if aperson does not have insurance.25
Figure 2.10: Indicator 11: Debt and Savings. The Financial situations of householdsby Age: financial situation of Australian households by age during September 2000[31].Over 2.5% of households are running into debt, with 0.5% in the age group 45-49years old and 0.5% in the age group 65 years of age and greater. Approximately 6%of the population is drawing on savings. Over 36% of the population are making endsmeet. This compares with 42% that are saving a little, mainly in the 18-44 year oldage group and only 11% reporting that they save a lot. Households with high levelsof savings suggest that they have some financial resources to utilize in times of greatneed.26
car ownershipsingle parent with dependent childrencouple with dependent childrenliving alonegroup housingcouple aloneFigure 2.11: Indicator 12: Car Ownership. Number of motor vehicles by HouseholdType: the distribution by income of the number of cars owned by the Australianpopulation [53].12% of households do not own a car. Over 42% own a single car, 34% own two cars,9% own three cars and 3% own four or more cars. Transport is important in bothmitigation and recovery processes [14, 29]. However, in times of hazard impacts, a caris another element that is exposed and there<strong>for</strong>e susceptible to damage.Figure 2.12: Indicator 13: Gender. Gender per percentage of total population: Thedistribution of males and females by age 1996 <strong>for</strong> the Australian population [53].There are still some situations in Australia whereby women are more disadvantagedcompared to men, <strong>for</strong> example, women’s incomes are lower overall and the majority ofsingle parents are women [56]. Australian urban centres have people from numerouscultural backgrounds, some that traditionally disempower women. Some researchershave demonstrated that women are more vulnerable to natural hazards, while othershave established that women are better able to come together to support each other andrecover more quickly than males [29, 59, 26].27
Indicator Classification Restriction/AssumptionAge < years As the individual developed refers largely to a householdsituation, it is assumed that most people agedunder 15 live with older peopleIncome $280 as it is assumed anyone below the povertyline cannot ’save a lot’.Car Ownership 3+ cars Those receiving below the poverty line,
Form Experts Non-Experts TotalDistributed:Personally 30 347 377Distributed:E-mail 83 0 83Received:Personally 12 63 75Received:E-mail 39 0 39Received:Mail 0 38 38Table 2.2: Distribution of the questionnaire and associated returnseach individual to be ranked on a scale of 1 to 10 <strong>for</strong> each of the four hazards listed;earthquake, flood, landslide and cyclone. The scale used <strong>for</strong> ranking the individualswas from 1 to 10, with 1 indicating ‘little time’ to recover, and 10 indicating ‘infinitetime’. The median rank, 5, indicated ‘sufficient time to interrupt life’ (Refer to theAppendices <strong>for</strong> a copy of the questionnaire). The questionnaire preamble deliberatelyavoids placing absolutes on some definitions and also on the ranking scale, so thatpeople were able to bring their own perception and experience to the questionnaire,while avoiding prejudiced definitions and semantic debates, such as vulnerability orresilience.The outcome of the hazard impact is presented to the reader, hence the type of hazardshould not theoretically be of importance. For example, if a person is hospitalisedwith minor injuries and the residence is destroyed, the hazard in question should not beof relevance to a person’s ability to recover. However, some hazards are more frequentin Australia, some hazards receive greater government assistance and some hazardsare represented differently in the media. People who have experienced a particularhazard and recovered quickly, such as a cyclone, may perceive cyclones to require lessrecovery time than an earthquake, which they may have not been exposed to, even ifthe resultant situation is the same. People who perceive the type of hazard as irrelevantwith regards to the outcome, have the option to rank all hazards the same <strong>for</strong> eachscenario.2.3.4 Respondent demographicsThe questionnaire was distributed to people living in large urban centres of Australiabetween November 15th 2002 and January 5th 2003. 110 questionnaires were completedand returned, which equates to 1100 ranked hypothetical individuals and anoverall response rate of 33% (Table 2.2).460 questionnaires (equating to 4600 hypothetical individuals) were developed anddistributed via personal delivery, email or postal mail. The questionnaire was emailedor personally distributed to 113 ‘experts’ with 51 completed responses returned (45%return rate). 347 questionnaires were distributed to ‘non-experts’ via mail or personaldistribution, with 101 completed responses being returned (29% return rate). 152 questionnaireswere returned completed, 5 were returned without completion and explainingwhy. The overall response rate is 33%.To further investigate the concept of perception, the questionnaire was distributedto ‘experts’ and ‘non-experts’. The term ‘experts’ and ‘non-experts’ are used to describeresearchers/practitioners of disaster risk management and those who do notwork in the area of disaster risk management respectively. There is often a greater em-29
Experienced a hazard? Expert Non-Expert TotalYes 26 (50%) 26 (26%) 52 (32%)No 20 (40%) 48 (46%) 68 (47%)Not stated 5(10%) 28 (28%) 31 (21%)Total 51 101 152Table 2.3: Hazard Experience. Approximately one-third of respondents indicated they had experienceda natural hazard event.Experienced hazard and ranked each the same? Expert Non-expert TotalYes 7 (29%) 9 (31%) 16N/A 4 (17%) 7 (24%) 11No and ranked their hazard higher 6 (25%) 4 (14%) 10No and ranked their hazard lower 7 (29%) 9 (41%) 16Total 24 29 53Table 2.4: The Hazard experienced. For the respondents who indicated they had experienced a naturalhazard, the greater number either ranked all hazards the same or perceived the hazard they experiencedto require less recovery time than the hazards they have not experienced.phasis on the opinion of ‘experts’ as opposed to ‘non-experts/lay people’ in numerousresearch fields, including disaster risk management [37]. However, when investigatingvulnerability and how people will recover from an impact event, the perceptionof the general public must be considered alongside experts. Slovic argues that, whenrisk is involved, if people perceive something to be true or impending, then they willmost likely behave in a manner that supports that perception [63]. Jasanoff argues thatall perception of risk, whether lay or expert, represent partial views of the situationsthat threaten us, and hence any policy development should reflect more than just thejudgements of the experts or the non-experts [37].2.4 Questionnaire resultsInitial results from the questionnaire highlight some interesting aspects of the perceptionof risk to natural hazards. Selected results are tabulated in Table 2.3 and Table2.4.There was a difference in how experts and non-experts rank each hazard <strong>for</strong> thesame outcome. Approximately two-thirds of both experts (31%) and non-experts(35%) considered that the type of hazard does make a difference to a person’a abilityto recover, even when the outcome of each hazard is the same. While it cannot bededuced from this study exactly why this perception exists, it may be due to the frequencyof some hazards in Australia, the type of media coverage some hazards receiveand the type of support people impacted by hazards receive from the government. Forexample, people perceive earthquakes as requiring more recovery time than landslides,even when injury, residence damage and personal attributes are the same. This may bedue to the sense that earthquakes can happen ‘anywhere, anytime’ and that the mediacoverage of earthquakes, both domestically and international, depicts the hazard as fataland causing damage. It may also be due to the fact that earthquakes generally have30
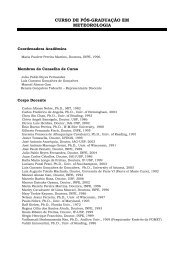
Figure 2.13: Destroying over 400 homes, injuring dozens and causing 4 deaths, the Canberra bushfiresof January 2003 affected the entire Canberra community. Data collection, as being conducted here byGeoscience Australia, focused on structural damage to homes.a broader impact on services and infrastructure when compared with landslides, whichare generally more localised. However, as the questionnaire only investigate impactsto individuals and their household and not communities or regions, the data cannot beused to support the theory that broad-scale hazards equal longer recovery, even if itappears a possibility.Table 2.3 shows the amount and percentage of respondents who have experienceda natural hazard. Half of the experts and only a quarter of the non-experts have experienceda natural hazard. Of those who had experienced a hazard, most have encountereda flood event (34%), while the next most popular was bushfire (27%), representingAustralia’s two most frequent hazards afflicting urban areas (Figure 2.4). 18% had experienceda cyclone, 8% have experienced and earthquake event and 4% experienceda landslide event.The results shown in Table 2.4 provide some interesting points <strong>for</strong> discussion butare not based on a sufficient data to make any definitive conclusions. However, it isworth noting that respondents, both expert and non-expert, who have experienced ahazard have a tendency to rank the hazard they experienced as requiring less or thesame recovery time as other hazards. On average, they did not perceive the hazardthey experienced to render people more vulnerable than other hazards. This may suggestthat people have a greater wariness or concern <strong>for</strong> hazards that they have notexperienced.Some of these points <strong>for</strong> discussion and issues raised will be explored in greaterdepth using decision tree analysis in the next chapter. The decision tree analysis willprovide a clearer insight into the relationship between individual vulnerability indicatorsand the perceived risk of a person to a natural hazard impact.31
Chapter 3Decision Tree Analysis1. Indicator Selection2. Risk PerceptionQuestionnaire3. Decision TreeAnalysisApply decisiontree analysisDevelop decision rules4. Synthetic EstimationEstablish high<strong>Vulnerability</strong> classesThis chapter examines decision tree analysis as a means of exploring one of the objectivesof this study; to investigate the relative importance of personal and householdattributes in contributing to vulnerability to a natural hazard. The focus of the applicationis to test the usefulness of applying a decision tree analysis to the data fromthe risk perception questionnaire. This chapter will introduce decision tree analysisand outline the process as relevant to this study, however, a more detailed account ofdecision tree <strong>methodology</strong> is presented in Appendix B.3.1 Decision trees and social vulnerabilityOne statistical technique that can be used to explore large quantities of data <strong>for</strong> thepurpose of classification and prediction is decision tree analysis. Decision tree analysisassists those involved in decision making by focusing on the essential data requiredto answer specific questions. Some of the more common applications of decision treeanalysis have been in the insurance and banking industries where they have been usedto predict the financial risks of customers. However, applications have been used inareas as diverse as medical diagnosis and landslide risk assessment [10, 32]. Applicationof decision tree analysis to studies of vulnerability is not new either, with a studyexploring famine and chronic food insecurity in developing nations applying decision32
VariableMaize/SheepCerealFamily SizeHealthMarket TravelLandFemalesIncomeDefinitionRetail price of maize/producer price of sheep terms of tradeGross production of all cereals in tonsAverage size of rural householdIndex of health infrastructure based on needDistance to big marketAverage arable land ownedShare of female heads in total number of household headsAverage farm income per capitaTable 3.1: <strong>Vulnerability</strong> indicators used in a decision tree analysis of the awraja in Ethiopia, whereawraja is an administrative district. [69]tree analysis to predict scenarios [69]. Decision tree analysis has also been used inother studies of food insecurity conducted by the International Food Policy ResearchInstitute [35], while the World Bank has also used decision tree analysis to exploreissues of vulnerability to poverty in developing nations [5].The study of famine and food insecurity, by Yohannes and Webb, demonstrateshow decision tree analysis can be used to identify indicators that characterise differentfood access scenarios [69]. Using the decision tree analysis software, CART (Classificationand Regression Trees), the authors of the study found that vulnerability ‘to foodinsecurity and famine cannot be measured by single discrete variables’ [69]. That is,vulnerability cannot be determined by a single indicator, but rather a combination ofmany indicators. Examples of the indicators are shown in Table 3.1. These indicators,like any study into vulnerability, are from a range of personal, geographical and financialattributes. By ‘bringing together a range of factors that reflect the behaviour andlivelihood conditions of the people most affected’, the study purports that decision treeanalysis can contribute to vulnerability assessments [69].3.2 Perception based classificationOne approach to knowledge discovery and the data mining process is to allow the userto interact with the data. The interaction between the user and the data is facilitated bythe use of visualisation techniques developed specifically <strong>for</strong> large multidimensionaldata sets.The perception based classification developed by Ankerst et al. [3] incorporatesa pixel-oriented visualisation technique which maps each attribute value to a fixedcolour map and displays attributes in different sub-windows. For example, in the circlesegment technique,Figure 3.1, the whole data set is represented by a circle whichis divided into d segments. Each attribute of the training data is represented in a separatesegment of the circle. Within a segment, each attribute value (or class label) isvisualized by a single coloured pixel as shown in part a of Figure 3.2. The colour ofthe pixel is established by mapping the training instances to attribute lists containingthe attribute value and its class label, as shown in part b of Figure 3.2.The circle segment technique has been applied to the survey data using all attributesand all class labels. The circle segments corresponding to the 15 attributes areshown in Figure 3.2. The rationale <strong>for</strong> the development of visualisation based classi-33
Figure 3.1: Eight attributes with binary class labels are visualized in the circle segment technique usedin perception based classification.(a)(b)Figure 3.2: Ten colours responding to the ten attribute values (or class labels) of ’little time to recover’which is number one, to ’infinite time’ which is number 10 (a), and the perception based classificationrepresentation of all the survey data as a circle (b).34
fiers is that it gives the user the opportunity to interactively explore the data. However,<strong>for</strong> application to the risk perception questionnaire and other data sets, patterns in thedata can be difficult to identify visually. One notable exception is the cluster of highvulnerability class labels associated with injuries. Under these circumstances automaticdata mining techniques can be employed, where machine learning is per<strong>for</strong>medwith little human intervention, such as the CART decision tree analysis used in thischapter.3.3 Decision tree analysisDecision trees are a schematic way of representing alternative sequential decisionsand the possible outcomes from these decisions. The analysis begins by placing all thedata, in this case the results from the risk perception questionnaire, into a decision treeanalysis program which, <strong>for</strong> this study is CART [9].The program sorts through all the data, partitioning or splitting the data into subsetsof increasing homogeneity. The point at which the data is split into subsets isdetermined by the attribute that leads to the split with the most homogenous subsets,as shown by the classes <strong>for</strong>med by splitting data, by orthagonal splitting, in part a ofFigure 3.3. The process of splitting continues until all data has been processed to <strong>for</strong>ma tree that has classified all the data, as shown in part b of Figure 3.3. Decision treesalso provide a ranking of how important individual attributes are <strong>for</strong> predicting possibleoutcomes. The tree, as shown in Figure 3.4, has a structure that includes the rootnode, branch, decision and leaf nodes. Once built, a decision tree can be used to classifydata by starting at the root node of the tree and moving through it until a terminalnode is encountered. Each terminal node provides a decision rule, or outcome, thatallows us to make a predictive statement about the data. A more detailed descriptionof decision tree analysis is provided in Appendix B.The maximal tree has a structure that includes the root node, branch, decision andleaf nodes and looks similar to that shown in Figure 3.4. Once built, a decision treecan be used to classify data by starting at the root node of the tree and moving throughit until a terminal node is encountered. The class assigned to each terminal node thencorresponds to a predicted outcome <strong>for</strong> the data in question.3.4 Analysis of the risk perception questionnaireThe results of the risk perception questionnaire were applied to the CART decision treeanalysis [9]. To ensure consistency was maintained from one respondent to another,the results of only one hazard scenario were selected. While it was discussed in theprevious chapter that there were some differences between the results <strong>for</strong> the fourdifferent hazard scenarios, it was also highlighted that the differences, considering thesmall sample size, were relatively minor. Flood was chosen as a representative asthe average vulnerability rank to flood (5.5) also correlates to the average rank <strong>for</strong> allhazards (5.53). It is the only hazard where by both experts and non-experts had thesame average rank. These reasons are considered sufficient to support the use of theresults of vulnerability to flood <strong>for</strong> the initial attempt at decision tree analysis.35
P 2P 3P 4P 1P 5P 2 P 4P 3 P 5P 1(a)(b)Figure 3.3: (a)Splitting of a two dimensional attribute data set with three classes using orthogonal and(b)the decision tree produced using orthogonal splitting of the two attributes oblique splits.Figure 3.4: The four components that are associated with a decision tree; the root node, decision node,leaf node and the branch.36
3.4.1 Assigning classes of vulnerabilityThe risk perception questionnaire provides 10 options <strong>for</strong> ranking a particular scenario,effectively creating 10 classes of vulnerability. Ten classes were selected in order tocapture a wide variation in response to the hypothetical scenarios and to test whetherthe decision tree could pick up subtle differences. Different respondents may have beenlikely to rate similar instances slight differently, making a precise distinction amongranks nearly impossible. For example, is there much difference between 4 and 5, or 3and 4? One way of overcoming this problem is to organise a redistribution of the tenclasses into new classes of vulnerability, which are more likely to be predictable.The original ten classes were there<strong>for</strong>e redistributed in a systematic manner andthe difference between the various vulnerability classes was investigated. Some of theredistributed groups lead to more accurate classes than others. For example, keepingall ten classes of vulnerability <strong>for</strong> the decision tree analysis results in a range of accuracies,from 43% to 79%. Hence, any decision rules developed from a completeddecision tree analysis will have a fairly low predictability rate <strong>for</strong> any new data. Theaim, there<strong>for</strong>e, is to get the highest predictability rate without compromising the dataor class accuracy.The other redistributions tried were <strong>for</strong> 5, 3 or 2 classes of vulnerability. Individualclasses towards the middle of the spectrum are, in general, the least predictable whileextreme classes and aggregated classes can be predicted with reasonable confidence.The best redistribution of the ten classes that assured a fair probability and accuracywas two classes, where levels 1–5 were mapped to Low and 6–10 were mapped to Highperceived vulnerability. While two vulnerability classes are a significant shift from theoriginal ten classes, the move towards better predictability of vulnerability addressesone of the aims of the study.3.4.2 Developing decision rulesThe decision tree was generated in CART using the GINI splitting rule and testing wasdone by 10-fold cross validation (as discussed in page 79). With these settings andthe class aggregation described above, CART produced a tree with 21 internal and 22terminal nodes.The 22 terminal nodes generated by the decision tree corresponds to 22 decisionrules of which 11 are rules <strong>for</strong> the affirmative case; that is, the person in question hashigh perceived vulnerability to a major flood. We only discuss the affirmative rules aswe are investigating the socio-economic characteristics that contribute to vulnerabilityto natural hazards. An example of part of the decision tree highlighting rules 4 and 5is shown in Figure 3.5. Instances where the no affirmative rule is found are necessarilyclassified as low vulnerability. A person is thus considered vulnerable if one of theaffirmative rules stated in Table 3.2 hold true. The same (affirmative) rules are statedalgorithmically in Figure 3.6. It is a matter of personal preference which representationis regarded the most comprehensible. The individual affirmative rules are listed belowwith commentary on why they have been <strong>for</strong>med and whether they can be consideredreasonable:37
38Rule Expression1 Injuries > 3.52 2.5 < Injuries ≤ 3.5 &Age > 60.53 2.5 < Injuries ≤ 3.5 &46.5 < Age ≤ 60.5 &Residence Damage > 2.54 Household Type ∈{1, 3, 5} &2.5 < Injuries ≤ 3.5 &Age ≤ 46.5 &Residence Damage > 3.55 House Insurance =0&Household Type ∈{2, 4} &2.5 < Injuries ≤ 3.5 &Age ≤ 46.5 &Residence Damage > 3.56 Injuries ≤ 2.5 &Residence Damage > 3.5&Age > 66.57 Injuries ≤ 2.5 &Residence Damage > 4.5&51.5 < Age ≤ 66.5 &Income ≤ 216.58 Injuries ≤ 2.5 &Residence Damage > 4.5&43.5 < Age ≤ 51.59 Tenure Type ∈{1, 4} & House Insurance =0&Injuries ≤ 2.5&Residence Damage > 3.5 &Age ≤ 43.510 Tenure Type ∈{2, 3} & Injuries ≤ 2.5 &Residence Damage ≤ 3.5 &Age > 64.511 Household Type ∈{4, 5} & Tenure Type ∈{1, 4} & Injuries ≤ 2.5 &Residence Damage ≤ 3.5 &Age > 73.5Table 3.2: Affirmative decision rules. A person is perceived to have high vulnerability if one of these logical expressions is true.
Decision Rule 4Decision Rule 5Figure 3.5: A snapshot of the decision tree developed <strong>for</strong> this study, showing rules 4 and 5.Rule 1• Life-threatening injuryInterpretation: A life threatening injury will take precedence over other personal attributes.Rule 2• Aged 60 years and over• An injury that requires hospitalisation but expected to recoverInterpretation: Older people will take longer to recover from mild to serious injuries.Rule 3• Aged between 47 and 60 years• An injury that requires hospitalisation but is expected to recover• Residence extensively damaged or completely destroyedInterpretation: Time off work, due to injury, could place a financial strain on thoseapproaching retirement.39
Rule 4• An injury that requires hospitalisation but is expected to recover• Aged 46 or less• Residence completely destroyed• Either a single parent or lives aloneInterpretation: Losing your home without a strong household network places you withoutimmediate support.Rule 5• An injury that requires hospitalisation but is expected to recover• Aged 46 or less• Residence completely destroyed• Either lives as a couple or in a group household• No house insurance.Interpretation: Being responsible <strong>for</strong> the wellbeing and shelter of others in the homeand losing your house without insurance could create an enormous financial burden.Rule 6• Aged 67 years or more• Either has an injury that requires basic medical treatment or no injury at all• Residence extensively damaged or completely destroyedInterpretation: People in this age demographic are generally retired and often have alltheir finances invested in the house they own. Hence any major damage to the homecould put a strain on their finances as they are less likely to have an ongoing source ofincome.Rule 7• Aged between 52 and 66• Either has an injury that requires basic medical treatment or no injury at all• Residence completely destroyed• Has a very low incomeInterpretation: Losing a home when you are nearing retirement on a very low incomewould be a large financial burden, particularly if you also sustained an injury thataffected your capacity to work.40
Rule 8• Aged between 44 and 51 years• Either has an injury that requires basic medical treatment or no injury at all• Residence completely destroyedInterpretation: People of this age often have families and are in the middle to end oftheir working life, there<strong>for</strong>e total destruction of their home, which many people arestarting to own in this age bracket, could be a financial strain. But it must be notedthat, this may be an example of the sensitivity of decision trees to small training sets asmentioned on page 76. In this case, Rule 7 and 8 would collapse into a rule stating thatvulnerability is considered high <strong>for</strong> individuals with moderate injuries (≤ 2.5), withthe highest possible building damage and aged between 44 and 66 irrespective of theirincome.Rule 9• Aged 43 or less• Residence extensively damaged or completely destroyed• No house insurance• Either owns their house or rents from the governmentInterpretation: Government housing lists are long, and so waiting could take sometime. For people who owned their house, extensive damage/destruction without insurancewould be a large financial burden.Rule 10• Aged 65 years or more• Either has an injury that requires basic medical treatment or no injury at all• Residence either not damaged, suffered minor or moderate damage• Either have a mortgage or rent privatelyInterpretation: The perception here is having immediate financial commitments (mortgageor rent) is a factor making people vulnerable in case of a disaster. Note that therole of tenure type in Rule 9 has been reversed in this case.Rule 11• Aged 74 and over• Either has an injury that requires basic medical treatment or no injury at all• Residence slightly or moderately damaged, or no damage at all41
• Either owns their house or rents from the government• Either lives alone or in a group houseInterpretation: This decision rule has the greatest combination of indicator attributesand relates to people 74 and over. This suggests that older people have a broaderrange of attribute combinations and may there<strong>for</strong>e be more vulnerable to natural hazardimpacts.3.4.3 The relative importance of the 15 indicatorsThe relative importance of indicators in this study is listed in Table 3.3. The indicator’Injuries’ is perceived as the most important discriminator <strong>for</strong> vulnerability. Injurywill affect a person’s ability to recover, regardless of their personal attributes such asincome or age. However, this indicator is closely connected to the context of the hazardscenario rather than the context of the individual’s characteristics, and is there<strong>for</strong>econsidered a hazard indicator, as mentioned in Chapter Two. It is to be expected thatthe hazard indicator ’Injuries’ is considered the most important indicator, as it directlyrelates to survival.The second most important indicator is ’Residence Damage’ with a relative importancescore of less than 25% of Injuries. Again, this indicator is also tied to thehazard scenario rather than the individual and, as expected, perceived as an importantfactor in the ability to recover from a natural disaster. The fact that the decisiontree analysis found that both the hazard indicators, Injury and Residence Damage, arethe most important discriminators <strong>for</strong> vulnerability to natural hazards, demonstratesthat the analysis is intuitively reasonable. It also highlights the difference, outlined inChapter Two, between hazard and vulnerability indicators and the role they play in anatural hazard impact.The indicators House Insurance, Income and Tenure Type are the next most importantindicators after Injuries and Residence Damage and there<strong>for</strong>e the most importantsocio-economic vulnerability indicators. All three have relative importance scores justabove 10%. House insurance and Income are reasonably straight<strong>for</strong>ward in the waythey affect the perceived vulnerability as discussed in the outline of each decision rule.Tenure Type, however, is slightly different as it affects vulnerability in different waysdepending on the other indicators. For example, Rule 9 suggests that owning a houseor living in government housing contributes to vulnerability, but only when the individualis younger than 43, doesn’t have house insurance and the residence suffers extremeor complete damage. However, Rule 10 states that the opposite tenure types - owningwith a mortgage and renting - contribute to vulnerability but only when an individualis over 65, has a minor injury and the residence suffered minor, moderate or no damage.These two rules and their use of Tenure Type demonstrates that no one indicatorvariable, such as renting or owning a house, is always indicative of vulnerability.Next is Age, with a relative score of just over 2%, while the remaining indicatorshave scores below 1% and only Debt, Employment, Car Ownership, and English Skillshave relative scores above 0.01% The lowest scoring indicators are Household Type,Health Insurance, Residence Type, Disability and Gender. Household Type, Disabilityand Gender have traditionally been regarded as important factors in assessing thevulnerability of individuals, yet are not considered of high relative importance by the42
IndicatorScoreInjuries 100.00Residence Damage 24.23House Insurance 12.36Income 11.59Tenure Type 9.61Age 2.10Debt 0.06Employment 0.05Car Ownership 0.02English Skills 0.01Household Type 0.00Health Insurance 0.00Residence Type 0.00Disability 0.00Gender 0.00Table 3.3: Relative indicator importance according to the decision tree analysis.analysis [39, 29, 14]. However, Disability was only present in 10% of the survey casesand may there<strong>for</strong>e not have been sufficiently represented to make a difference. Thisshould be noted as a point <strong>for</strong> further investigation. The indicator Health Insurancemay have scored low due to the comprehensive public health system present in Australiathrough the government funded medicare and pharmaceutical benefits schemes.Respondents may have regarded private health insurance as unimportant in the case ofa major personal injuries, as they would be treated regardless of their insurance status.3.5 Decision rule findingsThe risk perception questionnaire provided results that addressed some significant issuesdiscussed in Chapters One and Two. These include:• The decision tree rules demonstrated that no one personal attribute in isolationis responsible <strong>for</strong> vulnerability. Complete destruction of a residence was shownto make everyone vulnerable, regardless of other attributes, however, as noted,this is a hazard indicator rather than a vulnerability indicator.• While it appears that, regardless of which hazard impacts a person, if the result isthe same then the recovery period from the hazard should be the same. However,as residence damage and home insurance were the most significant attributesaccording to the decision tree, then an earthquake, which usually causes morestructural damage than a flood, may take longer to recover from.• Income, house insurance and age were three of the highest four indicators of relativeimportance after injury and residence damage. The other was tenure type.House insurance and income were more significant than age (by a factor of 6).House insurance, income and tenure type all relate to a person’s financial situation,highlighting the significance of finances in the perception of vulnerabilityto natural hazards.43
• Experts did rank ability to recover as lower, or quicker, than non-experts, albeita relatively minor difference.The decision rules provide an interesting insight into how we can view the vulnerabilityof an individual within a household to natural hazards. The 11 high vulnerabilitydecision rules demonstrate the importance of investigating a range of personaland household characteristics when analysing vulnerability to natural hazards. Thedecision rules also demonstrate that using a knowledge discovery technique, such asdecision tree analysis, is a feasible means of exploring complex social data. However,the <strong>methodology</strong> outlined thus far requires an application to further explore it’s value.The next chapter introduces a case study area in Western Australia <strong>for</strong> application ofthe decision rules.44
<strong>Vulnerability</strong> =’Low’#Default if no affirmative rule is foundif Injuries > 2.5:if Injuries > 3.5:Vulnerable = ’High’ # Rule 1else:if Age > 46.5:if Age > 60.5:<strong>Vulnerability</strong> = ’High’ # Rule 2else:if Residence Damage > 2.5:<strong>Vulnerability</strong> = ’High’ # Rule 3else:if Residence Damage > 3.5:if Household Type in [1,3,5]:<strong>Vulnerability</strong> = ’High’ # Rule 4else:if House Insurance == 0:<strong>Vulnerability</strong> = ’High’ # Rule 5else:if Residence Damage > 3.5:if Age > 43.5:if Age > 66.5:<strong>Vulnerability</strong> = ’High’ # Rule 6else:if Residence Damage > 4.5:if Age > 51.5:if Income ≤ 216.5:<strong>Vulnerability</strong> = ’High’ # Rule 7else:<strong>Vulnerability</strong> = ’High’ # Rule 8else:if House Insurance == 0:if Tenure Type in [1,4]:<strong>Vulnerability</strong> = ’High’ # Rule 9else:if Age > 48.5:if Age > 64.5:if Tenure Type in [2,3]:<strong>Vulnerability</strong> = ’High’ # Rule 10else:if Age > 73.5:if Household Type in [4,5]:<strong>Vulnerability</strong> = ’High’ # Rule 11Figure 3.6: Affirmative decision rules - algorithmic <strong>for</strong>m. A person’s perceived vulnerability is determinedby the value of High vulnerability or Low vulnerability.45
Chapter 4Synthetic Estimation1. Indicator Selection2. Risk PerceptionQuestionnaire3. Decision TreeAnalysis4. Synthetic EstimationSelect case study areaDevelop syntheticestimatesMap vulnerabilityscenariosThe fourth and final step in the <strong>methodology</strong> provides the opportunity to apply thedecision tree rules to a spatial area in order to analyse the vulnerability of individualswithin a household in a real community. The application of the decision rules toa study area is presented as maps that identify the areas with a lower or higher proportionof households with highly vulnerable individuals. Maps are a vital part ofemergency management and town planning and are also useful means of presentingspatial in<strong>for</strong>mation.This chapter will introduce the synthetic estimation techniques used to develop thepopulation estimates of highly vulnerable individuals within a study area. The area selected<strong>for</strong> this study is within Perth, Western Australia, and the final part of the chapterwill present and discuss the vulnerability maps that have been developed with the syntheticestimation results. For this study, an area of 224 Census Districts (approximately220 households per Census District) in Perth, the capital of Western Australia, has beenchosen. Perth contains approximately 71% of Western Australias population, or about1.3 million people [56]. Perth is situated beside the flood prone Swan River and approximately150km south-west of Australia’s most active earthquake zone. There are46
Figure 4.1: Registering 6.9 on the Richter Scale, the Meckering earthquake of 1968 destroyed the smalltown located 130km east of Perth. Structural damage from the event can still be seen today in buildingsin the Perth CBD.also several limestone belts to the north and south of Perth where hazardous karst limestonesystems are located, while the city’s coastline suffers from coastal erosion as aresult of high winds and storms.4.1 Perth Cities ProjectPerth is the location currently being researched <strong>for</strong> Geoscience Australia’s multi-hazardrisk assessment study referred to as the Perth Cities Project. Beginning in 2001, thePerth Cities Project 1 covers an area represented by 46 Local Government Areas (LGA),from Gingin in the north, south to Busselton and east to Northam. As the entire Pertharea is too large <strong>for</strong> this vulnerability study, a smaller area has been chosen and isrepresented by a collection of 224 Census Districts, involving the Wanneroo and Swanlocal governments and is shown in Figure 4.2.4.1.1 Study AreaThe study area selected <strong>for</strong> this case study is within the Perth Cities Project area shownin Figure 4.2. The collection of Census Districts within the study area also aggregateto Statistical Local Areas (SLA), so that benchmark or comparison data are readily1 The study has required the development of collaborations with State and Local Government andprivate companies in order to exchange data and align risk management needs. Due to these strongcollaborations, data availability and spatial in<strong>for</strong>mation, the Perth Cities project provides an ideal casestudy opportunity <strong>for</strong> the application of the social vulnerability <strong>methodology</strong>47
available at the SLA level <strong>for</strong> use in any future studies. The agreed final selection,shown in Figure 4.2, totals 224 Census Districts and include all 153 Census Districtsin the South-West Wanneroo SLA, all 44 Census Districts in the South-East WannerooSLA and 27 Census DistrictS in the Swan SLA.4.2 Synthetic estimationThe aims of the case study application are to model the distribution of vulnerabilityin 224 Census Districts in Perth and to assess the role of synthetic estimation in a<strong>methodology</strong> aiming to quantify vulnerability to natural hazards. The techniques usedto develop synthetic estimates in this case study were developed by NATSEM at theUniversity of Canberra and are presented in greater detail in a paper presented by Dayand Dwyer [21].The main problem encountered in studying the personal attributes of people withina community is obtaining access to detailed data on the 15 indicators used in the 11decision rules that have been used in this study. The ABS do not release such highlydetailed data due to privacy laws. For example, we are permitted to access how manypeople in one Census District (a Census District is approximately 200 households insize) are over 55, how many people live alone and how many people are low incomeearners. However, we are not permitted to have access to how many people are over55 and live alone and earn a low income, which is referred to as cross-tabulated data.Synthetic estimation was used to develop estimates of the populations attributes<strong>for</strong> the 15 indicators. The method uses Census data <strong>for</strong> real spatial areas in order tocreate best fit data, which are referred to as synthetic estimates. This best fit creates themost accurate representation in the absence of access to actual data. This technique ofsynthetic estimation used in creating estimates of the vulnerable individuals in households<strong>for</strong> each of the Census Districts in the study area can be summarised into foursteps:• 1. Extract relevant HES household, person and expenditure data. The majorityof the variables are household reference person and household variablesin the household level data. In addition, disability status of the household referenceperson is extracted from the person level data and insurance variables areextracted from the expenditure data.• 2. Extract weights <strong>for</strong> sample Census Districts. MarketInfo The data usedto develop the hypothetical individuals relied on a data sources, predominantlythe Census, which were not location specific. However, in this case study, weneed to tie the data to specific Census Districts. To ensure the characteristics ofindividuals within households in each of the 224 Census Districts is the mostaccurate, a weighting method is needed. In this study, MarketInfo was used,which has developed specific weights linking data with location. Weights <strong>for</strong>the 224 Census Districts in the study area were extracted.• 3. Generate synthetic data. The extracted data in each HES record were classifiedand weighted in order to determine the number of people in each CensusDistrict with each characteristic.48
Figure 4.2: The aggregated Census Districts across 3 Statistical Local Areas used in the study. The casestudy area includes southern Wanneroo and Swan Local Governemnts and is part of the larger GeoscienceAustralia Perth Cities Project study area.49
• 4. Synthetic socio-economic data The resulting synthetic data <strong>for</strong> each CensusDistrict has over 70 fields (i.e. all data variables <strong>for</strong> each of the 15 selectedindicators). Each field name indicates the variable and each field in the syntheticdata contains the number of households or reference people in that variable inthat Census District.4.3 Synthetic estimates <strong>for</strong> the Perth Case studyThe risk perception questionnaire describes an individual in terms of particular personalcharacteristics, but there is no in<strong>for</strong>mation on the characteristics of other membersof the household (apart from whether a partner or dependents exist). Hence theunit of analysis is persons, but not all persons in the household. There<strong>for</strong>e the syntheticdata must replicate these persons and those characteristics in order <strong>for</strong> the decisionrules to be appropriately applied to determine the small area geographic distribution ofvulnerability.In this application, it was decided to use the HES Household Reference person(a person chosen according to certain criteria articulated by the ABS) as a surrogate<strong>for</strong> the randomly generated hypothetical individual. The household reference personis defined in the ABS HES technical paper [54] as one of the usual residents aged 15years and over that meet one or more of the following criteria:• partner in a registered or de facto marriage• lone parent with dependent child(ren)• person with the highest income• the eldest person.Table 4.1 shows the ratio of males to females <strong>for</strong> each family composition class.From this, we can deduce that the characteristics of household reference people areunlikely to match those of a randomly generated person. For example, the householdreference person is male in over 70% of cases, while one parent families are leadby a woman in nearly 90% of cases. The sex distribution of household referencepeople is less skewed in group and lone person households. This choice of unit ofanalysis means that the synthetic results are <strong>for</strong> the number of households or householdreference people in each Census District as a surrogate <strong>for</strong> the number of hypotheticalindividuals in each Census District.4.3.1 Matching questionnaire variablesOften HES data has more detail than the questionnaire’s classes of interest, so HESclasses were merged in order to match the classes. HES surrogates <strong>for</strong> English skills,disability and debt and savings were agreed as there were no exact matches. Table 4.2shows the variables selected from the 1998/99 HES which best match the vulnerabilityindicators. The third column in this table shows the classes used <strong>for</strong> each vulnerabilityindicator.50
SexCoupleonlyCouplewithchild(ren)GroupOneparentAloneMale 73 72 56 11 45Female 27 28 44 89 55Total 100 100 100 100 100Table 4.1: Percentages of family composition by sex of household reference person. (Source: ABSHousehold Expenditure Survey 1998/1999)<strong>Vulnerability</strong> Indicator HES characteristic variable HES classes usedAgeAge of the household reference person15-19, 20-24, 25-29, 30-34, 35-39,40-44, 45-49, 50-54, 55-59, 60-64,65-69, 70-74, 75+CarNumber of registered cars and motorcycles0, 1, 2, 3+in the householdDebt and Savings Main source of household emergencySavings, Financial Loan, FamilymoneyLoan, Other, NoneDisabilitySeverity of the restriction of the personNone, RestrictionEmploymentLabour <strong>for</strong>ce status and status in employmentEmployed, Not Employedof the household referencepersonEnglish SkillsYear of arrival of the household referenceperson in AustraliaAustralia born, Recent(1996-1999),Prior to 1995GenderSex of the household reference personMale, FemaleHealth Insurance Hospital, medical, dental insurance Yes, NoHouse Insurance House Insurance, Contents Insurance,None, Contents, House, BothHouse and contentsHousehold Type Household Family Composition Lone, Couple with kids, couple nokids, single parent, group householdsIncomeTotal gross weekly income of thehousehold reference personQ1: $0 to $221, Q2:$221 to $358,Q3: $358 to $564, Q4: $564 to$842, Q5:$842 to $4, 087Residence Type Dwelling Structure House, 2Storey, 3Storey, 4Storey,FlatTenure Nature of Housing Occupancy Own, Mortgage, Government rental,Private rentalTable 4.2: <strong>Vulnerability</strong> indicators paired with 1998/99 HES variables. (Source: ABS HouseholdExpenditure Survey 1998/1999).51
Classes Residence Damage Description Injury Description1 not damaged no injuries2 slightly damaged requires basic medical treatmentwithout hospitalisation3 moderately damaged requires hospitalisation and isexpected to recover4 extensively damaged requires hospitalisation withlife threatening injuries5 completely destroyed.Table 4.3: Injury and residence damage scales, modified from HAZUS [4].Injury/Damage Damage1 Damage2 Damage3 Damage4 Damage5Injury1 Scenario1 Scenario1 Scenario1 Scenario2 Scenario3Injury2 Scenario1 Scenario1 Scenario1 Scenario2 Scenario3Injury3 Scenario4 Scenario4 Scenario5 Scenario6 Scenario6Injury4 Scenario7 Scenario7 Scenario7 Scenario7 Scenario7Table 4.4: Of the 20 possible scenarios based on the 5 Damage and 4 Injury Classifications, 7 actualscenarios were identified by the decision tree rules. Refer to Table 4.3 <strong>for</strong> an explanation of the injuryand damage classifications.4.4 <strong>Social</strong> vulnerability in the Case Study areaThe decision tree analysis of the questionnaire data revealed that Injury and ResidenceDamage were the most important indicators in determining an individual’s ability torecover from a natural hazard. Consequently, no single spatial assessment of vulnerabilitybased on socio-economic characteristics alone is possible. Rather, one based ondifferent injury and damage scenarios is necessary. There<strong>for</strong>e, it is essential to havea hazard context when assessing the relationship that socio-economic indicators havewith each other and the hazard when assessing vulnerability to natural hazards. Table4.3 shows the different injury and damage scales in Chapter 2.If the five classes of damage were combined to explore every possible scenario,there would be 20 logical combinations, as shown by the matrix in Table 4.4. However,the decision rules produced by the decision tree have identified only seven distinctscenarios. That is, when the data is put into the decision tree, some of the possiblescenarios are not differentiated. For example, when the injury level is 2, it does notmatter if residence damage is 1, 2 or 3 as the decision rules show no differentiation.Table 4.5 shows the scenarios and their associated injury and damage scores, as well asthe nodes in the decision tree that are populated in the scenario, and the socio-economicvariables used in the rules.A particular scenario and its associated injury and damage scores are assumed toaffect the whole of every Census District in the study area whereas in an actual event,different buildings and people will be affected to differing degrees. This issue will bebetter resolved when sufficient hazard models are developed and can be overlain onthe vulnerability maps. Unlike the injury and damage states, the five socio-economiccharacteristics used in the decision tree rules (house insurance, income, tenure type,52
Scenario Injury Damage Mean of individualswithin a householdRelevant decisionrulesRelevantindicatorvariables1 1or2 1, 2 or 3 8 10, 11 age, tenure,family type2 1or2 4 31 6, 9 age, insurance,tenure3 1or2 5 79 6-9 age, insurance,tenure, income4 3 1or2 38 2 age5 3 3 123 2, 3 age6 3 4or5 187 2-5 age, familytype, insurance7 4 1, 2, 3, 4or 5247 1 none (based oninjury scale)Table 4.5: Scenarioswith corresponding decision rules and indicator variables. The mean of the householdreference people in the high vulnerability class in each Census District is also listed.age and household type) vary across Census Districts. In most cases, injury, damageand one demographic characteristic (age) determine the node. At most, three socioeconomiccharacteristics are required to distinguish between nodes, <strong>for</strong> example node9 in scenario 3 (injury 1 or 2 and damage 5), age, home insurance and tenure arerequired.4.4.1 Estimated social vulnerability of the study areaThe resulting synthetic vulnerability data contains, <strong>for</strong> each Census District, the numberand percent of household reference persons in the high vulnerability class <strong>for</strong> eachof the seven identified scenarios. For each level of injury, the average number of householdreference people in each Census District that are affected increases as residencedamage increases, regardless of any other indicators 4.5. For example, <strong>for</strong> injury level2, which corresponds to Scenario 1, 2 and 3, the average percentage of people deemedhighly vulnerable increases from 3% (when damage is 1, 2 or 3) to 32% (when damageis 5). The mean count of people deemed highly vulnerable increases from 8 (whendamage is 1, 2 or 3) to 79 (when damage is 5).For injury level 3, which corresponds to Scenario 4, 5 and 6 the mean percentageof people deemed highly vulnerable increases from 16% (when damage is 1 or 2), 50%(damage state 3) to 76% (when damage is 4 or 5). The average count of people deemedhighly vulnerable increases from 38 (when damage is 1 or 2) to 187 (when damage is4) to 247 (damage state 5).In addition, the above table shows that in most scenarios <strong>for</strong> a particular injurylevel, the range of the data (that is, the difference between the minimum and maximumvalues) increases as the damage increases. For example, <strong>for</strong> injury level 2 the range inpercentage of people deemed highly vulnerable increases from 15% (when damage is1, 2 or 3) to 65% (when damage is 5). The range in count of people deemed highlyvulnerable increases from 62 (when damage is 1, 2 or 3) to 424 (when damage is 5).For injury level 3 the range in percentage of people deemed highly vulnerable53
increases from 49% (when damage is 1 or 2) to 62% (when damage is 4), then dropsback down to 39% (when damage is 5). The range of people deemed highly vulnerableincreases from 316 (when damage is 1 or 2) to 718 (when damage is 4) and then to1052 (when damage is 5).4.5 Mapping social vulnerability using hazard scenariosMaps of the seven scenarios have been developed <strong>for</strong> the Perth study area and areshown from Figure 4.3 to Figure 4.9. The maps show the percentage of each CensusDistrict that have households in the high vulnerability class. Maps with percentagesof vulnerable households have been used to demonstrate the significance of the socialindicators in determining social vulnerability.Each of the seven scenario maps has fourteen selected Census Districts that havebeen numbered from 1-14. While each of the seven maps allows us to compare CensusDistricts within a given scenario, the numbered Census Districts provides the opportunityto compare Census Districts between the scenarios. This comparison, whichdemonstrates that the thirteen selected indicators do contribute to recovery capacity ofindividual within a household, will be discussed in greater detail in the next section.4.5.1 Mapped scenariosThe seven mapped scenarios have been produced with the same distribution so thatindividual Census Districts can be compared both within a single scenario and acrossall seven scenarios. That is, each of the 224 Census Districts are coloured accordingto the percentage of households in the high vulnerability group, with every 10%increment assigned a different colour. A cursory glance at the seven different scenariosdemonstrates that, regardless of the state of personal injury and residence after animpact event, there are some socio-economic characteristics that do contribute to perceivedability to recover. The only exception is Scenario 7 (fig:Natsem20), which is thehighest level of injury (life threatening). In this scenario, it does not matter what levelof damage a residence receives or what personal characteristics are, as every CensusDistrict has 100% high vulnerability, as shown in Figure 4.9. This is reasonable, <strong>for</strong> itcan be presumed that <strong>for</strong> a person with life threatening injuries, vulnerability will behigh regardless of other socio-economic variables.Scenario 4, which is based on an injury that requires hospitalisation but expectedto recover and none to slight residence damage, shows an average of between 0%to 20% highly vulnerable people within the census districts. When compared withScenario 5, Figure 4.7, which has the same level of injury but the next level of residencedamage (moderate instead of slight), the percentage of highly vulnerable increases toan average between 40% to 70%. This increase in the percentage of people perceivedto be highly vulnerable indicates that damage to residence is an extremely importantfactor in the perception of ability to recover.Scenario 6, Figure 4.8, which also has the same level of injury as Scenarios 4 and 5but much higher residence damage (from extensive damage to complete destruction),has an average of 70% to 90% highly vulnerable people. Again, this may be due to theimportance of house insurance in the decision tree analysis, however it is also due to54
55Figure 4.3: Scenario 1. This scenario visualises the estimated high vulnerability Census District areas when both injury and residence damage are relatively minor.
56Figure 4.4: Scenario 2. This scenario visualises the estimated high vulnerability Census District areas when injury is relatively minor and residence damage is significant.
57Figure 4.5: Scenario 3. This scenario visualises the estimated high vulnerability Census District areas when injury is minor and the residence is completely destroyed.
58Figure 4.6: Scenario 4. This scenario visualises the estimated high vulnerability Census District areas when injury is moderate and residence damage is zero to slight.
59Figure 4.7: Scenario 5. This scenario visualises the estimated high vulnerability Census District areas when both injury and residence damage are moderate.
60Figure 4.8: Scenario 6. This scenario visualises the estimated high vulnerability Census District areas when injury requires hospitalisation and residence damage is extensivelydamaged to completely destroyed.
Figure 4.9: Scenario 7. This scenario visualises the estimated high vulnerability Census District areas when injury is life threatening, regardless of the condition of theresidence.61
Percentage of CD in highly vulnerable group1009080706050403020Series1Series2Series3Series4Series5Series6Series7Series8Series9Series10Series11Series12Series13Series14Comparison between 10 CDs across the 7 Scenarios100Sce_1 Sce_2 Sce_3 Sce_4 Sce_5 Sce_6 Sce_7Scenario TypeFigure 4.10: Comparative graph of 14 census districts in the study area across the 7 scenarios. Thegraph demonstrates that although injury and damage do provide the greatest influence on the vulnerabilitylevels of each census district, other factors contribute to changes in vulnerability.income, tenure type and age, which are the next most significant indicators. The combinationof these indicators, according to the 11 decision rules of high vulnerability,will influence the percentage of highly vulnerable people in the mapped areas.Example Census DistrictsIn order to further explore the Census Districts within and across scenarios, each ofthe seven scenario maps has 14 selected Census Districts that have been numberedfrom 1-14. These Census Districts show a cross-section of the Wanneroo area, withCensus Districts 1 to 3 and 11 to 14 located in the central to central-south of the studyarea in some of the more recently developed suburbs. Census Districts 4, 5 and 6 areadjacent and are located along one of the main roads in the study area, while CensusDistricts 7 to 10 are also adjacent and located on the central coast of the study area inone of the more established parts of the Wanneroo study area. Each of the 14 CensusDistricts exhibit diverse vulnerabilities within each scenario and across scenarios, asis demonstrated in Figure 4.10.The graph shows the 14 Census Districts across the seven scenarios. Census District1 is an anomaly and can be explained, in part, by the abnormally low numberof households (21) compared with the average of 200 per Census District. The graphalso demonstrates that even though each scenario of fixed residence damage and injuryinfluences vulnerability, as does the combination of socio-economic factors, the rateof change in vulnerability <strong>for</strong> each Census District is also different. This confirms that62
some of the 11 high vulnerability decision rules are more relevant in some scenariosthan others, according to certain injury and damage levels. The rate is different <strong>for</strong>Census District 2, in the newer development area, compared with Census District 8,which is in the coastal, more established area.Damage and InjuryCensus District 2 has the highest percentage of high vulnerability households (ignoringCensus District 1) in Scenarios 1, 2, 3 and 4. These scenarios have lower levelsof injury but high residence damage. However, Census District 9, which had lowervulnerability levels than Census District 2 in those scenarios, has a greater number ofhigher vulnerability households <strong>for</strong> scenarios 5 and 6. These scenarios, while also <strong>for</strong>high levels of residence damage, are also <strong>for</strong> higher injury damage. The decision treerules, as shown in Figure 3.6 in the previous chapter, demonstrate that when injurylevel is high, age becomes more relevant to vulnerability. That is, people over 48 and64, acknowledging other relevant attributes, may be more vulnerable when the hazardimpact causes a moderate to high level of injury.Figures 4.11 and 4.12 provide a comparison of the vulnerability of Census Districtswhen injury is relatively high (Scenarios 4, 5 and 6) and when damage is relatively high(Scenarios 2, 3 and 6). The maps exhibit that, regardless of higher levels of injury ordamage, other attributes, represented by the vulnerability indicators, are important indetermining social vulnerability. When injury is high, most of the Census Districts inthe study area have an average of between 40% to 60% of households in the high vulnerabilityclass. The cluster of lower household vulnerability, as indicated by the blue(20% to 40%) in Figure 4.11, is <strong>for</strong> newer suburban growth in the south-central region.This may relate to the fact that the decision tree determined when injury is significant,older age is an important attribute indicating vulnerability. The newer suburban areasin the Wanneroo area attract younger families and couples, thus reducing the averageage of the Census Districts.When residence damage is higher, most of the Census Districts in the study areahave an average of between 30% to 50% of households in the high vulnerability class.<strong>Vulnerability</strong> to a natural hazard impact is, on average, less when residence damage ishigh compared with high injury. However, as it is not the case <strong>for</strong> every Census Districtas the vulnerability is dependant on the relationship of the other 13 social vulnerabilityindicators.4.6 Using the resultsThe four-step <strong>methodology</strong> outlined in this report is intended to be integrated into abroader risk assessment, as outlined in the Introduction. However, it is also hopedthat the <strong>methodology</strong> is an example of a useful quantitative vulnerability assessmentthat can be used to manage some of the social issues, such as the vulnerability of anindividual within a household, relevant to impacts from a natural hazard. There<strong>for</strong>e,the next chapter will explore some of the issues surrounding application, validationand usefulness of this social vulnerability assessment <strong>methodology</strong>.63
64Figure 4.11: Percentage of vulnerable households in each Census District, when Injury is high (Scenarios 4, 5 and 6).
65Figure 4.12: Percentage of vulnerable households in each Census District, when Residence Damage is high (Scenarios 2, 3 and 6).
Chapter 5DiscussionThis report has presented a new approach to measuring the vulnerability of an individualwithin a household to natural hazards. The need to explore a new approachhas been driven by two significant factors; firstly, to value-add to the hazard modeldevelopment undertaken at Geoscience Australia. Risk model development aims toencompass all aspects of natural hazards in order to provide a comprehensive risk assessment<strong>for</strong> government decision makers. Secondly, the study hopes to contribute tothe ongoing development of vulnerability assessments that assist decision makers insafeguarding communities. Exploring methods <strong>for</strong> better understanding who is at riskin our communities will ultimately lead to better risk management by government andlocal decision makers.The report has introduced a four step <strong>methodology</strong> to measuring the vulnerabilityof an individual within a household, involving;• 1. Indicator Selection• 2. Risk Perception Questionnaire• 3. Decision Tree Analysis• 4. Synthetic EstimationWith future refinements and developments, such an approach has the potential tocontribute to policy development affecting natural hazard management at a governmentlevel.This final chapter will provide a synopsis of the results outlined in the previouschapter and present two possible methods of validation <strong>for</strong> the Perth case study application.The chapter will then conclude with a review of each of the four steps, outlininglimitations and areas <strong>for</strong> future development and refinement.The results of the application of the quantitative <strong>methodology</strong> to the Perth casestudy are introduced in the previous chapter. As any study into the vulnerability of acommunity to natural hazards demonstrates, there is no single answer - vulnerabilityis dynamic and depends a range of factors. However, the results demonstrate thatvulnerability can be explored and represented quantitatively. <strong>Social</strong> vulnerability tonatural hazards, in this study, is represented by perception to risk, as was demonstrated66
in the finding that the main factor contributing to a person’s ability to recover is injurystate and residence damage.This study has challenged some of the assumptions about the personal attributesthat contribute to a person’a ability to recover from a natural hazard, <strong>for</strong> example, asidefrom a life-threatening injury, no single factor makes a person vulnerable. Financialindicators were the most significant after injury and residence damage, and yet theirrole in vulnerability depends on other factors. For example, having a mortgage mayonly make you vulnerable if you are of retirement age and have no house insurance(Decision Rule 5). Being over the age of 60 may only contribute to vulnerability ifyou sustain an injury that requires treatment (Decision Rule 2). Renting a home mayincrease your vulnerability if you are moderately injured and over 65 (Decision Rule10), as you may have more immediate financial commitments. However, renting maylessen your vulnerability if you are younger than 43 and your house was destroyed,compared with those of the same age who owned their destroyed home but did nothave insurance (Decision Rule 9).5.1 Comparison with the Cities Project <strong>methodology</strong>The Cities Project <strong>methodology</strong> is different from the <strong>methodology</strong> introduced in thisreport, especially with regards to some of the indicators used, the weighting of indicatorsand the classes of vulnerability. However, the objective is the same <strong>for</strong> bothmethodologies; producing a vulnerability map of a spatial community that can be integratedinto a multi-hazard assessment and which has the potential to be used byemergency managers, policy developers and town planners.To provide a comparison, the Cities Project <strong>methodology</strong> as outlined and detailedin Granger and Hayne [28], was applied to the same 224 Census Districts in the Wannerooarea of Perth, Western Australia. As per the <strong>methodology</strong> in this report. the1996 census data was used to ensure consistency. The Cities Project <strong>methodology</strong>presents final results of a community’s vulnerability in one final map, referred to asthe ‘Community <strong>Vulnerability</strong> Index’. For the Wanneroo case study area, the map ofthe ‘Community <strong>Vulnerability</strong> Index’ is presented in Figure 5.1.The Cities Project <strong>methodology</strong> uses a different indicator list from the one used inthis study. There<strong>for</strong>e, some attributes of the community investigated are not referredto in one study or the other, making a direct comparison impossible. The Community<strong>Vulnerability</strong> Index mapped in Figure 5.1 has Census Districts ranked from 0 to 50,which is different from the percentage vulnerability ranking used in the <strong>methodology</strong>explored in this report.The Community <strong>Vulnerability</strong> Index has greater variability in Census District vulnerabilitycloser to the coast than inland, similar to the mapped Scenarios 2, Figure4.4, and 4, Figure 4.6 in this study. However, any further comparison is difficult dueto the different indicators used to arrive at the results <strong>for</strong> both the Cities <strong>methodology</strong>and the this report.67
68Figure 5.1: The Community <strong>Vulnerability</strong> Index <strong>for</strong> the Wanneroo study area using the Cities Project vulnerability <strong>methodology</strong>
5.2 Limitations and future workLike any experimental <strong>methodology</strong>, this study has raised some questions that need tobe explored in future research in order to refine vulnerability assessment development.Each of the four steps explored in this report have posed some questions and havehighlighted areas <strong>for</strong> further work in future studies. While this vulnerability assessment<strong>methodology</strong> is intended to be layered with hazard and economic assessmentsin order to gain a better insight into risk from a natural hazard, the steps taken can beaddressed in their own right. Some of these points <strong>for</strong> further work are outlined in thefollowing:5.2.1 Indicator SelectionThe indicators were selected from a broad literature review and were selected accordingto the criteria outlined in Chapter Two. They have also been selected according totheir relevancy and applicability to the Australian urban environment. Any investigationinto social vulnerability to natural hazards in regional and rural Australia, or othercountries, would need to incorporate other vulnerability indicators more relevant to theneeds of those communities. This could include issues such as distance to services andassets vs cash-flow, especially <strong>for</strong> those employed in the agricultural industry.The indicators used in this study explore social vulnerability at the individual andhousehold level. However, <strong>for</strong> a broader representation of social vulnerability to naturalhazard impacts, the development of community vulnerability indicators (such as resourceavailability, social capital measures) and regional vulnerability indicators (suchas dependency on regional economy, access to service areas) would be important.5.2.2 Risk Perception QuestionnaireThe development of the questionnaire was undertaken primarily to test a <strong>methodology</strong>,that is, to test whether there is a possible technique that focuses on predominantly objectivemeasures of investigating the relationship between vulnerability indicators. Assuch, the main focus of this research is to explore quantitative and analytical methods,rather than profess expertise in the discipline of sociology, in particular, questionnairedevelopment. Points raised by Schuman and Presser in developing social surveys weretaken into account and can be referred to in Schuman [62]. There<strong>for</strong>e, this study acknowledgesthat if this method demonstrates to be a viable means of obtaining data<strong>for</strong> decision tree analysis and as a result, provides a fair technique <strong>for</strong> representingvulnerability, then improvements to the questionnaire that must be made include:• Developing, with the expertise of sociologists and social survey experts, a morecomprehensive and conventional questionnaire.• Clarify the scenarios presented as per person or per household. The currentscenario of hypothetical individuals utilises data that refers to both a person andto a household and may influence or confuse final results.• Investigate further methods that could be used to capture ‘perception’ of vulnerabilityor risk. A realistic data set based on factual data after a natural hazard69
impact (including recovery time) would be the ideal data set, but does not currentlyexist. In the event of a natural hazard impact, it would be highly desirableto instigate a post-disaster data collection project based on the 15 selected indicators.The questionnaire used data that was representative of the Australian population.As a result, some attributes, such as disability and poverty, which represent a smallpercentage of the population, may not have been adequately represented in a smallquestionnaire distribution. Future questionnaire development and distribution mayneed to take into account overall population statistics as well as representative distributionsamples. One possibility could be to have these variables ranked differentlyby questionnaire respondents and been assigned greater importance in the decisiontree. Disability <strong>for</strong> example occurred in only 10% of the hypothetical cases and wasranked twelfth out of the thirteen socio-economic variables by the decision tree. Thedata are crucial to the final result.5.2.3 Decision Tree AnalysisDecision tree analysis was used <strong>for</strong> interrogating data in this study, as the main purposeof the analysis technique is to sort and classify the data. It was also selected over othertechniques, such as neural networks, as it is considered simpler, especially with regardsto the application in this study.The decision tree analysis investigated the relationships between the 15 selectedindicators of vulnerability. However, as noted in Chapters One and Two, two of theindicators, Injury and Residence Damage, are more outcome-dependent than the otherindicators. While these two indicators are essential in establishing the possible effectsof a natural hazard, they greatly influenced the perceived importance of social vulnerabilityas they were ranked as the two most important indicators. When adequate andcomprehensive hazard models are available, injury and damage will be established usingprobabilistic methods specific to certain areas. As such, these two indicators canbe removed from the questionnaire and replaced with a probability of impact. Thiswill both influence the impact on the household and their recovery and influence thedecision tree analysis results. However, until such hazard models are available, it isimportant to provide a context <strong>for</strong> social vulnerability to natural hazard when investigatingperceptions of risk.5.2.4 Synthetic estimationSynthetic estimation was used in this study to estimate the socio-economic profiles ofeach Census District as well as to estimate vulnerability to a natural hazard. It wouldbe interesting to examine the synthetic estimates of selected variables, which werenot used in the decision rules, to see if their relationship with the synthetic estimatesof vulnerability accords with expectations. This comparison could be per<strong>for</strong>med onparticular Census Districts (of a reasonable size) that consistently appear in the highor low vulnerability class across scenarios. Such an assessment might provide insightsinto which variables should be considered in future studies.70
5.3 Areas <strong>for</strong> refinement and further analysisStephen and Downing [64] argue that good vulnerability assessments must measure theright things, at the right scale, with suitable conceptual underpinning”. The <strong>methodology</strong>explored in this report has attempted to achieve this, while also ensuring that it hasa real application to a spatial community. However, of course, there are some issuesthat need further exploration, such as:• What is the best scale <strong>for</strong> emergency management and effective disaster mitigationplanning? Perhaps SLA (Statistical Local Area) is more effective ormanageable than Census District? Should we focus on individual vulnerabilityor household, community, regional vulnerability?• Which decision rules are relevant to specific Census District areas with higherpercentages of highly vulnerable people? While the decision tree has notedfinancial indicators, outside of injury and residence damage, as the most significantattributes to vulnerability, which areas are they more important in?• What other factors, such as political climate, local government policy, emergencyservice capabilities and welfare services, will contribute to a person’sability to recover from a natural hazard impact?• Which personal attributes as listed by the vulnerability indicators, can be influencedprior to a hazard impact in order to lessen vulnerability? For example,can mitigation issues address house insurance, health insurance and income (interms of providing greater welfare services) be<strong>for</strong>e the impact?These questions need to be further addressed in order to better refine vulnerabilityassessments and their role in natural hazard risk management. With regards to the<strong>methodology</strong> development, there are also some areas which could be refined in futurestudies, including:• Analysing the selected indicators of vulnerability <strong>for</strong> applicability and developingindicators that are community/location specific, as was done in the Yohannesand Webb [69] Ethiopian vulnerability assessment.• Refine the risk perception questionnaire and distribute to a wider audience.• Validation of the vulnerability map results with a wider audience, such as welfareofficers, community services and managers involved in the area being assessed.The international literature which has been referenced in this report, alongside themany other studies of vulnerability to natural hazards and other large-scale disasters,continuously highlight the complex issues surrounding methods of assessment. Thisreport acknowledges these concerns, while also arguing the need to continue tryingnew approaches. It is only through ongoing investigations and experimental applicationsthat we will be able to gain a better understanding of how to contribute to moreresilient communities in the event of natural hazard impacts.71
Appendix ARisk Perception QuestionnaireMeasuring community impact to natural hazards: Developing a quantitative modelto contribute to disaster risk managementThis survey is part of Geoscience Australia Urban Risk Group’s research into understandingthe risk posed to communities from natural hazards. The impact of natural hazards onpeople within a community has long been recognised as a difficult assessment to make. Eachperson has different lifestyle characteristics that contribute to how they experience and recoverfrom an extreme event. For the purpose of this study, the impact shall be considered in termsof ability to recover, that is, how long it would take someone to return to a similar lifestyle situationprior to the natural hazard impact. It is anticipated that some people will take little timeto recover while others may never return to a similar lifestyle prior to the impact and there<strong>for</strong>ehave an indefinite recovery period.The aim of this study is to try and capture your perception of a person’s ability to recoverfrom a natural hazard impact based on combinations of a small selection of lifestyle characteristics.For each of the hypothetical individuals presented overleaf, created from AustralianCensus data, please rank your perception of the individual’s recovery ability <strong>for</strong> each of the 4natural hazards. Assume that the individual lives in an urban community in an industrialisednation and that no essential services have been completely destroyed so that each person hasaccess to medical, welfare and other services if required. The hypothetical individuals havebeen created randomly from a program so that every individual in every survey distributed isunique. The greater the number of individuals ranked, the greater our understanding of vulnerabilitymay be, and there<strong>for</strong>e your input is very important.At the extremes, 1-2 denotes very little disruption, 4-5 represents sufficient time to interruptlife and 9-10 represents a person’s inability to recover from the impact of the naturalhazard. There are no correct or incorrect answers only your perception of recovery ability. Anexample is below:Person 10 is a male aged 46, is employed, earns $328 a week and is running into debt. They liveas a couple with no dependents and own with no mortgage a house with houseinsurance and has 1car. This person does not have health insurance, does not have a disability and speaks English well.Due to the hazard impact, this person requires hospitalisation and is expected to recover and theirresidence is slightly damaged. According to the recovery scale, indicate how long do you think itwill take <strong>for</strong> this person to recover from the following impact?• A destructive earthquake (1-10)....7.. A major flood(1-10)....6..• A major landslide (1-10)....5.. A major cyclone (1-10)....6..Please indicate if you have been exposed to a:• Major flood..... Destructive earthquake.....• Major landslide..... Major cyclone..... Another major hazard.....Thank you very much <strong>for</strong> your time72
Person 1001 is a male aged 72, is not employed, receives $112 a week and is drawing onsavings. They are single and live in group housing and own with no mortgage a house withhouseinsurance and has 0 cars. This person does not have health insurance, does not have adisability and speaks English well. Due to the hazard impact, this person sustained no injuriesand their residence is not damaged. According to the recovery scale, indicate how long do youthink it will take <strong>for</strong> this person to recover from the following impact?• A destructive earthquake (1-10).....• A major flood (1-10).....• A major landslide (1-10).....• A major cyclone (1-10).....Person 1002 is a male aged 37, is not employed, receives $275 a week and is makingends meet. They are single and live in group housing and own with no mortgage a house withhouseinsurance and has 0 cars. This person does not have health insurance, does not have adisability and speaks English well. Due to the hazard impact, this person requires basic medicaltreatment without hospitalisation and their residence is moderately damaged. According to therecovery scale, indicate how long do you think it will take <strong>for</strong> this person to recover from thefollowing impact?• A destructive earthquake (1-10).....• A major flood (1-10).....• A major landslide (1-10).....• A major cyclone (1-10).....Person 1003 is a female aged 42, is not employed, receives $1315 a week and is makingends meet. They live as a couple with dependent children and privately renting a house withcontents insurance and has 3 cars. This person does not have health insurance, does not havea disability and does not speak English. Due to the hazard impact, this person requires hospitalisationand is expected to recover and their residence is slightly damaged. According to therecovery scale, indicate how long do you think it will take <strong>for</strong> this person to recover from thefollowing impact?• A destructive earthquake (1-10).....• A major flood (1-10).....• A major landslide (1-10).....• A major cyclone (1-10).....Person 1004 is a female aged 40, is employed, earns $347 a week and is saving a lot. Theyare single and live in group housing and own with no mortgage a house with no houseinsuranceand has 1 car. This person does not have health insurance, does not have a disability andspeaks English well. Due to the hazard impact, this person requires hospitalisation with lifethreatening injuries and their residence is completely destroyed. According to the recoveryscale, indicate how long do you think it will take <strong>for</strong> this person to recover from the followingimpact?• A destructive earthquake (1-10).....• A major flood (1-10).....• A major landslide (1-10).....• A major cyclone (1-10).....73
Person 1005 is a female aged 25, is not employed, receives $320 a week and is drawing onsavings. They live as a couple with no dependents and own with no mortgage a semi-detachedone storey townhouse with no houseinsurance and has 1 car. This person does have healthinsurance, does not have a disability and speaks English well. Due to the hazard impact, thisperson requires hospitalisation and is expected to recover and their residence is completelydestroyed. According to the recovery scale, indicate how long do you think it will take <strong>for</strong> thisperson to recover from the following impact?• A destructive earthquake (1-10).....• A major flood (1-10).....• A major landslide (1-10).....• A major cyclone (1-10).....Person 1006 is a female aged 42, is employed, earns $811 a week and is making endsmeet. They are single and live in group housing and privately renting a house with no contentsinsurance and has 3 cars. This person does not have health insurance, does not have a disabilityand speaks English well. Due to the hazard impact, this person sustained no injuries and theirresidence is moderately damaged. According to the recovery scale, indicate how long do youthink it will take <strong>for</strong> this person to recover from the following impact?• A destructive earthquake (1-10).....• A major flood (1-10).....• A major landslide (1-10).....• A major cyclone (1-10).....Person 1007 is a male aged 23, is employed, earns $729 a week and is saving a little.They live as a couple with no dependents and rent from a housing trust a house with contentsinsurance and has 1 car. This person does not have health insurance, does not have a disabilityand speaks English well. Due to the hazard impact, this person requires hospitalisation and isexpected to recover and their residence is slightly damaged. According to the recovery scale,indicate how long do you think it will take <strong>for</strong> this person to recover from the following impact?• A destructive earthquake (1-10).....• A major flood (1-10).....• A major landslide (1-10).....• A major cyclone (1-10).....Person 1008 is a female aged 78, is not employed, receives $153 a week and is running intodebt. They live alone and privately renting a semi-detached one storey townhouse with contentsinsurance and has 0 cars. This person does have health insurance, does not have a disabilityand speaks English well. Due to the hazard impact, this person requires hospitalisation withlife threatening injuries and their residence is moderately damaged. According to the recoveryscale, indicate how long do you think it will take <strong>for</strong> this person to recover from the followingimpact?• A destructive earthquake (1-10).....• A major flood (1-10).....• A major landslide (1-10).....• A major cyclone (1-10).....74
Person 1009 is a male aged 60, is employed, earns $594 a week and is making ends meet.They live as a couple with no dependents and privately renting a house with contents insuranceand has 0 cars. This person does not have health insurance, does not have a disability andspeaks English well. Due to the hazard impact, this person requires hospitalisation with lifethreatening injuries and their residence is completely destroyed. According to the recoveryscale, indicate how long do you think it will take <strong>for</strong> this person to recover from the followingimpact?• A destructive earthquake (1-10).....• A major flood (1-10).....• A major landslide (1-10).....• A major cyclone (1-10).....Person 1010 is a female aged 39, is employed, earns $434 a week and is making ends meet.They live as a couple with no dependents and own with no mortgage a house with houseinsuranceand has 1 car. This person does not have health insurance, does not have a disabilityand speaks English well. Due to the hazard impact, this person requires hospitalisation withlife threatening injuries and their residence is moderately damaged. According to the recoveryscale, indicate how long do you think it will take <strong>for</strong> this person to recover from the followingimpact?• A destructive earthquake (1-10).....• A major flood (1-10).....• A major landslide (1-10).....• A major cyclone (1-10).....75
Appendix BDecision Tree MethodologyIdentifying attributes that are perceived to make a person vulnerable is considered here tobe a ‘Knowledge Discovery in Databases’ exercise. Knowledge discovery is defined as ‘thenon-trivial extraction of implicit, unknown, and potentially useful in<strong>for</strong>mation from data’ [27]and refers to techniques developed to trans<strong>for</strong>m large quantities of data into useful and understandablein<strong>for</strong>mation [68]. One such technique <strong>for</strong> extracting useful knowledge from data isthrough data mining techniques, which refer to a class of algorithms used to identify patternsin data. The primary purpose of data mining is predictive modelling, a task which seeks toestablish a functional relationship between two sets of attributes in a database in order to predictvalues of one of the sets based on values of the other. Usually, one variable is selectedas the target or response variable and the resultant predictive model can be used to establishthe outcome of the target given any combination of the predicting attribute values. When theresponse variable is categorical, that is there are a fixed set of outcomes, one speaks of a classificationproblem. When it is continuous, there are an infinite number of outcomes, usually areal number, the problem is said to be a regression problem, where one wants to predict a realnumber.Decision tree induction is one of the most widely used Knowledge Discovery predictivetechniques because it;• Can handle both discrete (a value which has a finite number of distinct values, suchas the number of cars owned, whether or not someone has house or health insurance)and continuous data (a value which has an infinite number of possible values within aninterval, such as income, age and injuries)• Makes no assumption as to the shape or <strong>for</strong>m of the distribution of the underlying data,• Is fast and efficient,• Is robust with regards to missing values and noisy data,• Is straight<strong>for</strong>ward to interpret and comprehend,• Can provide an indication of attributes that are most important <strong>for</strong> prediction or classification,and• Is nonparametric: Decision trees do not require additional in<strong>for</strong>mation (such as a functional<strong>for</strong>m) besides that already contained in the data set.The major weakness of decision tree induction (as well as other nonparametric methods)is that it is prone to errors in classification if many classes are involved or if there is a relativelysmall training data set.76
Figure B.1: Data structure in decision tree induction.Decision tree constructionDecision tree construction, referred to as induction, attempts to identify prediction rules froma set of observations collected from a population. The individual observations are called ’instances’and a set of observations is called the ’data set’. Let D = {(x i ,y i ), i =1,...,n}be a data set that contains n instances, also known as ’records’ or ’examples’ or ’events’. Allinstances must have the same number of attributes (also denoted indicators) and a ’class label’,’concept’ or ’target variable’ here denoted as y i , i =1,...,n. However, it is not essentialthat each attribute has a value. Each record is characterized by a vector x =(x 1 ,x 2 ,...,x d )of d attribute values x k and a class label y. In the case of a classification problem the label ischosen from a finite set y ∈{y 1 ,y 2 ,...,y c } of c classes. The space of all n instances is calledthe ’instance space’. The attribute space represents the dimensionality of the space, d, witheach attribute supplying a single dimension.An attribute value x k ∈ x may be either continuous consisting of integers or real numbers,or categorical which is a set of values. Figure B.1 illustrates a typical instance space containinginstances, class labels and continuous and categorical attributes. The classification problem canbe stated <strong>for</strong>mally as the task of finding a classification model f : x → y. This is simply amapping of the set of attributes into one of the class labels.A decision tree analysis recursively partitions, or splits, the instance space into increasinglyhomogeneous disjoint subsets with the aim that each subset should contain as many instanceswith one class label as possible. This notion is often referred to as ’purity’. Each subset is thenassigned to one class based on the class of the majority of instances. Typically, more than onesubset is assigned to the same class. Those subsets correspond to different ways that a class canbe reached. Starting at the root node, which contains the entire data set, all attributes are testedto see which attribute is the best <strong>for</strong> partitioning, or splitting, the data into two different andmore homogeneous subsets. Moreover, <strong>for</strong> each attribute the best splitting value is determined.A visual representation of this concept is shown in Figure 3.3 in Chapter Three.The process of selecting a new attribute and splitting the data set is now repeated this timeusing only the data set associated with each internal node. The recursive algorithm picks thebest attribute and the best split and never looks back to reconsider earlier choices. This processcontinues until the instances associated with each terminal node or leaf node all have the sametarget class label. The resulting tree is referred to as the maximal tree. Each branch represents a77
ule, which progressively refines the classification and can also be used to classify future data.The structure of a decision tree and its components; the root node, branch, decision andleaf nodes are shown in Figure 3.4. Once built, a decision tree can be used to classify aninstance by starting at the root node of the tree and moving through it until a terminal node isencountered. The class assigned to each terminal node then corresponds to a predicted outcome<strong>for</strong> the instance in question.Rule Based ClassifiersThe purpose of a classification technique is to find the appropriate classification model thatsummarizes the relationship between a set of attributes and the class. The classifier is definedby a set of rules. Decision tree induction is a supervised learning classifier which can beconverted into rules that represent a summary of the knowledge content of the data. The rulesin a classifier are determined by the path from the root to a leaf node of a decision tree, withone rule created <strong>for</strong> each branch along the path. All paths taken can be expressed as nested‘if-statements’, which can be interpreted as rules.Most decision tree induction algorithms are based on the original work of Hunt et al. [36].Other well known decision tree algorithms are CART [9], C4.5 [60] and OC1 [46]. Thesealgorithms differ in the way they handle missing attribute values, continuous attributes, thesplitting criteria and how they establish the size of the tree.PruningThe maximal tree will do the best possible prediction on the data set it was trained on, i.e.every instance will be correctly classified by following the generated rules. This is referredto as 100% predictive accuracy or a misclassification rate of 0.0. The misclassification rate isdefined as the ratio of instances that were classified wrongly to the total number of instancesn.However, a maximal tree is unlikely to classify new data very well because it has been tailoredto the idiosyncrasies of one particular data set. Data sets contain a certain amount of noisewhich can arise from errors in measuring the attribute and class values of an instance. Thereis also the uncertainty in the selection of the attribute set and not all the relevant properties ofan instance are known. If a classifier fits the instances too closely, it may fit noisy instancesinstead of a sample from the population. This is undesirable because the decision tree may notnecessarily fit other data sets from the same population equally well. This phenomenon is wellknown in data mining as ’over-fitting’ and poses a challenge to all predictive and regressionmodels [6]. The success of any predictive model depends on its ability to distinguish betweennoisy instances and patterns in the data.The remedy <strong>for</strong> over-fitting is the use of a separate test data set together with a pruningtechnique where parts of the tree are eliminated. The premise is that both the training and testdata sets will contain similar errors or noise. The misclassification error on the test set is thencalculated <strong>for</strong> every sub-tree (sharing the same root) and the subtree with the smallest error isselected <strong>for</strong> the final model.While the misclassification error with respect to the training data will decrease with thetree’s complexity, the error with respect to the test set will find an optimum somewhere betweenthe root of the tree and the maximal tree. When the size of the tree is too small, under-fittingoccurs. An under-fitted decision tree will per<strong>for</strong>m poorly on the training data set as well as anindependent data set. When the size of the tree is too large, over-fitting occurs. An over-fitteddecision tree will per<strong>for</strong>m perfectly on the training data set but poorly on the independent dataset. The pruned tree has the optimal size and is expected to per<strong>for</strong>m well on both training andtest data. Not only does this final pruned tree per<strong>for</strong>m well as a predictive model, the numberof instances supporting each subset will be larger than those of the maximal tree and the rulesderived from it will be less complex than those of the maximal tree.78
In cases where a test set is not available or if the number of instances is so small that onecan not be obtained by sampling one can use a technique called ’k−fold cross-validation’. Thedata set is divided into k subsets. The decision tree is built on k −1 subsets and the model erroris evaluated on the remaining subset serving as a test set. This procedure is repeated until eachsubset has been used once as the validation set. The model error is the average error made <strong>for</strong>the k simulations.Attribute Selection CriteriaAttribute selection is one of the basic issues in decision tree learning. The attribute selectioncriteria is used to establish which test condition provides the best split of a collectionof instances into a smaller set. Attributes which provide poor overall per<strong>for</strong>mance are eitherignored or are embedded deep within the tree.One strategy <strong>for</strong> ensuring that the attributes provide the greatest in<strong>for</strong>mation about theclass label is to select a suitable attribute that will ‘split’ the data set. The gain in in<strong>for</strong>mationimplies a reduction in uncertainty. In general, the amount of in<strong>for</strong>mation gained is inverselyproportional to the probability of that event. For example, relative to what is expected, more islearnt from being told a relatively unlikely event has occurred.Let c i denote the number of instances from class y i , n j the number of instances in treenode j and c ij the number of instances in node j from class y i . An estimate of the probabilityof obtaining these values from a data set is given byp ij = n ijn ,p i = n in , and p j = n jn .An estimate of the probability of an instance in node j belonging to class i is there<strong>for</strong>ep i|j = c ijn j.(B.1)(B.2)If, <strong>for</strong> example, all classes are equally represented in node j then p i|j =1/c, i =1,...,c.Ingeneral∞∑p i|j =1<strong>for</strong> all ji=−∞The degree of heterogeneity or impurity in each node can be defined in several ways leadingto a number of splitting strategies that can be employed in the search <strong>for</strong> the best splitter.An important splitting rule used in this study is the Gini Index. The Gini index used in CART[9] is simple, per<strong>for</strong>ms well in general and is suggested as the default splitting rule in CART.The Gini index is defined byGini(j) = 1−c∑i=1p 2 i|j(B.3)If all instances of S belong to the same class then p i|j =1<strong>for</strong> that i, the remaining classprobabilities would be zero and the the Gini index would be 0 corresponding to no diversity innode j. On the other hand, if node j contained equal numbers of each class p i|j =1/c,wherecis number of classes, the Gini index would attain the maximum value 1 − 1/c corresponding tothe greatest possible diversity or impurity of that node. Let <strong>for</strong> example node 1 have c 11 =60,c 21 =40and node 2 have c 12 =7, c 22 =3, then Gini(1) =1 − (0.6 2 +0.4 2 )=0.48 andGini(2)=1 − (0.7 2 +0.3 2 )=0.42. Node 2 is thus ’purer’ according to the Gini index.Splitting DataAs the instances are split into smaller subsets then the impurity measures <strong>for</strong> the subsets shouldalso reduce. This is a result of the subsets becoming purer as the split continues. Ultimately79
a subset will contain instances from the same class only and further splitting is meaningless.In addition, the larger the reduction in the impurity resulting from splitting, the more discriminatingthe test condition. These conditions lead to a splitting function which is the differencebetween the weighted average impurity measure of the nodes be<strong>for</strong>e (parent nodes) and after(children nodes) splitting. The splitting function is given by:Splitting function ∆=I(parent) − I(children)(B.4)in which I(.) is the impurity measure given, <strong>for</strong> example by (B.3). The splitting function iscalled the ’in<strong>for</strong>mation gain’ if entropy is used in (B.4). The attribute that produces the largestsplitting function which minimizes the impurity or maximizes the in<strong>for</strong>mation gain should beused as the next test condition.Missing ValuesMissing attribute values are a common problem in many data sets. Although instances thatcontain missing attribute values could be ignored, this may significantly reduce the data setand is there<strong>for</strong>e undesirable. One solution to this problem is to replace a missing attributewith the most common value among instances from the same class. An alternative, morecomplex procedure is to assign a probability to each of the possible values of x k rather thansimply assigning the most common value to the missing attribute. These probabilities can beestimated from the observed frequencies of the various values of x k among the instances at anode.Decision trees handle missing values by keeping track of ’surrogate splitters’, which aresplitting rules that closely mimic the action of a primary split. In the case of a missing value thebest surrogate split can be used to determine which branch to take. In cases where no surrogateis available the branch with the largest number of instances is taken.MaskingThe phenomenon of one variable hiding the significance of another is known as ’masking’.Masking can be revealed in two ways; either by rebuilding the tree without the primary splitter,or by computing an importance measure which is the sum of the improvement measures ateach node <strong>for</strong> each variable in its role as a surrogate splitter. If a variable scores high in theimportance measure without showing up in the tree it is an indication that it has been maskedby a primary splitter but would be able to contribute in case the primary splitter wasn’t. Theseissues become important if some variables are easy to collect while others are difficult.80
Appendix CMicrosimulationMicrosimulation models, such as MarketInfo, are generally used <strong>for</strong> predicting the immediatedistributional impacts of government policy change to various communities. The key use ofmicrosimulation models has been to predict the immediate impacts of changes in tax and socialsecurity policy. The models start with microdata i.e. ‘low-level’ population data; typicallythe records of individuals from a national sample survey conducted by a national bureau ofstatistics. This is one of the most important advantages of large scale microsimulation models.Being based on unit records, it is possible to examine the effects of policy changes <strong>for</strong> narrowlydefined ranges of individuals or demographic groups. Further, they can mirror the heterogeneityin the population as revealed in the large household surveys. The models can also be used to<strong>for</strong>ecast the outcomes of policy changes and what if scenarios, that is, the results can describewhat, under specified conditions, may happen to particular individuals and groups [11].Microsimulation modelling research findings are generally based on estimated characteristicsof the population. Such estimates are usually derived from the application of microsimulationmodelling techniques to microdata based on sample surveys. These estimates maybe different from the actual characteristics of the population because of sampling and nonsamplingerrors in the microdata and because of the assumptions underlying the modellingtechniques. The microdata do not contain any in<strong>for</strong>mation that enables identification of theindividuals or families to which they refer.ReweightingAs surveys are based on a sample of the population, each individual or household within thesurvey must be weighted to represent the total number of that type of household or personwithin the population (also called ‘grossing up’). In a similar manner, the same sample can bereweighted in order to be representative of a population within a small area.Reweighting can be created by an integer or fractional approach. In the integer approach,the appropriate number and type of households from the sample survey that best represent theparticular small area of interest are selected and each assigned a weight of one. Alternatively,all households within the sample can be given a small fractional weight so that the sum of allweights equals the population in the selected area and the sum of the fractional individuals orhouseholds best matches the characteristic profile of the area. The fractional method avoidsthe suspicion of a breach in confidentiality and may provide better data quality.The SYNAGI and MarketInfo reweighting approachThe SYNAGI (SYNthetic Australian Geo-demographic In<strong>for</strong>mation) model employs the fractionalreweighting method by using optimisation algorithms which iteratively generate a set of81
CharacteristicAgeTotal Individual IncomeMarital StatusLabour <strong>for</strong>ce status and gender (cross-tabulated)Country of birthOccupationFamily TypeStudent statusLevel of highest qualificationAge and income market segments (cross-tabulated)Housing typeHousing tenureHousehold sizeNumber of motor vehiclesLevel of mortgage repaymentsLevelofrentpaymentsTable C.1: Characteristics used in MarketInfo 2001 linkage variables[42, 43]weights that ‘best-fit’ the profile of the area [11]. The method entails identifying linkage variables(as explained below) in the survey of interest and the Census, recoding these variables tobe comparable with each other, and then reweighting the records in the survey in an iterativemanner until they create a match <strong>for</strong> the target variables in the Census <strong>for</strong> the area of interest.The MarketInfo model applies this method to the ABS 1998/99 Household ExpenditureSurvey (HES) and the 1996 ABS Census of Population and Housing Basic Community Profile(BCP). The MarketInfo techniques have an established reputation in commercial applications– such as market identification – and have also increasingly been used in socio-economic applications[42, 43].Linkage variablesSynthetic populations can be generated using any selection of variables that are common toboth the Census and the survey data. For example, age and sex could be used to reweightthe survey. This would result in synthetic populations of each area, such as a Census District,having the correct age and sex distributions. However, it is unlikely that this would result inreliable distributions of the other socio-economic variables in the survey. More importantly, itis unlikely that the synthetic populations would reliably represent vulnerability in each CensusDistrict, as age and sex alone are not good predictors of vulnerability. There<strong>for</strong>e, includingmore socio-economic variables in the reweighting procedure is essential in improving the representativenessof the synthetic populations. To improve the estimates further, certain linkagevariables have been chosen specifically <strong>for</strong> the application. For example, of the 15 social vulnerabilityindicators, some provide a ‘link’ between the census and survey data, ensuring thatthere are sufficient cross-tabulations of particular variables that are deemed to be importantdrivers. Some of the linkage variables that the MarketInfo model uses, which are common toboth the HES and BCP surveys and which have been drawn upon in this study, are listed inTable C.1.There are 68 linkage variables used in MarketInfo derived from the household and personalcharacteristics that are common to both the HES and BCP surveys. The characteristics aremostly single variables, but include some cross-correlated ones and are listed in C.1.82
Optimisation and convergenceThe optimisation process used in reweighting consists of three linked convergence algorithmsthat marginally change the values of the weights. This subsequently evaluates the changein value of the socio-economic linkage variables compared with the Census variables. Thefirst of the three algorithms focuses on each target sequentially with the aim of adjusting theweights and the resultant synthetic population closer to all target variables. This is the commontechnique known as ’iterative proportional fitting’. These weights are then used in the secondalgorithm that has a wider focus, evaluating the overall fit to all targets. The final algorithminvolves a multi-dimensional search <strong>for</strong> convergence by changing a pair of household weightsin a positive and/or negative direction.The evaluation measure is the absolute residual between each of the reweighted surveyvalues and the Census BCP target variables. In general terms, if the change in weights improvesthe fit to the Census targets the weights are accepted, otherwise the change in weights isrejected. This process is undertaken many times until the reweighted HES values converge onthe Census BCP variables. The objective is to minimise the difference. When population estimatesare derived from weights from a convergent run, the synthetic populations of each areahave the correct distributions <strong>for</strong> each of the linkage variables i.e. the survey values resemblethe Census values.MarketInfo Census District weightsMarketInfo 2001 updates the small area data from the 1996 Australian census to 2001 and linksit with the data from the ABS 1998/99 HES to produce a set of weights <strong>for</strong> the HES <strong>for</strong> eachCensus District <strong>for</strong> 2001. There are 34,410 Census Districts across Australia, with an averagesize of approximately 200 households.The linkage variables used to derive the weights must be appropriate <strong>for</strong> the derived variableof interest. The five socio-economic variables, which appear in the decision rules thatassign a person to the high vulnerability class, are all either linkage variables (income, tenuretype, age, household type), as shown in Table C.1, or considered closely associated with them(house insurance). Consequently, the synthetic data population counts <strong>for</strong> these variables areconsidered reliable.A set of weights (one <strong>for</strong> each of the HES survey records) has been generated by Market-Info <strong>for</strong> each Census District in the study area. The meaning of a weight w <strong>for</strong> a particularsurvey record <strong>for</strong> a particular Census District is that survey record represents w people orhouseholds in the Census District. Hence if that survey respondent is assigned to the highvulnerability class, w synthetic people in the Census District will be counted in that class.Further detailed in<strong>for</strong>mation on the microsimulation models used in this study andother applications can be found at the NATSEM website [47].83
Appendix DValidationThe decision rules and their interpretation, when applied to the Perth case study, are not withouttheir limitations and these will be discussed later. However, the main question surrounding anyapplication to a real spatial community such as Perth is, how do we know how valid this is?Unless an actual hazard impacts the community and all essential data is recorded, we willnever know <strong>for</strong> certain how vulnerable the community is. Yet we can endeavour to compareor validate the mapped scenarios by employing other methodologies or discussions with theLocal Government area in the Perth case study and these are detailed below.Methodology validationThe vulnerability estimates have relied upon data that has been modelled and manipulated atvarious stages of the four-step <strong>methodology</strong>, there<strong>for</strong>e it is very difficult to assess the resultsagainst another <strong>methodology</strong> in any comparative analysis. Yet, the authors also acknowledgethat validating the <strong>methodology</strong> introduced in this report is essential in <strong>methodology</strong> development.In their study of vulnerability to food access, Yohannes and Webb note that two methodshave been explored <strong>for</strong> the purpose of ’validation’ [69]. The first involves working closelywith local experts whose comments can help improve the reliability of subjective data uses[69]. The second is to analyse the indicators of vulnerability against ’observed benchmarkmeasures of crisis’, i.e. an actual event [69].The Perth case study area has not experienced a ’measure of crisis’ <strong>for</strong> which sufficientdata was collected, so the second method suggested by Yohannes and Webb [69] is not possible.However, the community vulnerability <strong>methodology</strong> employed by the Cities Project [28]has been externally reviewed, as discussed in Chapter One, and so will be used as a point ofcomparison <strong>for</strong> this study. There<strong>for</strong>e, by applying the Cities Project <strong>methodology</strong> <strong>for</strong> the Wanneroostudy area as a reference <strong>for</strong> discussion and obtaining the views of local ’experts’ will beused in order to at least explore avenues <strong>for</strong> validating the four-step <strong>methodology</strong> introducedin this report.1: Comparison with local experts’ knowledgeThe Wanneroo and Swan Local Govenment areas are active in their role as managers of hazardsand emergencies within their communities. One of the hurdles faced by Western Australian localgovernments is that current state legislation does not mandate local government to developand implement risk management strategies that incorporate natural hazards. Hence, limitedfunding and resources are available <strong>for</strong> developing comprehensive natural hazard and disasterrisk management strategies.For this study, maps of the Wanneroo case study area were posted to community workersin the Wanneroo Local Government. The maps asked the workers to indicate suburbs/areas84
of high, medium or low vulnerability by circling the area on the map. From working withand in the community everyday, the community workers’ develop a knowledge of the areasthey consider have ‘at risk’ or vulnerable people. While this is not related directly to naturalhazards, it was considered worth investigating whether or not the decision rules correlated withthe local government’s perception of ’at risk’ people.While some maps were returned, with comments, it was difficult to correlate the areasconsidered at risk, due to the ‘at risk’ people being quite different from the decision rules. Forexample, ‘at risk’ may refer to elderly people with low mobility, homeless teenagers and lowsocio-economic groups, yet these groups have not, in this study, been assessed <strong>for</strong> their vulnerabilityto natural hazards. There<strong>for</strong>e, it is worth noting that groups generally considered ‘atrisk’ in the community may be further affected by natural hazards, but have not been specificallyfocused on in this study. Hence, a comparison between the local perception of generalrisk and a study of specific hazard risk is difficult to ascertain in this situation.<strong>Social</strong> CapitalThe concept of ‘at risk’ within a community is explored in papers and studies on ‘<strong>Social</strong> Capital’.<strong>Social</strong> capital refers to the often intangible elements that increase our everyday resiliencein life, including trust in government, feeling safe in your neighbourhood, engaging with yourneighbours, volunteering, tolerance and maintaining strong social networks [65]. While a discussionon social capital is beyond the scope of this study, it is strongly related to the broaderand more intangible indicators of vulnerability, some of which were outlined as complex indicatorsin Table 1.5. Studies into the non-quantitative aspects of social vulnerability focus onsome of the intangible factors, now referred to widely as social capital, that broadly encompasssafety and security. Hence they are highly relevant to studies investigating social vulnerabilityto natural hazards and can be explored in further detail in Buckle [14], Pelling [58] andPhillips [59] <strong>for</strong> social vulnerability issues and natural hazards, or the ABS [55] and HarvardUniversity [49] <strong>for</strong> specific social capital reading.85
Bibliography[1] L. Anderson-Berry. Cyclone Rosita April 20 2000: Post Disaster Report. Technicalreport, James Cook University Centre <strong>for</strong> Disaster Studies, Queensland,Australia, 2000.[2] E. M. Andrews and S. B. Withery. <strong>Social</strong> Indicators of Well Being. Plenum Press,New York, USA, 1976.[3] M. Ankerst, M. Ester, and H. P. Kriegel. Towards and Effective Cooperation ofthe User and the Computer <strong>for</strong> Classification. In SIGKDD, International Conferenceon Knowledge Discovery abd Data Kining, KDD-2000, Association <strong>for</strong>Computing Machinery, Massachusetts, USA, 2000.[4] Federal Emergency Management Authority. HAZUS 99 Technical Manual.Technical report, Federal Emergency Management Authority Agency, (FEMA),United States Government, Washington, USA, 1999.[5] World Bank. Poverty and <strong>Vulnerability</strong> and Public Action. http://www.worldbank.org/wbi/socialprotection/africa/parisone/pdfpaper/%conceptseng.pdf, 2002.[6] M. J. A. Berry and G. S. Linoff. Data Mining Techniques <strong>for</strong> Marketing, Salesand Customer Support. John Wiley and Sons, London, UK, 1997.[7] P. Blaikie, T. Cannon, I. Davis, and B. Wisner. At Risk: Natural Hazards, People’s<strong>Vulnerability</strong> and Disasters. Routledge, London, UK, 1994.[8] R. Bolin and L. Stan<strong>for</strong>d. Shelter, Housing and Recovery: A Comparison of U.S.Disasters. Disasters, 15(1):24–34, 1991.[9] L. Breiman, J. H. Friedman, R. A. Olshen, and C. J. Stone. Classification andRegression Trees. Statistics/Probability Series. Wadsworth Publishing Company,Cali<strong>for</strong>nia, USA, 1984.[10] A. H. Briggs, A. E. Ades, and M. J. Price. Probabilistic Sensitivity Analysis <strong>for</strong>Decision Trees with Multiple Branches: Use of the Dirichlet Distribution in aBayesian Framework. Medical Decision Making, 23(4):341–350, 2003.[11] L. Brown and A. Harding. <strong>Social</strong> Modelling and Public Policy: What is microsimulationmodelling and how is it being used? In ”It’s not just about theDollars” Forum, 19 July 2002, Sydney, Australia, 2002.86
[12] P. Buckle. A framework <strong>for</strong> Assessing <strong>Vulnerability</strong>. The Australian Journal ofEmergency Management, 13(4):21–26, 1995.[13] P Buckle. Re-defining Community and <strong>Vulnerability</strong> in the context of EmergencyManagement. Australian Journal of Emergency Management, 13(1):21–26, 1998.[14] P. Buckle. Assessing resilience and vulnerability in the context of emergencies:Guidelines. Technical report, Department of Human Services, Victoria, Melbourne,Australia, 2000.[15] S. B. Chang. Transportation Per<strong>for</strong>mance, Disaster <strong>Vulnerability</strong> and Long-termeffects of Earthquakes. In Second EuroConference on Global Change and CatastropheRisk Management, Austria, July 6-9, 2000, Laxenburg, Austria, 2000.[16] C. W. Cobb and C. Rix<strong>for</strong>d. Lessons learned from the history of social indicators.http://www.rprogress.org, 1998.[17] Productivity Commission and Institute of Applied Economic and <strong>Social</strong> Research.Policy implications of the ageing of australias population. Technicalreport, Productivity Commission, Canberra, Australia, 1999.[18] Private Health Insurance Administration Council. Quarterly statistics, september1997. http://www.phiac.gov.au/statistics.[19] D. Crichton. The Risk Triangle in Natural Disaster Management. Tudor Rose,Leicester, UK, 1999.[20] R Davidson. An Urban Earthquake Disaster Risk Index. PhD thesis, Departmentof Civil Engineering, Stan<strong>for</strong>d University, USA, Cali<strong>for</strong>nia, USA, 1997.[21] How vulnerable is your community to a natural hazard? Using synthetic estimationto produce spatial estimates of vulnerability, 2003.[22] B. Drottz-Sjberg. Exposure to Risk and Trust in In<strong>for</strong>mation; Implications <strong>for</strong>the Credibility of Risk Communication. The Australasian Journal of Disaster, 2,2000.[23] P. F. Drucker. The Discipline of Innovation. Harvard Business Review, pages3–8, 1988.[24] N. B. Ferrier. Creating a Safer City: A Comprehensive Risk Assessment <strong>for</strong>the City of Toronto. Technical report, Toronto Emergency Medical Services,Toronto, Canada, 2000.[25] B. Fischhoff, P. Lichtenstein, S. Read, and B. Combs. How Safe is Safe Enough?A Psychometric Study of attitudes towards technological risks and benefits. PolicySciences, 9:127–152, 1978.[26] M. Fordham. The Place of Gender in Earthquake vulnerability and mitigation. InSecond Euro Conference on Global Change and Catastrophic Risk Management- Earthquake Risks in Europe, Austria, Laxenburg, Austria, 2000.87
[27] W. J. Frawley, G. Piatetsky-Shapiro, and C. Matheus. ”Knowledge DiscoveryIn Databases: An Overview” in Knowledge Discovery In Databases (eds.) G.Piatetsky-Shapiro and W. J. Frawley. AAAI Press and MIT Press, Massachusetts,USA, 1991.[28] K. Granger and M. Hayne. Natural hazards and the risk they pose to South-EastQueensland. Technical report, Geoscience Australia, Commonwealth Governmentof Australia, Canberra, Australia, 2001.[29] K. Granger, T. Jones, and G. Scott. Community Risk in Cairns: a multi-hazardrisk assessment. Technical report, Geoscience Australia, Commonwealth Governmentof Australia, Canberra, Australia, 1999.[30] A. Harding and A. Szukalska. Facts, figures and suggestions <strong>for</strong> the future, Incomesupport and Poverty. Technical Report In<strong>for</strong>mation Sheet No. 2, Brotherhoodof St. Laurence, July 2002.[31] D. Harding and M. Hammill. Mercantile Mutual - Melbourne Institute HouseholdSaving Report, September Quarter 2000. Technical report, Melbourne Institute ofApplied Economic and <strong>Social</strong> Research, The University of Melbourne, Victoria,Australia, 2000.[32] M. Hayne and D. Gordon. Regional landslide hazard estimation, a GIS/decisiontree analysis: Southeast Queensland, Australia. In Proceedings of the fourteenthsoutheast Asian geotechnical conference, Hong Kong, 10-14 Dec, 2001, HongKong, 2001.[33] A. Heijmans. <strong>Vulnerability</strong>: A matter of perception. In International Conferenceon <strong>Vulnerability</strong> in Disaster Theory and Practice, pages 24–34, London, UK,2001.[34] R. Hockley. Organisational change and mourning. In Address to the Ninth AustralianInstitute of Training and Development Conference, Sydney, March 1998,New South Wales, Australia, 1998. Australian Institute of Training and Development.[35] J. Hoddinott. Operationalizing household food security in development projects:An introduction. Technical report, International Food Policy Research Institute,Washington, USA, 1999.[36] E. Hunt, J. Marin, and P. Stone. Experiments in Induction. Academic Press, NewYork, USA, 1966.[37] S. Jasanoff. The political science of risk perception. Reliability Engineering andSystem Safety, 59:91–99, 1998.[38] J. Kasperson and R. Kasperson. International Workshop on <strong>Vulnerability</strong> andGlobal Environmental Change, Stockholm, May 17-19 2001. In A workshopsummary, Stockholm Environment Institute, Stockholm, Sweden, 2001.88
[39] D. King and C. MacGregor. Using social indicators to measure community vulnerabilityto natural hazards. Australian Journal of Emergency Management,15(3):52–57, 2000.[40] E. Krumpe. Monitoring Human Impacts: Criteria to Guide Selection of indicators.http://www.cnr.uidaho.edu/rrt496/INDICATORs.pdf.[41] K. Lambert. A Hurricane Disaster Risk Index. Master’s thesis, Department ofCivil Engineering, University of North Carolina, North Carolina, USA, 2000.[42] R. Lloyd, J. Given, and O. Hellwig. The Digital Divide: Some Explanations.Agenda, 7(4):354–358, 2000.[43] R. Lloyd, A. Harding, and O. Hellwig. Regional Divide? A study of incomesin regional Australia. Australasian Journal of Regional Studies, 6(3):271–292,2001.[44] M. Middelmann and K. Granger. Community Risk in Mackay: A Multi-hazardRisk Assessment. Technical report, Geoscience Australia, Commonwealth Governmentof Australia, Canberra, Australia, 2000.[45] B. H. Morrow. Identifying and Mapping Community <strong>Vulnerability</strong>. Disasters,23(1):1–18, 1999.[46] S. Murthy, S. Kasif, and S. Salzberg. A system <strong>for</strong> induction of oblique decisiontrees. Journal of Artificial Intelligence Research, 2:1–32, 1994.[47] National Centre <strong>for</strong> <strong>Social</strong> NATSEM and University of Canberra Economic Modelling.http://www.natsem.canberra.edu.au/research/marketinfo/2001full-marketin%fo.htm.[48] W. L. Neuman. <strong>Social</strong> Research Methods: Qualitative and Quantitative Approaches.Allyn and Bacon, New York, USA, 1997.[49] John F. Kennedy School of Government at Harvard University. http://www.ksg.harvard.edu/saguaro/.[50] Australian Institute of Health and Welfare. Disability support services. http://www.aihw.gov.au/publications.[51] Department of Regional Development, Environment Executive Secretariat <strong>for</strong>Economic, and <strong>Social</strong> Affairs Organisation of American States. Primer on NaturalHazard Management in Integrated Regional Development Planning. Technicalreport, Organisation of American States, Washington, USA, 1991.[52] Australian Bureau of Statistics. Cdata96, census 1996. Technical Report CatalogueNo 2019.0.30.001, Australian Bureau of Statistics, Commonwealth ofAustralia, Canberra, Australia, 1996.[53] Australian Bureau of Statistics. Basic community profile, 1996 census of populationand housing. Technical Report Catalogue No 2020.0, Australian Bureauof Statistics, Commonwealth of Australia, Canberra, Australia, 1997.89
[54] Australian Bureau of Statistics. Catalogue no.6544.0.30.001. 1998-99 householdexpenditure survey australia confidentialised unit record file (curf) technical paper,2002.[55] Australian Bureau of Statistics. http://www.abs.gov.au/themes/<strong>Social</strong>_Capital.[56] Australian Bureau of Statistics. Ausstats. http://www.abs.gov.au/AusStats.[57] D Paton. Editorial; Disaster and Trauma Studies: Developing an Australasianperspective. The Australasian Journal of Disaster and Trauma Studies, 1, 1997.[58] M. Pelling. The <strong>Vulnerability</strong> of Cities: Natural Disasters and <strong>Social</strong> Resilience.Earthscan Publications, London, UK, 2003.[59] B. Phillips. Holistic Disaster Recovery: Ideas <strong>for</strong> building local sustainabilityafter a natural disaster, chapter Chapter 6: <strong>Social</strong> and Intergenerational Equity.Natural Hazards Research Center, University of Colorado, Colorado, USA, 2001.[60] J. Quinlan. C4.5: Programs <strong>for</strong> Machine Learning. Morgan-Kaufmann Publishers,Cali<strong>for</strong>nia, USA, 1993.[61] R. Rossi and K. Gilmartin. The handbook of social indicators: Sources, characteristicsand analysis. Garland STPM, New York, USA, 1980.[62] H. Schuman and S. Presser. Questions and Answers in Attitude Surveys: Experimentson Question Form, Wording, and Context. Sage Publications, London,1996.[63] P. Slovic. The Perception of Risk. Earthscan Publications, London, UK, 2000.[64] L. Stephen and T. Downing. Getting the scale right: A comparison of analysticalmethods <strong>for</strong> vulnerability assessment and household-level targeting. Disasters,25(2):113–135, 2001.[65] W. Stone. <strong>Social</strong> capital and social security: Lessons from research. FamilyMatters, 57:10–14, 2000.[66] G. F. White and H. J. Heinz. The Hidden costs of Coastal Hazards. H. John HeinzIII Center <strong>for</strong> Science, Economics and the Environment. Island Press, Washington,USA, 2000.[67] O. Wilelmi and D. Wilhite. Assessing vulnerability to agricultural drought: ANebraska case study. Natural Hazards, 25(1):37–58, 2002.[68] P. Wright. Knowledge discovery in databses: Tools and techniques. http://www.acm.org/crossroads/xrds5-2/kdd.html#6, 1998.[69] Y. Yohannes and P. Webb. Classification and Regression Trees, CART c○: AUser Manual <strong>for</strong> identifying indicators of vulnerability to famine and chronicfood insecurity. Technical report, International Food Policy Research Institute,Washington, USA, 1999.90
Indexattribute, 77categorical, 77categorical, 77continuous, 77masking, 80missing, 80attribute selection criteria, 79Australian Bureau of Statistics, 9HES, 51, 82SEIFA, 9branch, 35, 77, 78C4.5, 78CART, 78, 79circle segment technique, 33, 34class label, 77class labels, 77classification model, 77classification technique, 78concept, 77cross-validationk-fold, 79datacollection, 20continuous, 76discrete, 76missing, 76noise, 76training, 76data mining, 33data mining techniques, 76data set, 77decision rules, 37decision tree, vii, 6, 69, 77decision tree induction, 76Earthquake Disaster Risk Index, 9–13entropy, 80events, 77examples, 77experts, 29, 69exposure, 3Geoscience AustraliaCities Project, 9, 13, 47Gini index, 79hazard, 3flood, 52HAZUS, 14Henderson Poverty Line, 28importance measure, 80impurity, 79measuresGini, 79indicatorselection, 15indicators’5 esses’, 13age, 12, 18, 21, 50, 83car ownership, 18debt and savings, 26disability, 18, 25employment, 23family status, 51gender, 12, 27, 50health insurance, 18, 25history, 8house and/or contents insurance, 83household types, 24householdtypes, 83income, 18, 22, 28, 50, 83injury classification, 52language, 24residence damage, 52residence type, 22, 23selection criteria, 1491
tenure, 83transportation, 27vulnerability, 9, 16, 51, 82weights, 13, 18individualshypothetical, 28in<strong>for</strong>mation gain, 80instance, 77space, 77internal node, 77knowledge discovery, 33Knowledge Discovery in Databases, 76linkage variables, 82masking, 80maximal tree, 77, 78microsimulation, 81mitigation, 4NATSEMMarketInfo, 48, 81, 83SYNAGI, 81natural hazardsAustralia, 29nodeleaf, 35root, 35children, 80internal, 77leaf, 78parent, 80root, 35, 77, 78observations, 77OC1, 78optimisation, 83perception based classification, 33, 34psychometric paradigm, 19purity, 79Perth, Western Australia, 47South-East Queensland, 13assessment <strong>methodology</strong>, 12, 13,28Earthquake Disaster Risk Index, 9Hurricane Disaster Risk Index, 13,19perception, 19risk assessmentCity of Toronto, 13risk index, 12risk perception questionnaire, vii, 6, 20design, 28results, 30rule, 78scenarios, 52, 53splittingoblique, 36orthogonal, 36splitting function, 80subset, 77surrogate splitters, 80synthetic estimation, 46, 48, 53, 70target variable, 77total risk pyramid, 3under-fitting, 78United Nations, 8variable importance, 42visualisation, 33vulnerability, 3definition, 9indicators, 13, 16, 51, 82measuring, 9vulnerability maps, 54World Bank, 8records, 77reweighting, 81, 82riskEarthquake Disaster Risk Index, 14relative risk rank, 12assessment92