Interpreting teqc's qc Mode Output Section 21. - Inpe
Interpreting teqc's qc Mode Output Section 21. - Inpe
Interpreting teqc's qc Mode Output Section 21. - Inpe
Create successful ePaper yourself
Turn your PDF publications into a flip-book with our unique Google optimized e-Paper software.
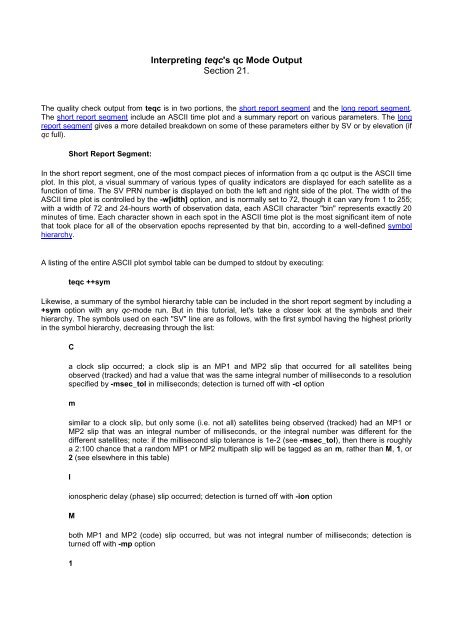
<strong>Interpreting</strong> <strong>te<strong>qc</strong>'s</strong> <strong>qc</strong> <strong>Mode</strong> <strong>Output</strong><strong>Section</strong> <strong>21.</strong>The quality check output from te<strong>qc</strong> is in two portions, the short report segment and the long report segment.The short report segment include an ASCII time plot and a summary report on various parameters. The longreport segment gives a more detailed breakdown on some of these parameters either by SV or by elevation (if<strong>qc</strong> full).Short Report Segment:In the short report segment, one of the most compact pieces of information from a <strong>qc</strong> output is the ASCII timeplot. In this plot, a visual summary of various types of quality indicators are displayed for each satellite as afunction of time. The SV PRN number is displayed on both the left and right side of the plot. The width of theASCII time plot is controlled by the -w[idth] option, and is normally set to 72, though it can vary from 1 to 255;with a width of 72 and 24-hours worth of observation data, each ASCII character "bin" represents exactly 20minutes of time. Each character shown in each spot in the ASCII time plot is the most significant item of notethat took place for all of the observation epochs represented by that bin, according to a well-defined symbolhierarchy.A listing of the entire ASCII plot symbol table can be dumped to stdout by executing:te<strong>qc</strong> ++symLikewise, a summary of the symbol hierarchy table can be included in the short report segment by including a+sym option with any <strong>qc</strong>-mode run. But in this tutorial, let's take a closer look at the symbols and theirhierarchy. The symbols used on each "SV" line are as follows, with the first symbol having the highest priorityin the symbol hierarchy, decreasing through the list:Ca clock slip occurred; a clock slip is an MP1 and MP2 slip that occurred for all satellites beingobserved (tracked) and had a value that was the same integral number of milliseconds to a resolutionspecified by -msec_tol in milliseconds; detection is turned off with -cl optionmsimilar to a clock slip, but only some (i.e. not all) satellites being observed (tracked) had an MP1 orMP2 slip that was an integral number of milliseconds, or the integral number was different for thedifferent satellites; note: if the millisecond slip tolerance is 1e-2 (see -msec_tol), then there is roughlya 2:100 chance that a random MP1 or MP2 multipath slip will be tagged as an m, rather than M, 1, or2 (see elsewhere in this table)Iionospheric delay (phase) slip occurred; detection is turned off with -ion optionMboth MP1 and MP2 (code) slip occurred, but was not integral number of milliseconds; detection isturned off with -mp option1
only MP1 (code) slip occurred, but was not integral number of milliseconds; detection is turned offwith -mp option2only MP2 (code) slip occurred, but was not integral number of milliseconds; detection is turned offwith -mp option-for <strong>qc</strong> full, satellite was above elevation mask, but no data was apparently recorded by the receiver;for <strong>qc</strong>-lite (no ephemeris information), the data gap must also be less than the maximum specified(see argument of -gap_mx in minutes)+(<strong>qc</strong> full only) satellite was below elevation mask and a complete set of phase and code data wascollected^(<strong>qc</strong> full only) satellite was below elevation mask and a partial set of phase and code data wascollected.phase and/or code data for SV is L1 and C/A only & A/S is off; if <strong>qc</strong> full, satellite was above elevationmask:phase and/or code data for SV is L1 and P1 only & A/S is off; if <strong>qc</strong> full, satellite was above elevationmask~phase and/or code data for SV is L1, C/A, L2, P2 & A/S is off; if <strong>qc</strong> full, satellite was above elevationmask*phase and/or code data for SV is L1, P1, L2, P2 & A/S is off; if <strong>qc</strong> full, satellite was above elevationmask,phase and/or code data for SV is L1 and C/A only & A/S is on; if <strong>qc</strong> full, satellite was above elevationmask;phase and/or code data for SV is L1 and P1 only & A/S is on; if <strong>qc</strong> full, satellite was above elevationmasko
Any additional symbols that occur in an SV symbol track not in the above examples fall into a "not so good"category, though seeing a lot of - symbols in a <strong>qc</strong> full output is also "not good". Let's take a look in more detailat what these other indicators might be.The first "not so good" category could generally be considered "missing data". As mentioned above, the worstmissing data indicator (<strong>qc</strong> full only) is the -, which means that the SV was calculated using the suppliedephemeris to be above the elevation mask, but no observation data was present for this SV. In other words,all data is missing.Following the - "all data missing" indicator are the partial missing data indicators. For example, if A/S isnormally on, seeing ; or , indicates that there was at least one observation epoch in that bin where L2observables (i.e. L2 and P2) were missing. You are unlikely to see a y, as this would require a Y-codereceiver (capable of tracking P1 while A/S is on). (An exception to this is when <strong>qc</strong>-ing data from an Ashtechreceiver like the Z-XII. The C/A and P1 pseudorange observables are reported for all SVs, regardless ofwhether A/S is on or off.) If A/S is normally off, seeing : or . indicates that there was at least one observationepoch in that bin where the L2 observables were missing. A ~ indicates that, for some reason, the receivercould not track P1, even though A/S was off, so the receiver instead recorded the C/A observable.If you are using a P-code (not a Y-code) receiver that reports C/A and P1 pseudoranges for each SV at eachepoch (like the Ashtech Z-XII), you may want to use the -Y option, which informs te<strong>qc</strong> that this is data notfrom a Y-code receiver, and to treat the <strong>qc</strong> analysis as though from a P-code receiver.Special Treatment of Data from CodelessReceiversYou may have a data set that was collected with a "codeless" or "squaring" receiver. For these receivers, thepseudoranges P1 and P2 are never recorded, and the default <strong>qc</strong> report will show that all observations wereincomplete, as none of them can have a P2 observation (though C/A is acceptable in place of the missing P1).Also, the SV symbol tracks for the examples above would then appear as:A/S on:A/S off:_____--,,,,,,,,,,,,,,,,,,+++++_______--..................+++++__1 2 3 4 5 6which (correctly) indicates a lack of L2 and P2, even though the observable P2 is not possible (and thus neverpresent) and L2 may be always present.You can inform te<strong>qc</strong> that the data is to be interpreted as though it were collected by a codeless receiver byincluding a -P option (and, of course, the default option in +P). In this case, the absence of P-codes is ignoredfor statistics and the data indicators change collapse to just two possibilities (from the original eightpossibilities):.phase and/or code data for SV is L1, C/A; if <strong>qc</strong> full, satellite was above elevation maskophase and/or code data for SV is L1, C/A, and L2; if <strong>qc</strong> full, satellite was above elevation mask
Notice that the A/S state (on or off) is ignored, as this is irrelevant for processing squared data. Then, whenusing the -P option, the above SV symbol tracks will appear as:A/S on:A/S off:_____--oooooooooooooooooo+++++_______--oooooooooooooooooo+++++__1 2 3 4 5 6i.e., there is no difference whether A/S is on or off. You will probably see an occasional . data indicator:A/S any:_____--ooo.ooooooo.oooooo+++++__1 2 3 4 5 6indicating one or more observation epochs where the observable L2 is missing.A listing of the entire ASCII plot symbol table modified for codeless receivers can be dumped to stdout byexecuting:te<strong>qc</strong> -P ++symOther IndicatorsThe next set of "not so good" indicators are for slips in the observables. A common type of slip is anionospheric delay (phase) slip indicated by a I symbol. These often occur when the SV is at low elevation,both while rising and setting, so the example SV symbol tracks from above might really appear as:A/S on:A/S off:_____--Iooooooooooooooooo++I+I_______--I*****************++I+I__1 2 3 4 5 6In this example, ionospheric delay slips are detected shortly after the receiver starts tracking the SV and asthe SV is close to setting.The other common type of slip is for one or both of the multipath (code) observables, MP1 and MP2. Again,these frequently occur at low elevations. There are three symbols: M for slip on both MP1 and MP2, 1 for slipon MP1 only, and 2 for slip on MP2 only. Notice that the multipath slip indicators take a lower priority in thesymbol hierarchy, so if an ionospheric delay slip and multipath slip occur at different observations epochswithin the ASCII bin, only the I symbol will be seen (assuming that the option configuration is +ion and +mp).If you use -ion to suppress ionospheric delay slip detection, the above SV symbol tracks might now appearas:A/S on:A/S off:_____--Mooooooooooooooooo++2+M_______--M*****************++2+M__1 2 3 4 5 6Interestingly, the occurrence of ionospheric delay or multipath slips in the recorded observations is not only afunction of the antenna environment (meaning all the way back to the transmitting SV), but is also a functionof the specific receiver. Due to internal slip detection and phase observables resets, data from some receiversshow virtually no ionospheric delay slips and nearly all multipath slips. Other receivers do not reset the phaseobservables, and show a larger number of ionospheric delay slips than multipath slips.The last type of slip is the "n-millisecond clock slip", where the value of n is usually 1, denoted by the symbolC in the SV symbol track. This slip is reported if all SVs being tracked have slips in MP1 and MP2 equivalentto the same number of integral milliseconds, to a tolerance specified by the -msec_tol option. If you set thetolerance to 1e-17 (milliseconds), you probably will never see any of these slips. However, the default
tolerance is 1e-2 (milliseconds), and with this value the <strong>qc</strong> mode of te<strong>qc</strong> seems pretty capable of detectingthese slips if they are present.What does it mean if you see the C symbol in an SV symbol track? There are several causes, some moreharmless than others. If the C symbol is preceded by an observation gap (no data collected for any SVs),there may be one or more millisecond clock resets missing from the observation epoch time tags. Also, if youuse te<strong>qc</strong> to splice two RINEX OBS files together and clock resets occur in the first file, a C will occur at thefirst epoch of the second file (since the te<strong>qc</strong> splice does not modify the observation times in the second file toaccount for the accumulative clock resets in the first file). In other cases, however, if the observation epochsare fairly continuous, and the C indicator is appearing two or more times in 24-hours of data, there is a strongpossibility that the receiver was not healthy.This latter possibility (that the receiver was not healthy) prompted the inclusion of another slip indicator, the"n-millisecond multipath slip". It was observed that some receivers get so unhealthy that, even though n-millisecond clock slips should be occurring (i.e., given the specific receiver, no millisecond clock resets arepresent, even though they were expected) none were being found because the multipath slips for differentSVs had different millisecond equivalents. In short, the value for n was not a constant for all SVs beingtracked. In this case, the m symbol is used. There is some probability (roughly about 2 : inverse of millisecondtolerance) that a random multipath slip will be recorded as an m instead of as a M or 1 or 2; so, treat theoccasional m as you would any multipath slip. However, if you start to see lots of m symbols, especially if youhave seen C symbols being reported in the data from the same receiver, suspect that the receiver is ailing.The next "not so good" category is presence of data gaps. There are really two types of gaps. One is acomplete observation gap for all SVs. This can be caused perhaps by the receiver being turned off and laterturned back on, by a loss of all data for a period of time either internal to the receiver itself or due to acommunication breakdown with the receiver. Currently, a complete observation gap is not indicated in the SVsymbol tracks, except (on occasion) if they are present in a <strong>qc</strong> lite run.The other type of gap is the SV data gap, where the receiver stops tracking an SV for a period of time eventhough it is well above the horizon or elevation mask, perhaps due to an obstruction. The exact definition of anSV data gap depends on whether te<strong>qc</strong> is running in a <strong>qc</strong> full or <strong>qc</strong> lite mode. For <strong>qc</strong> full, an SV data gapoccurs if there are one or more missing observation epochs while the SV is above the elevation mask. For <strong>qc</strong>lite, an SV data gap occurs if tracking stops for more than the specified minimum time (-gap_mn, again) andthen tracking resumes before a specified maximum time (see -gap_mx option). The symbol used in the SVsymbol track is now -, so an SV data gap might look like:A/S on:A/S off:_____--Ioooooooooo--ooooo++I+I_______--I**********--*****++I+I__1 2 3 ab 4 5 6which occurred at the interval (ab). The meaning is really the same as the interval (23), i.e. the SV was abovethe elevation mask, but no data was received.The only other indicator for SV data, low in the symbol hierarchy, is the "Loss of Lock" indicator, L, which isused when the receiver issues a loss of lock for either the L1 or the L2 observable. A large number of Lsymbols may indicate an unhealthy receiver or antenna. This should rarely, if ever, be seen in the ASCII timeplot.Following the SV symbol tracks are one or four more, depending on whether you are using <strong>qc</strong> lite or <strong>qc</strong> full,respectively. For <strong>qc</strong> lite, there is a symbol line labeled "Obs". This records the maximum number of SVs thatwere tracked by the receiver for each bin using a hexidecimal representation. For example, if there is a 7 onthis line, then 7 SVs were tracked for at least one observation epoch represented by that time bin; if there is a
on this line, then 11 SVs were tracked for a least one observation epoch represented by that time bin; andso on. If no SVs were tracked, a (blank), rather than 0, is shown. If one or more s are present on the "Obs"line in a <strong>qc</strong> lite run, this is your best indicator that a complete observation gap has occurred.For <strong>qc</strong> full runs, the "Obs" line is replaced by four lines, labeled "-dn", "+dn", "+XX", and "Pos". The "+XX" lineis the one most like the <strong>qc</strong> lite "Obs" line; the XX is replaced by the elevation mask in degrees (rounded to thenearest degree) and indicates the maximum expected number of SVs that are above the elevation mask,according to the supplied ephemerides, again using a hexidecimal notation. The difference between the <strong>qc</strong> lite"Obs" line and the <strong>qc</strong> full "+XX" line is the difference between reality and theory: "Obs" shows what was seen,where "+XX" shows what could have been seen (above the elevation mask).The discrepancy between reality and theory is recorded in the "-dn" and "+dn" lines, which are the SV trackingdiscrepancy counts, and record the two bounds of the discrepancy. They can be thought of as the "goodnew/bad news" to the number of SVs not tracked. The line "-dn" records the minimum discrepancy of allobservation epochs for that time bin while the line "+dn" records the maximum discrepancy of all observationepochs for that time bin. The discrepancy count is also shown in hexidecimal notation, with (blank) for 0.For the discrepancy lines to work correctly, the option -max_SVs must be set correctly. This states themaximum number of SVs that are capable of being tracked by the receiver, and currently has a default valueof 12. If a complete observation gap occurs with <strong>qc</strong> full, a group of c characters will be shown (c is hex for 12),at least on the "+dn" line, and if the gap is large enough, on the "-dn" line as well.The "Pos" line records the success or non-success of calculated code positions for the antenna at thedifferent epochs. Generally, you should see an o recorded for each bin in which a position calculation wassuccessful.The last symbol line in the ASCII time plot is labeled "Clk". In the original UNAVCO QC, this line (labeled"CLK") represented all millisecond receiver clock resets present in the observation epochs with a C symbol.This has been replaced with either a + or - symbol, meaning either a positive or negative millisecond receiverclock reset was detected, respectively. Another symbol which may be placed on this line is ^, which is lower inthe clock symbol hierarchy that either + or -, and indicates at least one missed observation epoch in that timebin, though a correct value of the observation sampling interval must be set (see -O.int option) for this to workcorrectly. This symbol was added to help reveal two things: 1) the existence of "micro-gaps", i.e. missing dataperiods less than that set by the -gap_mn option, and 2) to identify short gaps during which a millisecondclock reset may have occurred. For example, if a portion of the "Clk" symbol track is:Clk: + + + ^^ + + + ^+ + + + +12 3then you can suspect a missing (positive) millisecond receiver clock reset at time (1) due to the regularity ofthe rest of the identified resets and the missing epoch indicator ^, and other missing observation epochs attimes (2) and (3). Other micro-gaps might exist in the data, but their presence would be hidden by the +symbols.Incidentally, another "micro-gap" indicator exists for <strong>qc</strong> full runs on the "+dn" line. Since this is maximumdiscrepancy between the number of SVs that could have been observed and what were actually observed.However, for missing observation epochs (no SVs observed), rather than placing a count of just "SVs thatcould have been observed" based on the ephemerides, te<strong>qc</strong> places a count of the maximum allowed by thereceiver. So, for a receiver capable of tracking 12 SVs (see -max_SVs option), you will also see a c (hex for12) on this line when missing a observation epoch.
Following the "Clk" line of the ASCII time plot is a scale bar with tick marks. The separation between tickmarks is indicated a few lines lower at "Time line window length". The tick marks should occur at even valuesof the tick interval. For example, if the time window starts at 01:39:30.000 (1h 39m 30s) and the tick interval is3 hours, the tick marks will be placed at 03:00:00, 06:00:00, 09:00:00, and so on, to the best resolutionpossible on the ASCII plot. The tic interval is self-scaling, from 0.1 seconds to 7 days, depending on the lengthof the time window.At the end of the ASCII time plot, the beginning and end time and date follow at the ends of scale bar.Seconds are only printed out if they are non-zero.Following the ASCII time plot in the short report segment is a report summary. First is a listing of the name oftarget files, and if <strong>qc</strong>-full, the RINEX NAV files used.The bounds of the time window is then shown. If the times of the first and/or last observation epochs do notmatch the bounds of the time window, these epoch times are shown as well.If the configuration environment variable or any configuration files were used, these are listed next.If the observation interval is non-zero, this is given.The total number of satellites (SVs) with any type of observations is then given. This is followed by a list ofmissing SVs, up to the maximum set by default (probably 32), or using the -PRNs option, for each satellitesystem that had any members. Finally, if doing <strong>qc</strong>-full, a list of SVs that did not have ephemeris information isgiven.The number of SVs which can be simultaneously tracked by the receiver is then given. This currently has adefault value of 12, or can be changed using the -max_SVs option.If the observation interval is non-zero, the total number of possible observation epochs in the time window isgiven. This is followed the number of epochs that actually had "complete observations" from at least one SV.The definition of a "complete observation" is important, so it will be defined in detail here. In order for anobservation from a GPS SV to be "complete", it must have :1. P1 or C/A code data2. P2 code data3. L1 and L2 phase data4. S/N for both L1 and L2 be at or above specified minima5. if <strong>qc</strong>-full, an SV elevation at or above the elevation maskThen the numbers of possible, complete, and deleted observations are given. If doing <strong>qc</strong>-full, the both thenumber of possible observations above the horizon and above the elevation mask are given first. Next, thenumber of complete observations is given; if <strong>qc</strong>-full, this is restricted to those observations above the elevationmask. Next, the number of deleted observations is given; if <strong>qc</strong>-full, this is also restricted to those observationsabove the elevation mask.
If the multipath option was set (which it is by default), the average multipath RMS is given. If a movingaverage window was used (which is used by default), information about the length of this window is given. If<strong>qc</strong>-full, the multipath RMS is only for observations above the elevation mask.The number of detected millisecond receiver clock resets is then given. This is followed by the total drift of thereceiver clock, an estimate of the average receiver clock drift, and, if the number of clock resets is non-zero,the average time between resets in minutes.The length of time required before an SV data gap is reported is given next. If <strong>qc</strong>-lite, a maximum time is alsogiven.If the detection of n-millisecond clock slips is on (+cl option), the number of epochs with n-msec clock slips isreported. This occurs when all SVs with multipath observables must have multipath slips of the same size towithin a specified tolerance (fraction of millisecond).This is followed by the number of other n-millisecond multipath slips which do not qualify as n-millisecondclock slips. Given a non-zero tolerance, there is a certain probability that a few multipath slips fall within thetolerance. Therefore, a second value is given in parentheses and this is the total number of multipath slips forthe time window (no elevation mask cutoff). If the tolerance is set to 1e-2 millisecond, ratios on the order of2:100 are expected due to chance. Significantly higher ratios are an indication of a sick receiver.Next if doing the derivative of the ionospheric delay observable (+iod) or multipath (+mp), counts of thenumber of IOD and/or multipath slips is given. If <strong>qc</strong>-full, this is further broken down according to elevationmask. In order to qualify as a count here, both MP1 and MP2 must slip (though not necessarily by the sameamount) at the same epoch for a particular SV.Finally, a "SUM" line in printed, showing the start and end times of the window, the length of the time windowin hours, the observation interval in seconds, the number of possible observations (if <strong>qc</strong>-full), the number ofcomplete observations, the ratio of complete to possible observations as a percent (if <strong>qc</strong>-full), the multipathRMS values for MP1 and MP2 (limited by the elevation mask if <strong>qc</strong>-full), and lastly the "observations per slip".The "observations per slip" needs a bit of explanation. First, "observations" means "complete observations" asdefined above, including the elevation mask if <strong>qc</strong>-full. Second, "slip" means "either an IOD slip and/or bothMP1 and MP2 slips occurred during the epoch having a complete observation for this SV".Some additional information for each SV can be included in the short report segment by using the +ssvoption. Similar to the main SUM line, shown for each SV with observations are: the expected number ofobservations, the number of complete observations, the number of deleted observations, ratio of complete topossible observations, multipath RMS values for MP1 and MP2, and the observations per slip.Long Report Segment:The long report segment contains a further breakdown of information by SV and by elevation (if <strong>qc</strong>-full). In thelong report segment, individual SVs are often referenced. The leading character indicated the satellite system:G: NAVSTAR GPS systemR: GLONASS systemT: NNSS Transit systemS: geostationary signal payload
The first portion is a list of some of the processing parameters, followed by a time stamp of the first and lastobservation epochs within the time window, and the observation interval.Next is a breakdown of observations per SV. If doing <strong>qc</strong>-full and the SV had ephemeris data, the values in thefirst four columns have meaning:#+hor:number of observations above the horizon for this SV:mean elevation of SV above the horizon for epochs with observations#+mask:number of observations above the elevation mask for this SV:mean elevation of SV above the elevation mask for epochs with observationsNext are the number of reported and complete observations. If doing <strong>qc</strong>-full and the SV had ephemeris data,the values are for epochs only above the elevation mask; otherwise, the values are for all epochs:#reprt:number of observations with any data reported for this SV#compl:number of "complete" observations reported for this SV (see definition in "Short Report Segment")Next are the number of L1, L2, P1, P2, and C/A observations. Again, if doing <strong>qc</strong>-full and the SV hadephemeris data, the values are for epochs only above the elevation mask; otherwise, the values are for allepochs:L1:number of L1 observations for this SVL2:number of L2 observations for this SVP1:number of P1 observations for this SVP2:number of P2 observations for this SVCA:
number of C/A observations for this SVIf doing <strong>qc</strong>-full, any SV computed to be above the elevation mask but not having any data reported is listednext.If doing <strong>qc</strong>-full, any SV not having ephemeris data but having observation data of any kind is identified with a"*".Next, a summary tally is given. If doing <strong>qc</strong>-full and a site position was found, the total number of observationbelow the elevation mask is given (i.e., number of observations excluded because of low elevation). Next,reasons for incomplete observations (above the elevation mask if a site position was found) are summarized:missing L1, L2, P1 or C/A, or P2, or poor S/N for L1 or L2.Following this is the number of observations reported with any code or phase data. (Note: If an SV has only,say, Doppler data, it will not be reported here.) This is followed by the number of observation deleted for anyreason: below elevation mask (if <strong>qc</strong>-full), missing code or phase data, and/or poor S/N. Finally, the number ofcomplete observation is given.Next, repeat of the receiver clock offset and drift statistics is given.Next there is one of several elevation histograms, from the horizon angle (default of 0°) to the zenith (90°).These need some explanation as to the style of presentation. The x- or horizontal labeling of the histogramsmay use something like:5=% 1|m 15=% 2|mIn these cases, the histogram is really then a dual histogram, using the "=" symbol to showpercentages and the "|" symbol to show meters, and a "#" symbol to show where both histogramsoccur. Hence, histogram lines like:##############||||||||##======would show about 7% and 1.1 meters on the first line and 4% and 0.1 meters on the second line. A">" at the extreme right of the histogram bar indicates that the bar extends off scale to the right. They- or vertical labeling of the bins is in degrees from the horizon to the zenith.The first histogram in for the ionospheric delay. Currently then is not a measure of the ion RMS inthe <strong>qc</strong> (hence all the values are zero), so the only valid scale is the percentage of observations thathad ionospheric delay slips.Beneath this is the MP1 RMS summary per SV and the gross statistics for all SVs, followed by the MP1 RMShistogram. The summary per SV shows the number of observations above the mask angle (default of 10°)and how many were deleted for MP1 observations (due to lack of one or more observables), followed by themean elevation (in degrees), and the MP1 rms in meters. There is also a breakdown of MP1 slips above andbelow 25° of elevation, and what the receiver reported for slips in L1 and L2. The individual SV MP1 statisticsare followed for the gross statistics for all SVs. The elevation statistics and histogram shows the total numberof observations per elevation bin, the number of MP1 slips detected, and the mean MP1 rms numerically,followed by the histogram bars for MP1 rms in meters (as "|" symbol) and the percentage of observations thathad MP1 slips (as "=" symbol). (Recall that if "|" and "=" overlap the "#" symbol is used.)
The MP2 summary follows and is analogous to the MP1 summary.The final two histograms are for the L1 and L2 SNR values. These are also dual histograms, showing themean SNR with the "|" symbol and the one-sigma value with the "=" symbol. (Recall that if "|" and "=" overlapthe "#" symbol is used.) In these histograms, both scales use the same units, which are arbitrary. If a rawbinary file was used as input for the <strong>qc</strong>, or a RINEX OBS file with observables S1 and/or S2, then the units arereceiver specific. If a RINEX OBS file without S1 or S2 is used, then the scaled RINEX 0-9 flag for SNR isshown.


