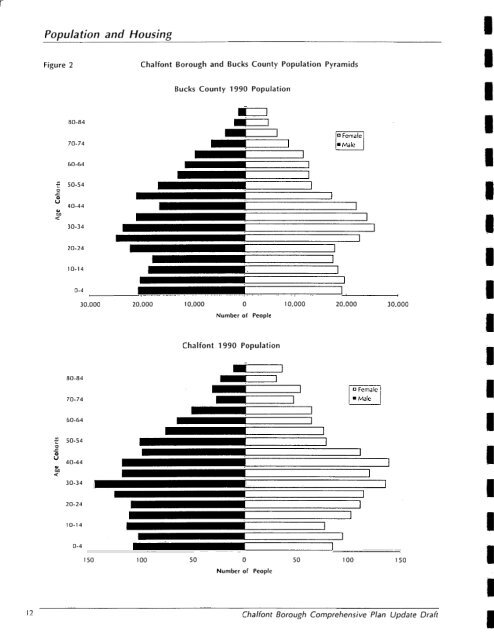
1IIII(IIIIITable 3 Regional Population Characteristics, 1980-1 990MunicipalityChalfont BoroughDoylestown BoroughDoylestown TownshipHilltown TownshipNew Britain BoroughNew Britain TownshipWarrington TownshipPercentWhite98.397.396.197.898.497.395.1MedianAge35.139.736.833.635.735.332.1PercentHigh SchoolDiploma83.080.286.184.883.590.590.0Population and HousingPercent 1989 MedianBachelor Degree Householdor Higher Income31.6 $46,30531 .O $32,94236.1 $52,21223.5 $44,71735.9 $49,14537.1 $54,61026.9 $47,284Bucks County Total 95.02 33.7-83.0 24.8 $43,347Source: U.S. Bureau oi the CensusThe number of persons per household in Chalfont Borough declined between 1980 and 1990. Theaverage number of persons per household was 3.12 in 19S0, but declined to 2.78 in 1990. Thisdecrease in household size is consistent with the county’s decline from 3.02 persons per household in19SO to 2.80 in 1990. This may be explained in part by a national trend towards smaller householdsdue to later marriages, fewer children, more divorces, and a greater number of elderly living alone.Also, 187 of the 1,066 households in the borough consisted of one person living alone. Of thesehouseholds, 96 consisted of a single person, 65 years of age or older. Forty-three of these householdsor 45 percent, consisted of a female, 65 years of age or older.Of the 3,069 people living in the borough in 1990, 1,538 were male and 1,53 1 were female. Nearly12.2 percent of the population was age 65 or older. Approximately 26 percent of the population wasbelow the age of IS. A 7 percent increase in children 0-4 years occurred between 1980 to 1990.Chalfont has also seen a 27 percent decrease between 19SO to 1990 in the number of school’ agechildren between the ages of 5 and 14, from 543 to 386 children.Population PyramidsTo gain a better understanding of the age distribution of the borough’s population, populationpyramids are provided in Figure 2. These pyramids display the number of people in a particular agegroup, or cohort, by sex,The population for the borough in 1990 displays a significant bulge at the 3044 cohort group. Thisbulge represents the last portion of the baby boomers born between 1946 and 1964.A comparison of the population pyramids of Chalfont and Bucks County shows not only the similarbulges of baby boomers and their children, but also that the bulges are lower on the Bucks Countypyramid indicating a lower average age.Chalfont Borough Comprehensive Plan Updale DraftI I
Population and HousingFigure 2Chalfont Borough and Bucks County Population PyramidsBucks County 1990 Population80-8470-74v)-L- P0u0-?60-6450-5440-4430-3420-2410-1 40-4-30,00020,000 10,000 0 10,000 20,000 30,000Number of PeopleChalfont 1990 Population80-8470-7460-64- 20450-54u 40-44aJ30-3420-24II10-140-4_.150 100 50 0 50 100 150Number of People12 Chalfont Boroqh Comprehensive 'Plan Updare Draft