WARMINSTER TOWNSHIP COMPREHENSIVE PLAN - E-Library
WARMINSTER TOWNSHIP COMPREHENSIVE PLAN - E-Library
WARMINSTER TOWNSHIP COMPREHENSIVE PLAN - E-Library

You also want an ePaper? Increase the reach of your titles
YUMPU automatically turns print PDFs into web optimized ePapers that Google loves.
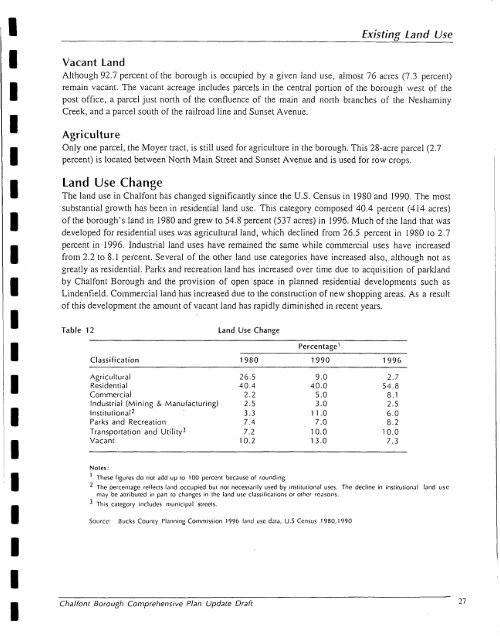
Existing f and UseVacant LandAlthough 92.7 percent of the borough is occupied by a given land use, almost 76 acres (7.3 percent)remain vacant. The vacant acreage includes parcels in the central portion of the borough west of thepost office, a parcel just north of the confluence of the main and north branches of the NeshaminyCreek, and a parcel south of the railroad line and Sunset Avenue.IIIIIIAgricultureOnly one parcel, the Moyer tract, is still used for agriculture in the borough. This 2s-acre parcel (2.7percent) is located between North Main Street and Sunset Avenue and is used for row crops.Land Use ChangeThe land use in Chalfont has changed significantly since the U.S. Census in 19SO and 1990. The mostsubstantial growth has been in residential land use. This category composed 40.4 percent (4 14 acres)of the borough's land in 1980 and grew to 54.S percent (537 acres) in 1996. Much of the land that wasdeveloped for residential uses was agricultural land, which declined from 26.5 percent in 19SO to 2.7percent in 1996. Industrial land uses have remained the same while commercial uses have increasedfrom 2.2 to S.1 percent. Several of the other land use categories have increased also, although not asgreatly as residential. Parks and recreation land has increased over time due to acquisition of parklandby Chalfont Borough and the provision of open'space in planned residential developments such asLindenfield. Commercial land has increased due to the construction of new shopping areas. As a resultof this development the amount of vacant land has rapidly diminished in recent years.Table 12Land Use ChangePercentageClassific a t' ton 1980 1990 1996Agricultural 26.5Residential 40.4Commercial 2.2I nd u s t r ia I (Mi n i ng & Manu fac t u r i ng) 2.5Institutiona I* 3.3Parks and Recreation 7.4Transportation and Utility3 7.2Vacant 10.29.040.05 .o3.011.07.010.013.02.754.88.12.56.08.210.07.3Notes:' These figures do not add up to 100 percent bccausc of rounding.The percentage reflects land occupied but not necessarily used by iflSlitlltiOnJI uses. The decline in illStilUtiOllJI land uscmay be attributed in pan to changcs in the land use classifications or othcr rcasons.This category includes nlunicipal strcets.Sourcc: Bucks County PIJlllling Cornmission 1996 land use data, U.s Ccnsus 1980.1990Chalfont Borough Comprehensive Plan Update Draft27