A Letter from The Office of the Vice Chancellor for Research
A Letter from The Office of the Vice Chancellor for Research
A Letter from The Office of the Vice Chancellor for Research
You also want an ePaper? Increase the reach of your titles
YUMPU automatically turns print PDFs into web optimized ePapers that Google loves.
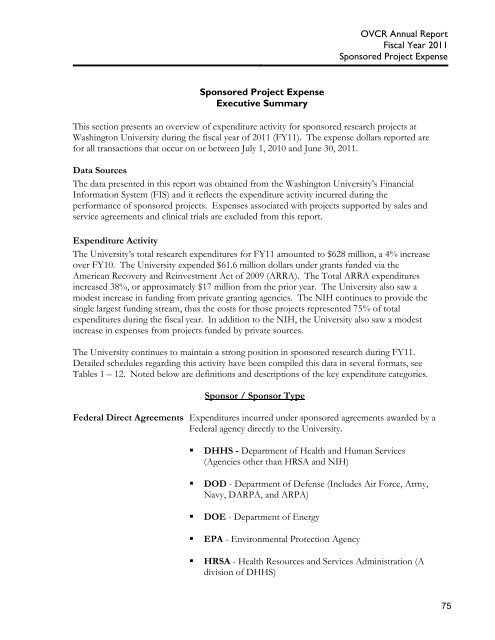
OVCR Annual ReportFiscal Year 2011Sponsored Project ExpenseSponsored Project ExpenseExecutive SummaryThis section presents an overview <strong>of</strong> expenditure activity <strong>for</strong> sponsored research projects atWashington University during <strong>the</strong> fiscal year <strong>of</strong> 2011 (FY11). <strong>The</strong> expense dollars reported are<strong>for</strong> all transactions that occur on or between July 1, 2010 and June 30, 2011.Data Sources<strong>The</strong> data presented in this report was obtained <strong>from</strong> <strong>the</strong> Washington University’s FinancialIn<strong>for</strong>mation System (FIS) and it reflects <strong>the</strong> expenditure activity incurred during <strong>the</strong>per<strong>for</strong>mance <strong>of</strong> sponsored projects. Expenses associated with projects supported by sales andservice agreements and clinical trials are excluded <strong>from</strong> this report.Expenditure Activity<strong>The</strong> University’s total research expenditures <strong>for</strong> FY11 amounted to $628 million, a 4% increaseover FY10. <strong>The</strong> University expended $61.6 million dollars under grants funded via <strong>the</strong>American Recovery and Reinvestment Act <strong>of</strong> 2009 (ARRA). <strong>The</strong> Total ARRA expendituresincreased 38%, or approximately $17 million <strong>from</strong> <strong>the</strong> prior year. <strong>The</strong> University also saw amodest increase in funding <strong>from</strong> private granting agencies. <strong>The</strong> NIH continues to provide <strong>the</strong>single largest funding stream, thus <strong>the</strong> costs <strong>for</strong> those projects represented 75% <strong>of</strong> totalexpenditures during <strong>the</strong> fiscal year. In addition to <strong>the</strong> NIH, <strong>the</strong> University also saw a modestincrease in expenses <strong>from</strong> projects funded by private sources.<strong>The</strong> University continues to maintain a strong position in sponsored research during FY11.Detailed schedules regarding this activity have been compiled this data in several <strong>for</strong>mats, seeTables 1 – 12. Noted below are definitions and descriptions <strong>of</strong> <strong>the</strong> key expenditure categories.Sponsor / Sponsor TypeFederal Direct Agreements Expenditures incurred under sponsored agreements awarded by aFederal agency directly to <strong>the</strong> University.• DHHS - Department <strong>of</strong> Health and Human Services(Agencies o<strong>the</strong>r than HRSA and NIH)• DOD - Department <strong>of</strong> Defense (Includes Air Force, Army,Navy, DARPA, and ARPA)• DOE - Department <strong>of</strong> Energy• EPA - Environmental Protection Agency• HRSA - Health Resources and Services Administration (Adivision <strong>of</strong> DHHS)75


