Mechanical and thermo-mechanical studies of double networks ...
Mechanical and thermo-mechanical studies of double networks ...
Mechanical and thermo-mechanical studies of double networks ...

You also want an ePaper? Increase the reach of your titles
YUMPU automatically turns print PDFs into web optimized ePapers that Google loves.
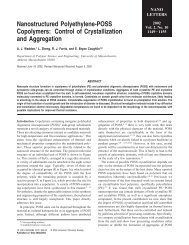
ARTICLEFIGURE 5 Free radical crosslinking mechanism in styrenic <strong>and</strong> olefinic phase.benzophenone was used. 44 Using benzophenone can resultin an increase in crosslinking in both styrenic as well as olefinicphases, <strong>and</strong> reduce the scission reactions.The photo crosslinking <strong>of</strong> EPDM has also been studied, 35,45–48<strong>and</strong> the mechanism is shown in Figure 6. A photoinitiatorsuch as benzophenone is used to crosslink the ethylene norborneneunsaturation.Infra-Red SpectroscopyFourier transform infrared (FTIR) spectroscopy was utilizedto qualitatively determine the extent <strong>of</strong> crosslinking. Infraredspectra were obtained on a Perkin–Elmer Spectrum OneFTIR spectrometer.<strong>Mechanical</strong> PropertiesMonotonic uniaxial tensile properties were determined usingan Instron 4411 tensile test machine, at a constant crossheadspeed <strong>of</strong> 20 mm/min at 23 C. ASTM D1708 test geometrywas used for all the samples used for <strong>mechanical</strong> testingas shown in Figure 7. 49 Samples were tested in the directionparallel to the direction <strong>of</strong> stretch during cure.The engineering stress versus extension ratio curves wereplotted for these <strong>double</strong> <strong>networks</strong>, where extension ratios(k t ) were calculated based on the final equilibrium length <strong>of</strong>these <strong>double</strong> <strong>networks</strong>. These stress versus extension ratiocurves were used to calculate the effective crosslink density,which contains a contribution attributed to chain entanglements<strong>and</strong> loose chain ends acting as crosslinks in rubber.The effective crosslink density was calculated according tothe Mooney–Rivlin equation, shown in eq 2.t ¼r2RTðk t 1k t2 Þwheret ¼ the effective crosslink density;r ¼ the engineering stress;R ¼ the universal gas constant;T ¼ the absolute temperature;k t ¼ the extension ratio <strong>of</strong> the sample.Dynamic <strong>Mechanical</strong> AnalysisDynamic <strong>mechanical</strong> properties were determined using aDynamic <strong>Mechanical</strong> Analyzer (TA Instruments-DMA 2980)at a constant frequency <strong>of</strong> 1 Hz <strong>and</strong> 0.1% strain. Thin filmsamples were oscillated in the direction parallel to thestretch direction during cure, over a temperature range <strong>of</strong>80 to 250 C, ramped at 5 C/min.Thermo-<strong>Mechanical</strong> PropertiesThermo-<strong>mechanical</strong> properties, including the thermal stabilityunder load <strong>and</strong> coefficient <strong>of</strong> thermal expansion, were(2)FIGURE 6 Free radical crosslinking mechanism via norborneneunsaturation <strong>of</strong> EPDM.FIGURE 7 Specimen geometry for the ASTM D 1708 st<strong>and</strong>ard.DOUBLE NETWORK ELASTOMERIC SYSTEMS, SINGH AND LESSER 781
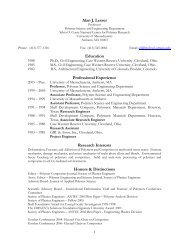
JOURNAL OF POLYMER SCIENCE: PART B: POLYMER PHYSICS DOI 10.1002/POLBFIGURE 8 Infrared spectrograph (a) SEBS <strong>double</strong> network <strong>and</strong> (b) EPDM <strong>double</strong> network, each compared with samples with k c ¼ 1.studied using the film/fiber probe in TA instrument Thermo-<strong>Mechanical</strong> Analyzer (TMA) 2940CE, at constant load <strong>of</strong>0.05 N <strong>and</strong> heating rate <strong>of</strong> 3 C/min.RESULTS AND DISCUSSIONExtent <strong>of</strong> CrosslinkingThe extent <strong>of</strong> crosslinking in both SEBS <strong>and</strong> EPDM wasdetermined qualitatively using infrared spectroscopy. Thepeak chosen to compare the different samples <strong>of</strong> SEBS wasat 3400 cm 1 , which corresponds to the hydroxyl-groupbased side products which are formed in competition withthe crosslinking reaction. Hence, higher peak intensity correspondsto lower extent <strong>of</strong> crosslinking. The peak chosen tocompare the different samples <strong>of</strong> EPDM was at 808 cm 1 ,which corresponds to the norbornene unsaturation. Hence,higher peak intensity corresponds to higher extent <strong>of</strong> crosslinking.In both systems, the chosen peak intensity decreaseswith an increase in k c , as shown in Figure 8.The increase in extent <strong>of</strong> curing can be attributed to decreasein thickness <strong>and</strong> increase in surface area available for UVcrosslinking when the samples are stretched to higher k c .AsUV crosslinking is governed by the penetration depth, a lowerthickness will lead to a higher extent <strong>of</strong> crosslinking. Polymerchain orientation causes crowding <strong>of</strong> chains <strong>and</strong> there is ahigher probability <strong>of</strong> two chains combining together to form acrosslink than leading to other side scission reactions.Tensile ResponseSEBS samples were stretched to various k c <strong>and</strong>thencured.Whereas EPDM samples were partially cured <strong>and</strong> thenextended to k c before curing them further. The percent permanentset <strong>and</strong> the residual extension ratio <strong>of</strong> the various<strong>double</strong>-networked rubbers, along with their <strong>mechanical</strong>properties, are given in Tables 2 <strong>and</strong> 3. The residual strain<strong>and</strong> permanent set were calculated based on eqs 3 <strong>and</strong> 4,respectively. 4wheree R ¼ 1 s1 u(3)e P ¼ l s l ul x l u(4)e R ¼ Residual Straine P ¼ Permanent Setl s ¼ Set lengthl u ¼ Unstretched Lengthl x ¼ Stretched LengthTABLE 2 Summary <strong>of</strong> <strong>Mechanical</strong> Properties <strong>of</strong> SEBS Samples Cured at Different k ck cPermanentSet (e P )ResidualStrain (e R )InitialModulus (MPa)FinalModulus (MPa)Elongation atBreak (%)Toughness(MPa)1 – 1.00 10.63 2.6 130 3.231.5 0.72 1.36 9.35 3.7 150 5.462 0.57 1.57 7.55 4.6 133 4.253 0.56 2.12 7.03 7.1 103 3.334 0.49 2.48 6.88 8.8 118 4.58782 INTERSCIENCE.WILEY.COM/JOURNAL/JPOLB
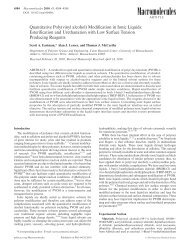
ARTICLETABLE 3 Summary <strong>of</strong> <strong>Mechanical</strong> Properties <strong>of</strong> EPDM Samples Cured at Different k ck cPermanentSet (e P )ResidualStrain (e R )InitialModulus (MPa)FinalModulus (MPa)Elongationat Break (%)Toughness(MPa)1 – 1.00 3.65 1.68 318 3.581.5 0.74 1.37 3.04 1.83 183 1.872 0.67 1.67 2.81 2.02 136 1.413 0.57 2.14 3.56 2.28 100 1.094 0.52 2.56 3.35 2.36 121 1.96The aforementioned parameters are shown in Figure 9.From Tables 2 <strong>and</strong> 3, it is evident that there is a significantimprovement in overall <strong>mechanical</strong> properties <strong>of</strong> <strong>double</strong> <strong>networks</strong>formed in a stretched state as opposed to anunstretched state (k c ¼ 1). Figure 10 shows uniaxial stressversus k t curves for the SEBS <strong>double</strong> network systems. Samplestested were single network (uncured) <strong>and</strong> <strong>double</strong> <strong>networks</strong>prepared at k c ¼ 1, 1.5, 2, 3, <strong>and</strong> 4. It is evident fromFigure 10(a) that, even having the same crosslink time in allthe cured samples, the <strong>double</strong> network samples exhibithigher ultimate modulus compared with both the uncured<strong>and</strong> the k c ¼ 1 <strong>double</strong> network. This agrees with independentnetwork hypothesis. Analyzing the data carefully, it isevident from Figure 10(b) that there is a transition in modulusdetectable in the <strong>double</strong> network elastomer which isabsent in both the uncured sample <strong>and</strong> the sample cured atk c ¼ 1. This is due to the fact that, below the transitionpoint, the two <strong>networks</strong> are in competition with each other,while above it, they become collaborative <strong>and</strong> act in parallel,leading to an increase in modulus. The position <strong>of</strong> the transitionpoint is dependent on k c .Compared with the uncured polymer, the samples cured atk c ¼ 1.5 <strong>and</strong> 2 show a lower modulus at lower k t <strong>and</strong> ahigher modulus at higher k t , but do not exhibit strain hardeningat higher k t . Samples cured at k c ¼ 3 <strong>and</strong> 4 show aninitial drop, as compared to the one cured at k c ¼ 1, followedby an increase in the modulus, along with strain hardening.The decrease in initial modulus, while carrying outmonotonic uniaxial tensile test in all the samples is a result<strong>of</strong> the competitive behavior <strong>of</strong> the two <strong>networks</strong> <strong>and</strong> due toheat exchange between these <strong>networks</strong>. The samples curedat higher k c shows strain hardening behavior at a lower k tvalue as compared to the one cured at k c ¼ 1, hence indicatingthe permanent anisotropy embedded in the <strong>double</strong> networkelastomer. This results in increase in the modulus <strong>of</strong>the <strong>double</strong> <strong>networks</strong> even at moderate k t .FIGURE 9 Diagram representing various parameters used tocalculate permanent set <strong>and</strong> residual strain.Similar behavior was observed in the case <strong>of</strong> EPDM asshown in Figure 11(a). There is an increase in modulus withincrease in k c , at values <strong>of</strong> k t beyond the transition points asshown in Figure 11(b). As the curing conditions <strong>of</strong> theEPDM <strong>double</strong> network samples have not been optimized, thetransition points are not easily separated <strong>and</strong> are very lowdue to incomplete curing.This nonlinear behavior is also evident from the Mooney–Rivlincurveshown in Figure 12, where the reduced stressrðk is plotted against the inverse <strong>of</strong> k t .Itisobservedthatt 1 Þ k t2the SEBS <strong>double</strong> network elastomers are highly nonlinear systems,whereas EPDM samples are more linear. SEBS samplesshow nonlinear behavior at smaller k t as compared to theuncured samples <strong>and</strong> the samples cured at k c ¼ 1, <strong>and</strong> thisnonlinear behavior increases with an increase in k c . EPDM<strong>double</strong> network samples show slight nonlinearity withincrease in k c .On the basis <strong>of</strong> the Mooney–Rivlin equation, the concentrations<strong>of</strong> physically effective crosslinks were calculated <strong>and</strong>are shown in Figure 13. The best fit was calculated based onthe linear region <strong>of</strong> the Mooney–Rivlin plot. Even with thesame curing dosages, the crosslink density increases withincrease in k c . This is in agreement with the FTIR results<strong>and</strong> can be attributed to the increase in surface area <strong>and</strong>decrease in thickness with increase in k c . This also concurswith an increase in the polymer chain orientation, leading tohigher probability <strong>of</strong> crosslinking reactions as comparedwith chain scission reactions.Dynamic <strong>Mechanical</strong> AnalysisThe introduction <strong>of</strong> <strong>double</strong> <strong>networks</strong> changes the modulus <strong>of</strong>the material. The storage modulus values for SEBS <strong>and</strong>EPDM samples are plotted against temperature for samplescured at different k c , as shown in Figures 14 <strong>and</strong> 15. Thegraphs can be divided into three distinct regions: the glassyregion, the transition (leathery) region, <strong>and</strong> the rubberyregion. The plateau modulus in the rubbery region is lowerfor <strong>double</strong>-networked samples cured at higher k c . Hence, thestorage modulus curves follow the <strong>thermo</strong>dynamic behavior<strong>and</strong> are governed by the entropy <strong>of</strong> the system. The drop instorage modulus plateau with an increase in k c may be associatedwith the competitive nature <strong>of</strong> the two <strong>networks</strong>formed in the sample, which was strained at a very smallstrain <strong>and</strong> at low frequency. This causes a decrease in overallDOUBLE NETWORK ELASTOMERIC SYSTEMS, SINGH AND LESSER 783
JOURNAL OF POLYMER SCIENCE: PART B: POLYMER PHYSICS DOI 10.1002/POLBFIGURE 10 Tensile results <strong>of</strong> SEBS samples cured at different k c (a) Full stress-extension results, (b) Closeup <strong>of</strong> low extension regime.FIGURE 11 Tensile results <strong>of</strong> EPDM samples cured at different k c (a) Full stress-extension results, (b) Closeup <strong>of</strong> low extension regime.FIGURE 12 Mooney–Rivlin plot (a) SEBS, (b) EPDM; corresponding to Figures 10 <strong>and</strong> 11.784 INTERSCIENCE.WILEY.COM/JOURNAL/JPOLB
ARTICLEFIGURE 13 Physical effective crosslink densities <strong>of</strong> <strong>double</strong> networkSEBS <strong>and</strong> EPDM calculated from the Mooney–Rivlin plotshown in Figure 12.modulus <strong>of</strong> the <strong>double</strong> network system in the rubbery region<strong>of</strong> the elastomer.The loss modulus values versus temperature for SEBS <strong>and</strong>EPDM are shown in Figure 16. In the rubbery regions <strong>of</strong>both the SEBS <strong>and</strong> EPDM <strong>double</strong> network, the loss modulus<strong>of</strong> the <strong>networks</strong> decreases with increase in k c . Even in theglassy regime there is slight decrease in the loss modulus,which suggests that there is an increase in crosslinking withincrease in k c . This also suggests that there is less viscousbehavior <strong>of</strong> the samples with higher degree <strong>of</strong> crosslinking.Crosslinking increases the glass transition temperature (T g )<strong>of</strong> a polymer by introducing restrictions in the molecularmotions <strong>of</strong> the chains. The plot <strong>of</strong> tan d as a function <strong>of</strong> temperaturefor SEBS <strong>and</strong> EPDM is shown in Figure 17. Thepeak <strong>of</strong> the curve is taken as the T g . The T g values <strong>of</strong> bothFIGURE 15 Storage modulus <strong>of</strong> the <strong>double</strong> network EPDMsamples.the polyolefin <strong>and</strong> the polystyrene phases show an increasewith increase in crosslink density for SEBS. EPDM alsoexhibits an increase in T g . This increase in T g can beexplained on the basis <strong>of</strong> increase in crosslink density withincrease in k c <strong>and</strong> negligible effect <strong>of</strong> orientation <strong>of</strong> chains asstudied by Munch et al. 50 The peak area is a measure <strong>of</strong> <strong>mechanical</strong>damping ability 27 <strong>and</strong> can be related to the serviceperformance <strong>of</strong> the products. A slight increase in damping isobserved in both SEBS <strong>and</strong> EPDM as shown in Figure 18,with an increase in k c . This may be attributed to the competitivenature <strong>of</strong> the <strong>networks</strong> in the low strain regime, <strong>and</strong>may lead to better fatigue life as shown by Santangelo <strong>and</strong>Rol<strong>and</strong>. 28The tan d <strong>and</strong> loss modulus curves appear to correlate withtrue crosslink densities, showing an increase in crosslinkingwith increase in k c . However, the storage modulus followsthe competitive behavior <strong>of</strong> the <strong>double</strong> network <strong>and</strong> hencedecreases in the low k t regime with an increase in k c .Thermo-<strong>Mechanical</strong> AnalysisThe dimensional change measured at constant load as afunction <strong>of</strong> temperature is shown in Figure 19. The coefficient<strong>of</strong> thermal expansion (CTE) was calculated using thefollowing equation:a ¼ DL KDT L(5)wherea ¼ coefficient <strong>of</strong> expansion (lm/mm C);L ¼ sample length (mm);DL ¼ change in sample length (lm);DT ¼ change in temperature ( C);K ¼ cell constant.FIGURE 14 Storage modulus <strong>of</strong> the <strong>double</strong> network SEBSsamples.It is evident that the curing at k c ¼ 1 leads to a decrease inthe coefficient <strong>of</strong> thermal expansion (CTE) <strong>of</strong> both SEBS <strong>and</strong>DOUBLE NETWORK ELASTOMERIC SYSTEMS, SINGH AND LESSER 785
JOURNAL OF POLYMER SCIENCE: PART B: POLYMER PHYSICS DOI 10.1002/POLBFIGURE 16 Loss modulus <strong>of</strong> the <strong>double</strong> network (a) SEBS <strong>and</strong> (b) EPDM samples as compared to samples with k c ¼ 1.EPDM samples <strong>and</strong> an improved thermal stability under loadas compared to the uncured sample. Hence, it may be suitablefor high temperature applications.It is also evident that the samples cured at various k c showsinteresting behavior along with increase in temperature. Allthe SEBS samples with k c ¼ 1–4 show a transition at 55–60 C, at which only the physically crosslinked uncured samplesfailed. The CTE values <strong>of</strong> all the samples, before <strong>and</strong> afterthe transition point, are given in Table 4. The CTE valuesbefore the transition point are positive for the sample curedat k c ¼ 1. The samples cured at higher k c show a decrease inCTE <strong>and</strong> in the case <strong>of</strong> k c ¼ 4, it almost reaches zero. Thiscan be attributed to that fact that the second network isleading to increase in anisotropy in the direction <strong>of</strong> stretchdue to an increase in residual strain. They also show a transitionat 55–60 C, beyond which a negative CTE isobtained. This may be due to the expansion <strong>of</strong> the <strong>double</strong> networkelastomers before the transition point, with both the <strong>networks</strong>contributing in the expansion. However, beyond the transitionpoint, where one <strong>of</strong> the <strong>networks</strong> fails, the secondnetwork tries to attain equilibrium, <strong>and</strong> following entropicbehavior, contracts, which is seen as a negative CTE value. Thenegative CTE values also increase with increasing k c .Similar behavior is observed in the case <strong>of</strong> EPDM. The <strong>double</strong>network elastomers show a negative CTE <strong>and</strong> there is atransition point at 45 C, beyond which the slope decreasesfurther. The CTE values <strong>of</strong> all samples, before <strong>and</strong> after thetransition point, are given in Table 5. The samples do notshow a contraction after failure <strong>of</strong> the first network becauseboth <strong>networks</strong> are formed from chemical crosslinks.The first explanation <strong>of</strong> this kind <strong>of</strong> behavior <strong>of</strong> elastomerswas given by Govi to explain the Joule effect, whereFIGURE 17 Tan d <strong>of</strong> the <strong>double</strong> network (a) SEBS <strong>and</strong> (b) EPDM samples as compared to samples with k c ¼ 1.786 INTERSCIENCE.WILEY.COM/JOURNAL/JPOLB
ARTICLETABLE 4 Summary <strong>of</strong> Coefficient <strong>of</strong> Thermal Expansion<strong>of</strong> SEBSk ca BeforeTransition(lm/mm C)a AfterTransition(lm/mm C)1 0.60 1.811.5 0.33 1.042 0.58 1.553 0.24 2.454 0.020 2.47stretched state, which lead to contraction upon heating, evenwith higher crosslinking densities.FIGURE 18 Increase in area under the olefenic tan d peak <strong>of</strong>SEBS <strong>and</strong> EPDM with increase in k c .elastomers show a contraction when they are under strain.He assumed rubber as a ‘‘sort <strong>of</strong> solid foam composed <strong>of</strong> innumerablevesicles full <strong>of</strong> gas.’’ On stretching the rubber,according to him, the vesicles stretch in the direction <strong>of</strong>extension <strong>and</strong> contract in the perpendicular direction. Onapplication <strong>of</strong> heat, the gas in the vesicles will result inexpansion <strong>and</strong> each vesicle would want to return to its originalminimized free energy state <strong>of</strong> a sphere. This would leadto linear contraction. 51 The analogy to the gaseous behavior<strong>of</strong> rubbers suggests the entropic dependence <strong>of</strong> these elastomers.These <strong>double</strong> <strong>networks</strong> hence have stretched chains,frozen in the system, by introducing the second network inCONCLUSIONSSEBS- <strong>and</strong> EPDM-based <strong>double</strong> <strong>networks</strong> have been formed<strong>and</strong> investigated. In both systems, a competitive regime <strong>and</strong>a collaborative regime have been identified, <strong>and</strong> the transitionpoint is related to elongation <strong>of</strong> the sample during theformation <strong>of</strong> the second network. The storage modulusdecreases in the competitive regime, even though crosslinkdensity <strong>and</strong> T g increase <strong>and</strong> loss modulus decreases. Thisindicates the competitive regime is purely entropic <strong>and</strong> independent<strong>of</strong> the network changes, as observed between thephysical <strong>networks</strong> for SEBS <strong>and</strong> chemical <strong>networks</strong> forEPDM. Constitutive equations governing this behavior arestill to be investigated. These <strong>double</strong> network systems als<strong>of</strong>orm stiffer materials with higher crosslinking densities, yetshow a lower or even a negative coefficient <strong>of</strong> thermalexpansion, without addition <strong>of</strong> any filler. This is due to theentropic restrictions in this class <strong>of</strong> material. These materialsFIGURE 19 TMA results <strong>of</strong> (a) SEBS, (b) EPDM <strong>double</strong> network samples cured at different k c at constant load <strong>of</strong> 0.05 N <strong>and</strong> temperatureramp rate <strong>of</strong> 3 C/min.DOUBLE NETWORK ELASTOMERIC SYSTEMS, SINGH AND LESSER 787
JOURNAL OF POLYMER SCIENCE: PART B: POLYMER PHYSICS DOI 10.1002/POLBTABLE 5 Summary <strong>of</strong> Coefficient <strong>of</strong> Thermal Expansion<strong>of</strong> EPDMk ccan be very useful in many industrial applications such aslamination, where a balance <strong>of</strong> stiffness <strong>and</strong> expansion coefficientis required. They also have the potential to showimprovement in other properties, such as fatigue <strong>and</strong> toughness,because <strong>of</strong> a high dependence on the entropic behavior<strong>of</strong> chains. These properties, along with the <strong>thermo</strong>dynamics<strong>of</strong> these systems are still to be investigated.The authors gratefully acknowledge Kathryn Wright, KratonPolymers LLC for <strong>and</strong> Sudhin Datta, Exxon Mobil for providingthe materials used in this study.REFERENCES AND NOTESa BeforeTransition(lm/mm C)a AfterTransition(lm/mm C)1 0.112 1.171.5 0.61 1.162 2.442 5.393 2.832 6.834 2.914 9.031 Rol<strong>and</strong>, C. M.; Warzel, M. L. Rubber Chem Technol 1990, 63,285–297.2 Treloar, L. R. G. The Physics <strong>of</strong> Rubber Elasticity; Oxford UniversityPress: London, Engl<strong>and</strong>, 1975.3 Santangelo, P. G.; Rol<strong>and</strong>, C. M. Rubber Chem Technol 1994,67, 359–365.4 Andrews, R. D.; Tobolsky, A. V.; Hanson, E. E. J Appl Phys1946, 17, 352–361.5 Baldwin, F. P.; Woodbridge, N. J. U.S. Pat. 2,488,112 (1945).6 Erman, B. Biol Synth Polym Networks 1988, 497, 497–508.7 Miller, W.; Smith, C. W.; Mackenzie, D. S.; Evans, K. E. JMater Sci 2009, 44, 5441–5451.8 Flory, P. J. Trans Faraday Soc 1960, 56, 722–743.9 Kramer, O.; Ty, V.; Carpente, R. L.; Ferry, J. D. Bull Am PhysSoc 1973, 18, 318–318.10 Kramer, O.; Carpenter, R. L.; Ty, V.; Ferry, J. D. Macromolecules1974, 7, 79–84.11 Carpenter, R. L.; Kramer, O.; Ferry, J. D. Bull Am Phys Soc1977, 22, 429–429.12 Carpenter, R. L.; Kramer, O.; Ferry, J. D. Macromolecules1977, 10, 117–119.13 Carpenter, R. L.; Kramer, O.; Ferry, J. D. J Appl Polym Sci1978, 22, 335–342.14 Berry, J. P.; Scanlan, J.; Watson, W. F. Trans Faraday Soc1956, 52, 1137–1151.15 Flory, P. J. J Am Chem Soc 1956, 78, 5222–5234.16 Bax<strong>and</strong>all, L. G.; Edwards, S. F. Macromolecules 1988, 21,1763–1772.17 Okumura, K. Eur Lett 2004, 67, 470–476.18 Meissner, B.; Matjka, L. Polymer 2003, 44, 4611–4617.19 Budzien, J.; Rottach, D. R.; Curro, J. G.; Lo, C. S.; Thompson,A. P. Macromolecules 2008, 41, 9896–9903.20 Rottach, D. R.; Curro, J. G.; Budzien, J.; Grest, G. S.; Svaneborg,C.; Everaers, R. Macromolecules 2006, 39, 5521–5530.21 Rottach, D. R.; Curro, J. G.; Budzien, J.; Grest, G. S.; Svaneborg,C.; Everaers, R. Macromolecules 2007, 40, 131–139.22 Rottach, D. R.; Curro, J. G.; Grest, G. S.; Thompson, A. P.Macromolecules 2004, 37, 5468–5473.23 Svaneborg, C.; Everaers, R.; Grest, G. S.; Curro, J. G. Macromolecules2008, 41, 4920–4928.24 Gillen, K. T. Macromolecules 1988, 21, 442–446.25 Rol<strong>and</strong>, C. M.; Santangelo, P. G. World Pat. 95/26,367(1995).26 Rol<strong>and</strong>, C. M.; Peng, K. L. Rubber Chem Technol 1991, 64,790–800.27 Aprem, A. S.; Joseph, K.; Thomas, S. J Appl Polym Sci2004, 91, 1068–1076.28 Santangelo, P. G.; Rol<strong>and</strong>, C. M. Rubber Chem Technol2003, 76, 892–898.29 Mott, P. H.; Rol<strong>and</strong>, C. M. Macromolecules 2000, 33,4132–4137.30 Kaang, S.; Gong, D.; Nah, C. J Appl Polym Sci 1997, 65,917–924.31 Kaang, S.; Nah, C. Polymer 1998, 39, 2209–2214.32 Kaang, S.; Gong, D.; Nah, C.; Kim, S.; Kim, J. M. PolymKorea 1997, 21, 282–288.33 Marykut-Ry, C. V.; Mathew, G.; Thomas, S. Rubber ChemTechnol 2007, 80, 809–819.34 Santangelo, P. G.; Rol<strong>and</strong>, C. M. Rubber Chem Technol1995, 68, 124–131.35 Wang, J.; Hamed, G. R.; Umetsu, K.; Rol<strong>and</strong>, C. M. RubberChem Technol 2005, 78, 76–83.36 Indukuri, K. K.; Lesser, A. J. Polymer 2005, 46, 7218–7229.37 Wright, K. J.; Indukuri, K.; Lesser, A. J. Polym Eng Sci 2003,43, 531–542.38 Holden, G.; Legge, N. R.; Quirk, R.; Schroeder, H. E. ThermoplasticElastomers; Hanser/Gardner Publications, Inc.: Cincinnati,1996.39 Singh, N. K.; Lesser, A. J. Soc Plast Eng Annu Tech Conf2009, 67, 868–873.40 Lesser, A. J.; Singh, N. K.; Mamodia, M. (to University <strong>of</strong>Massachusetts, Amherst). U.S. /12/615,717, (2009).41 Allen, N. S.; Edge, M.; Wilkinson, A.; Liauw, C. M.; Mourelatou,D.; Barrio, J.; Martinez-Zaporta, M. A. Polym Degrad Stab2000, 71, 113–122.788 INTERSCIENCE.WILEY.COM/JOURNAL/JPOLB
ARTICLE42 Luengo, C.; Allen, N. S.; Edge, M.; Wilkinson, A.; Parellada, M. D.;Barrio, J. A.; Santa, V. R. Polym Degrad Stab 2006, 91, 947–956.43 Allen, N. S.; Edge, M.; Mourelatou, D.; Wilkinson, A.; Liauw,C. M.; Parellada, M. D.; Barrio, J. A.; Quiteria, V. R. S. PolymDegrad Stab 2003, 79, 297–307.44 Ramaratnam, K.; Malphrus, J.; Luzinov, I. Polym Mater SciEng 2006, 95, 856–857.45 Hilborn, J.; Ranby, B. Rubber Chem Technol 1988, 61,568–576.46 Hilborn, J.; Ranby, B. Rubber Chem Technol 1989, 62,592–608.47 Wang, W. Z. J Appl Polym Sci 2004, 93, 1837–1845.48 Wang, W. Z.; Wu, Q. H.; Qu, B. J. Chem Res Chin Univ2004, 20, 111–113.49 ASTM. St<strong>and</strong>ard test method for tensile properties <strong>of</strong> plasticsby use <strong>of</strong> microtensile specimens, ASTM D 1708–02a, WestConshohocken, PA, 2002; p 3.50 Munch, E.; Pelletier, J. M.; Sixou, B.; Vigier, G. Polymer2006, 47, 3477–3485.51 Whitby, G. S. Monographs on Industrial Chemistry—PlantationRubber <strong>and</strong> the Testing <strong>of</strong> Rubber; Longmans Green <strong>and</strong>Co.: Manchester, London, 1920; p 459.DOUBLE NETWORK ELASTOMERIC SYSTEMS, SINGH AND LESSER 789