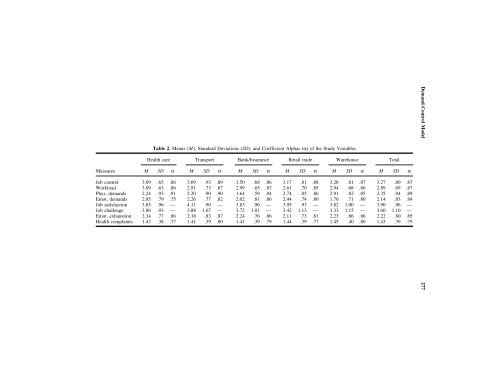
276 de Jonge, Dollard, Dormann, Le Blanc, and Houtmanlinear terms as well as an interaction term (Bollen, 1989; Kenny & Judd, 1984).This was done by performing two analytic steps (Aiken & West, 1991; Jaccard,Turrisi, & Wan, 1990): (1) the job characteristics were mean-centered in orderto prevent multicollinearity, and (2) the interaction terms of the job characteristicswere computed from these centered variables.Next, two structural models were fitted to the d<strong>at</strong>a in two steps. First, amodel M 1 without interaction effects was specified, followed by a model M 2with interaction effects. Accordingly, the assumptions of the DCM were testedagainst the null hypothesis (H 0 ) th<strong>at</strong> there are no interactive rel<strong>at</strong>ionships. Differentnested models can be compared by a chi-square differences test (Bentler &Bonett, 1980; Jöreskog & Sörbom, 1993). Second, LISREL can also be used toanalyse several samples simultaneously to determine the extent to which a structuralequ<strong>at</strong>ion model fits for several different groups, as well as to examinewhether model differences exist between these groups in the analysis. So, usingthis technique, it is possible to test whether the proposed p<strong>at</strong>tern of rel<strong>at</strong>ionshipsis identical in all five subgroups (Schumacker & Lomax, 1996).Subsequently, several commonly used fit indices have been used to assessthe overall model fit (Jöreskog, 1993; Schumacker & Lomax, 1996): the chisquarest<strong>at</strong>istic (χ 2 ), the LISREL adjusted goodness-of-fit index (AGFI), the rootmean square error of approxim<strong>at</strong>ion (RMSEA), and finally the compar<strong>at</strong>ive fitindex (CFI).RESULTSPrior to the LISREL analyses, the means, standard devi<strong>at</strong>ions, and coefficientalphas were computed for both the five separ<strong>at</strong>e subgroups and the totalgroup (see Table 2). Table 2 shows th<strong>at</strong> all multiple-item measurement instrumentshad a coefficient alpha equal to or higher than .75. This also demonstr<strong>at</strong>esth<strong>at</strong> the instruments applied were equally valid (reliable) across the differentsubgroups. Furthermore, we computed coefficients of vari<strong>at</strong>ion (standard devi<strong>at</strong>iondivided by mean; see Ganster & Fusilier, 1989) for each of the job characteristicsand displayed the results in Table 3. In general, it is apparent th<strong>at</strong> thereis as much variability in the five subgroups as there is in the total group.Covariance m<strong>at</strong>rices were used in order to analyse the structural equ<strong>at</strong>ionmodels (available from the first author). We first analysed the covariance m<strong>at</strong>rixobtained for the whole sample (n = 2,485). <strong>Model</strong> M 1 was considered withoutinteraction effects and model M 2 was considered with interaction effects. <strong>The</strong>corresponding chi-square differences test showed th<strong>at</strong> the difference betweenthe two chi-squares was not significant (∆χ 2 (12) = 15.51, n.s.), which means th<strong>at</strong>H 0 is not rejected. In other words, an interactive model (M 2 ) has no better st<strong>at</strong>isticalfit (in terms of chi-square) than an additive model (M 1 ) within the total
<strong>Demand</strong>-<strong>Control</strong> <strong>Model</strong>Table 2. Means (M), Standard Devi<strong>at</strong>ions (SD), and Coefficient Alphas (α) of the <strong>Study</strong> VariablesHealth care Transport Bank/Insurance Retail trade Warehouse TotalMeasures M SD α M SD α M SD α M SD α M SD α M SD αJob control 3.09 .65 .86 3.09 .93 .89 3.50 .68 .86 3.17 .81 .88 3.28 .81 .87 3.27 .80 .87Workload 3.09 .63 .86 2.91 .73 .87 2.99 .65 .87 2.61 .70 .85 2.94 .68 .86 2.89 .69 .87Phys. demands 2.24 .93 .91 2.20 .90 .90 1.64 .59 .84 2.74 .85 .86 2.91 .82 .85 2.35 .94 .89Emot. demands 2.85 .79 .75 2.26 .77 .82 2.02 .81 .86 2.44 .74 .80 1.76 .71 .80 2.14 .83 .84Job s<strong>at</strong>isfaction 3.85 .96 — 4.11 .90 — 3.83 .96 — 3.95 .93 — 3.82 1.00 — 3.90 .96 —Job challenge 3.86 .93 — 3.88 1.07 — 3.72 1.01 — 3.42 1.13 — 3.33 1.15 — 3.60 1.10 —Emot. exhaustion 2.34 .77 .86 2.18 .83 .87 2.24 .76 .86 2.11 .73 .81 2.23 .86 .86 2.22 .80 .85Health complaints 1.43 .38 .77 1.41 .39 .80 1.41 .39 .79 1.44 .39 .77 1.45 .40 .80 1.43 .39 .79277
- Page 2: 270 de Jonge, Dollard, Dormann, Le
- Page 6 and 7: 274 de Jonge, Dollard, Dormann, Le
- Page 10 and 11: 278 de Jonge, Dollard, Dormann, Le
- Page 12 and 13: 280 de Jonge, Dollard, Dormann, Le
- Page 14 and 15: 282 de Jonge, Dollard, Dormann, Le
- Page 16 and 17: 284 de Jonge, Dollard, Dormann, Le
- Page 18 and 19: 286 de Jonge, Dollard, Dormann, Le