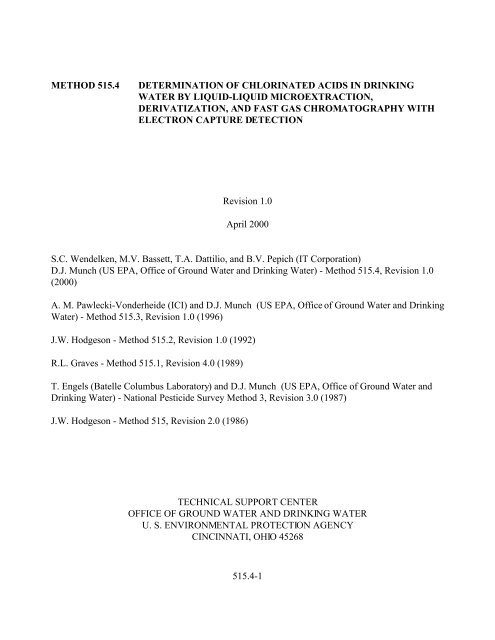
method 515.4 determination of chlorinated acids in drinking water
method 515.4 determination of chlorinated acids in drinking water
method 515.4 determination of chlorinated acids in drinking water
You also want an ePaper? Increase the reach of your titles
YUMPU automatically turns print PDFs into web optimized ePapers that Google loves.
samples) extracted together by the same person(s) dur<strong>in</strong>g a work day us<strong>in</strong>g the samelots <strong>of</strong> solvents, surrogate solution, and fortify<strong>in</strong>g solutions. Required QC samples<strong>in</strong>clude Laboratory Reagent Blank, Laboratory Fortified Matrix, and either a FieldDuplicate or Laboratory Fortified Matrix Duplicate.3.2 ANALYSIS BATCH – A set <strong>of</strong> samples that is analyzed on the same <strong>in</strong>strumentdur<strong>in</strong>g a 24-hour period that beg<strong>in</strong>s and ends with the analysis <strong>of</strong> the appropriateCont<strong>in</strong>u<strong>in</strong>g Calibration Check standards (CCC). Additional CCCs may be requireddepend<strong>in</strong>g on the length <strong>of</strong> the analysis batch and/or the number <strong>of</strong> Field Samples.3.3 INTERNAL STANDARD (IS) – A pure analyte added to an extract or standardsolution <strong>in</strong> a known amount and used to measure the relative responses <strong>of</strong> other<strong>method</strong> analytes and surrogates. The <strong>in</strong>ternal standard must be an analyte that is not asample component.3.4 SURROGATE ANALYTE (SUR) – A pure analyte, which is extremely unlikely to befound <strong>in</strong> any sample, and which is added to a sample aliquot <strong>in</strong> a known amountbefore extraction or other process<strong>in</strong>g, and is measured with the same procedures usedto measure other sample components. The purpose <strong>of</strong> the SUR is to monitor <strong>method</strong>performance with each sample.3.5 LABORATORY REAGENT BLANK (LRB) – An aliquot <strong>of</strong> reagent <strong>water</strong> or otherblank matrix that is treated exactly as a sample <strong>in</strong>clud<strong>in</strong>g exposure to all glassware,equipment, solvents, reagents, sample preservatives, <strong>in</strong>ternal standards, and surrogatesthat are used <strong>in</strong> the extraction batch. The LRB is used to determ<strong>in</strong>e if <strong>method</strong>analytes or other <strong>in</strong>terferences are present <strong>in</strong> the laboratory environment, the reagents,or the apparatus.3.6 LABORATORY FORTIFIED BLANK (LFB) – An aliquot <strong>of</strong> reagent <strong>water</strong> or otherblank matrix to which known quantities <strong>of</strong> the <strong>method</strong> analytes and all thepreservation compounds are added. The LFB is analyzed exactly like a sample, andits purpose is to determ<strong>in</strong>e whether the <strong>method</strong>ology is <strong>in</strong> control, and whether thelaboratory is capable <strong>of</strong> mak<strong>in</strong>g accurate and precise measurements.3.7 LABORATORY FORTIFIED SAMPLE MATRIX (LFM) – An aliquot <strong>of</strong> anenvironmental sample to which known quantities <strong>of</strong> the <strong>method</strong> analytes and all thepreservation compounds are added <strong>in</strong> the laboratory. The LFM is analyzed exactlylike a sample, and its purpose is to determ<strong>in</strong>e whether the sample matrix contributesbias to the analytical results. The background concentrations <strong>of</strong> the analytes <strong>in</strong> thesample matrix must be determ<strong>in</strong>ed <strong>in</strong> a separate aliquot and the measured values <strong>in</strong>the LFM corrected for background concentrations.3.8 LABORATORY FORTIFIED SAMPLE MATRIX DUPLICATE (LFMD) – A<strong>515.4</strong>-4
second aliquot <strong>of</strong> the Field Sample used to prepare the LFM which is fortified,extracted and analyzed identically. The LFMD is used <strong>in</strong>stead <strong>of</strong> the Field Duplicateto access <strong>method</strong> precision and accuracy when the occurrence <strong>of</strong> target analytes islow.3.9 LABORATORY DUPLICATES (LD1 and LD2) – Two aliquots <strong>of</strong> the same sampletaken <strong>in</strong> the laboratory and analyzed separately with identical procedures. Analyses <strong>of</strong>LD1 and LD2 <strong>in</strong>dicate precision associated with laboratory procedures, but not withsample collection, preservation, and storage procedures.3.10 FIELD DUPLICATES (FD1 and FD2) – Two separate samples collected at the sametime and place under identical circumstances, and treated exactly the same throughoutfield and laboratory procedures. Analyses <strong>of</strong> FD1 and FD2 give a measure <strong>of</strong> theprecision associated with sample collection, preservation, and storage, as well as withlaboratory procedures.3.11 STOCK STANDARD SOLUTION (SSS) – A concentrated solution conta<strong>in</strong><strong>in</strong>g oneor more <strong>method</strong> analytes prepared <strong>in</strong> the laboratory us<strong>in</strong>g assayed reference materialsor purchased from a reputable commercial source.3.12 PRIMARY DILUTION STANDARD SOLUTION (PDS) – A solution conta<strong>in</strong><strong>in</strong>g<strong>method</strong> analytes prepared <strong>in</strong> the laboratory from stock standard solutions and dilutedas needed to prepare calibration solutions and other needed analyte solutions.3.13 CALIBRATION STANDARD (CAL) – A solution prepared from the primarydilution standard solution or stock standard solutions and the <strong>in</strong>ternal standards andsurrogate analytes. The CAL solutions are used to calibrate the <strong>in</strong>strument responsewith respect to analyte concentration.3.14 CONTINUING CALIBRATION CHECK (CCC) – A calibration standard conta<strong>in</strong><strong>in</strong>gone or more <strong>method</strong> analytes, which is analyzed periodically to verify the accuracy <strong>of</strong>the exist<strong>in</strong>g calibration for those analytes.3.15 QUALITY CONTROL SAMPLE (QCS) – A solution <strong>of</strong> <strong>method</strong> analytes <strong>of</strong> knownconcentrations that is obta<strong>in</strong>ed from a source external to the laboratory and differentfrom the source <strong>of</strong> calibration standards. It is used to check standard <strong>in</strong>tegrity.3.16 DETECTION LIMIT – The m<strong>in</strong>imum concentration <strong>of</strong> an analyte that can beidentified, measured and reported with 99% confidence that the analyte concentrationis greater than zero (Section 9.2.4). This is a statistical <strong>determ<strong>in</strong>ation</strong> <strong>of</strong> precision.Accurate quantitation is not expected at this level. (1)3.17 MINIMUM REPORTING LEVEL (MRL) – The m<strong>in</strong>imum concentration that can be<strong>515.4</strong>-5
eported as a quantified value for a target analyte <strong>in</strong> a sample follow<strong>in</strong>g analysis. Thisdef<strong>in</strong>ed concentration can be no lower than the concentration <strong>of</strong> the lowest cont<strong>in</strong>u<strong>in</strong>gcalibration standard for that analyte, and can only be used if acceptable quality controlcriteria for this standard are met.3.18 PROCEDURAL STANDARD CALIBRATION – A calibration <strong>method</strong> whereaqueous calibration standards are prepared and processed (e.g., purged, extracted,and/or derivatized) <strong>in</strong> exactly the same manner as a sample. All steps <strong>in</strong> the processfrom addition <strong>of</strong> sampl<strong>in</strong>g preservatives through <strong>in</strong>strumental analyses are <strong>in</strong>cluded <strong>in</strong>the calibration. Us<strong>in</strong>g procedural standard calibration compensates for any<strong>in</strong>efficiencies <strong>in</strong> the process<strong>in</strong>g procedure.3.19 MATERIAL SAFETY DATA SHEET (MSDS) – Written <strong>in</strong>formation provided byvendors concern<strong>in</strong>g a chemical’s toxicity, health hazards, physical properties, fire, andreactivity data <strong>in</strong>clud<strong>in</strong>g storage, spill, and handl<strong>in</strong>g precautions.4. INTERFERENCES4.1 All glassware must be meticulously cleaned. Wash glassware with detergent and tap<strong>water</strong>, r<strong>in</strong>se with tap <strong>water</strong>, followed by reagent <strong>water</strong>. A f<strong>in</strong>al r<strong>in</strong>se with solventsmay be needed. In place <strong>of</strong> a solvent r<strong>in</strong>se, non-volumetric glassware can be muffledat 400 o C for 2 hours. Volumetric glassware should not be heated <strong>in</strong> an oven above120 o C. Store <strong>in</strong>verted or capped with alum<strong>in</strong>um foil.4.2 Method <strong>in</strong>terferences may be caused by contam<strong>in</strong>ants <strong>in</strong> solvents, reagents (<strong>in</strong>clud<strong>in</strong>greagent <strong>water</strong>), sample bottles and caps, and other sample process<strong>in</strong>g hardware thatlead to discrete artifacts and/or elevated basel<strong>in</strong>es <strong>in</strong> the chromatograms. All itemssuch as these must be rout<strong>in</strong>ely demonstrated to be free from <strong>in</strong>terferences (less than1/ 3 the MRL for each target) under the conditions <strong>of</strong> the analysis by analyz<strong>in</strong>glaboratory reagent blanks as described <strong>in</strong> Section 9. Subtract<strong>in</strong>g blank values fromsample results is not permitted.4.2.1 Dur<strong>in</strong>g <strong>method</strong> development it was found that sodium sulfate from severalsources conta<strong>in</strong>ed multiple <strong>in</strong>terferences. After screen<strong>in</strong>g several brands, itwas found that a grade suitable for pesticide residue analysis provided the bestresults. If the suitability <strong>of</strong> the available sodium sulfate is <strong>in</strong> question, extractand analyze a laboratory reagent blank (section 3.5) to test for <strong>in</strong>terferencesprior to sample process<strong>in</strong>g.4.3 Matrix <strong>in</strong>terferences may be caused by contam<strong>in</strong>ants that are extracted from thesample. The extent <strong>of</strong> matrix <strong>in</strong>terferences will vary considerably from source tosource, depend<strong>in</strong>g upon the <strong>water</strong> sampled.<strong>515.4</strong>-6
4.3.1 Dur<strong>in</strong>g <strong>method</strong> development a contam<strong>in</strong>ant was found <strong>in</strong> local ground <strong>water</strong>and surface <strong>water</strong> that <strong>in</strong>terfered with the analysis <strong>of</strong> Dalapon on the primarycolumn. Due to this <strong>in</strong>terferent, it was necessary to carefully optimize thechromatographic conditions (see Table 1). A slow <strong>in</strong>itial temperature programwas needed to ensure separation <strong>of</strong> the <strong>in</strong>terferent from Dalapon. Analyteidentifications should be confirmed us<strong>in</strong>g the confirmation column specified<strong>in</strong> Table 2 or another column that is dissimilar to the primary column or byGC/MS if the concentrations are sufficient.4.4 Interferences by phthalate esters can pose a major problem <strong>in</strong> pesticide analysis whenus<strong>in</strong>g an electron capture detector (ECD). These compounds generally appear <strong>in</strong> thechromatogram as large peaks. Common flexible plastics conta<strong>in</strong> vary<strong>in</strong>g amounts <strong>of</strong>phthalates that are easily extracted or leached dur<strong>in</strong>g laboratory operations. Crosscontam<strong>in</strong>ation <strong>of</strong> clean glassware rout<strong>in</strong>ely occurs when plastics are handled dur<strong>in</strong>gextraction steps, especially when solvent-wetted surfaces are handled. Interferencesfrom phthalates can best be m<strong>in</strong>imized by avoid<strong>in</strong>g the use <strong>of</strong> plastics <strong>in</strong> thelaboratory. Exhaustive purification <strong>of</strong> reagents and glassware may be required toelim<strong>in</strong>ate background phthalate contam<strong>in</strong>ation. (2,3)5. SAFETY5.1 The toxicity or carc<strong>in</strong>ogenicity <strong>of</strong> each reagent used <strong>in</strong> this <strong>method</strong> has not beenprecisely def<strong>in</strong>ed. Each chemical compound should be treated as a potential healthhazard, and exposure to these chemicals should be m<strong>in</strong>imized. The laboratory isresponsible for ma<strong>in</strong>ta<strong>in</strong><strong>in</strong>g a current awareness file <strong>of</strong> OSHA regulations regard<strong>in</strong>gthe safe handl<strong>in</strong>g <strong>of</strong> the chemicals specified <strong>in</strong> this <strong>method</strong>. A reference file <strong>of</strong>MSDSs should also be made available to all personnel <strong>in</strong>volved <strong>in</strong> the chemicalanalysis. Additional references to laboratory safety are available. (4-6)5.2 Pure standard materials and stock standards <strong>of</strong> these compounds should be handledwith suitable protection to sk<strong>in</strong> and eyes, and care should be taken not to breathe thevapors or <strong>in</strong>gest the materials.5.3 The toxicity <strong>of</strong> the extraction solvent, MTBE, has not been well def<strong>in</strong>ed. Susceptible<strong>in</strong>dividuals may experience adverse affects upon sk<strong>in</strong> contact or <strong>in</strong>halation <strong>of</strong> vapors.Therefore protective cloth<strong>in</strong>g and gloves should be used and MTBE should be usedonly <strong>in</strong> a chemical fume hood or glove box. The same precaution applies to purestandard materials.5.4 Diazomethane is a toxic carc<strong>in</strong>ogen which can explode under certa<strong>in</strong> conditions. Thefollow<strong>in</strong>g precautions must be followed.5.4.1 Use the diazomethane generator beh<strong>in</strong>d a safety shield <strong>in</strong> a well ventilated<strong>515.4</strong>-7
fume hood. Under no circumstances can the generator be heated above 90°C,and all gr<strong>in</strong>d<strong>in</strong>g surfaces such as ground glass jo<strong>in</strong>ts, sleeve bear<strong>in</strong>gs and glassstirrers must be avoided. To m<strong>in</strong>imize safety hazards, the diazomethanegenerator apparatus used <strong>in</strong> the esterification procedure (Sect 11.2) producesmicro molar amounts <strong>of</strong> diazomethane <strong>in</strong> solution. If the procedure isfollowed carefully, no possibility for explosion exists.5.5 Although hydrogen can be safely used as a carrier gas, the potential for fire orexplosion does exist if the gas system is mishandled. If you are unsure <strong>of</strong> the safetyguidel<strong>in</strong>es for us<strong>in</strong>g hydrogen as a carrier gas, seek advice from your <strong>in</strong>strumentmanufacturer regard<strong>in</strong>g its use.6. APPARATUS AND EQUIPMENT6.1 SAMPLE CONTAINERS – Amber glass bottles, approximately 40 mL, fitted withPTFE (polytetrafluoroethylene) l<strong>in</strong>ed screw caps.6.2 EXTRACTION VIALS – 60-mL clear glass vials with PTFE l<strong>in</strong>ed screw caps.6.3 AUTOSAMPLER VIALS – 2.0-mL vials with screw or crimp cap and a PTFE facedseal.6.4 STANDARD SOLUTION STORAGE CONTAINERS – 10 to 20-mL amber glassvials with PTFE l<strong>in</strong>ed screw caps.6.5 CLEAR VIALS – 7-mL glass, disposable, with PTFE l<strong>in</strong>ed screw caps for extractdry<strong>in</strong>g and derivatization.6.6 PASTEUR PIPETTES – Glass, disposable.6.7 PIPETTES – Class A, 2.0-mL and 4.0-mL glass, or adjustable volume dispensers.6.8 VOLUMETRIC FLASKS – Class A, suggested sizes <strong>in</strong>clude 5 mL, 10 mL, 100 mL.6.9 MICRO SYRINGES – Various sizes.6.10 BALANCE – Analytical, capable <strong>of</strong> weigh<strong>in</strong>g to the nearest 0.0001 g.6.11 DIAZOMETHANE GENERATOR – See Figure 4 for a diagram <strong>of</strong> an all glasssystem custom made for these validation studies. Micro molar generators are alsoavailable from commercial sources (Aldrich Cat.#: Z10,889-8 or equivalent).6.12 GAS CHROMATOGRAPH – Capillary GC (Hewlett Packard Model 6890 or<strong>515.4</strong>-8
equivalent), if the fast GC option is used the modifications should <strong>in</strong>clude a highpressure (≥ 50 psi) split/splitless <strong>in</strong>jector, fast temperature ramp oven (50 º C/m<strong>in</strong>ute)and a low volume (150 µL ) micro ECD detector. Additionally, a data system capable<strong>of</strong> fast sampl<strong>in</strong>g (20 po<strong>in</strong>ts/peak) is required.6.13 PRIMARY GC COLUMN – RTX-1701, 180 um i.d., fused silica capillary withchemically bonded (14% cyanopropylphenyl-methylpolysiloxane), or equivalentbonded, fused silica column.6.14 CONFIRMATION GC COLUMN – DB-5, 180 um i.d., fused silica capillary withchemically bonded (5% phenyl-methylpolysiloxane), or equivalent bonded, fusedsilica column.7. REAGENTS AND STANDARDS7.1 REAGENTS AND SOLVENTS – Reagent grade or better chemicals should be used<strong>in</strong> all analyses. Unless otherwise <strong>in</strong>dicated, it is <strong>in</strong>tended that all reagents shallconform to the specifications <strong>of</strong> the Committee on Analytical Reagents <strong>of</strong> theAmerican Chemical Society, where such specifications are available. Other gradesmay be used, provided it is first determ<strong>in</strong>ed that the reagent is <strong>of</strong> sufficiently highpurity to permit its use without lessen<strong>in</strong>g the quality <strong>of</strong> the <strong>determ<strong>in</strong>ation</strong>.7.1.1 REAGENT WATER – Purified <strong>water</strong> which does not conta<strong>in</strong> any measurablequantities <strong>of</strong> any target analytes or <strong>in</strong>terfer<strong>in</strong>g compounds greater than 1/3 theMRL for each compound <strong>of</strong> <strong>in</strong>terest.7.1.2 METHYL tert-BUTYL ETHER (MtBE) – High purity, demonstrated to befree from analytes and <strong>in</strong>terferences (HPLC grade or better).7.1.3 ACETONE – High purity, demonstrated to be free from analytes and<strong>in</strong>terferences (HPLC grade or better).7.1.4 CARBITOL (DIETHYLENE GLYCOL MONOETHYL ETHER) – Highpurity, demonstrated to be free from analytes and <strong>in</strong>terferences (HPLC gradeor better).7.1.5 HEXANE:MtBE (90:10, v/v) WASH SOLVENT – High purity, unpreserved,demonstrated to be free from analytes and <strong>in</strong>terferences (HPLC grade orbetter).7.1.6 HEXANE – High purity, demonstrated to be free from analytes and<strong>in</strong>terferences (HPLC grade or better).<strong>515.4</strong>-9
7.1.7 SODIUM SULFATE, Na2SO4 – Pesticide grade, granular, anhydrous.Interferences have been observed when lower quality grades have been used.If <strong>in</strong>terferences are observed, it may be necessary to heat the sodium sulfate <strong>in</strong>a shallow tray at 400 o C for up to 4 hr to remove phthalates and other<strong>in</strong>terfer<strong>in</strong>g organic substances. Alternatively, it can be extracted withmethylene chloride <strong>in</strong> a Soxhlet apparatus for 48 hr. Store <strong>in</strong> a capped glassbottle rather than a plastic conta<strong>in</strong>er.7.1.8 ACIDIFIED SODIUM SULFATE – Acidify by slurry<strong>in</strong>g 100 g <strong>of</strong> muffledsodium sulfate with enough ethyl ether to just cover the solid. Add 0.5-mLconcentrated sulfuric acid dropwise while mix<strong>in</strong>g thoroughly. Remove theether under vacuum. Mix 1 g <strong>of</strong> the result<strong>in</strong>g solid with 5-mL <strong>of</strong> reagent<strong>water</strong> and measure the pH <strong>of</strong> the mixture. The pH must be below pH 4. Store<strong>in</strong> a desiccator or at 100°C to keep the reagent dry.7.1.9 COPPER II SULFATE PENTAHYDRATE, CUS0 4 -5H 2 0 – ACS reagentgrade or better.7.1.10 4 N SODIUM HYDROXIDE SOLUTION – Dissolve 16 g sodium hydroxide(NaOH) pellets (ACS grade or equivalent) <strong>in</strong> reagent <strong>water</strong> and dilute to 100mL.7.1.11 POTASSIUM HYDROXIDE SOLUTION (37%, w/v) – Dissolve 37 g <strong>of</strong>potassium hydroxide (KOH) pellets (ACS grade or equivalent) <strong>in</strong> reagent<strong>water</strong> and dilute to 100 mL.7.1.12 SODIUM SULFITE, Na 2 S0 3 – ACS reagent grade, used as a dechlor<strong>in</strong>at<strong>in</strong>gagent <strong>in</strong> this <strong>method</strong>.7.1.13 DIAZALD SOLUTION – Prepare a solution conta<strong>in</strong><strong>in</strong>g 5 g diazald (ACSreagent grade) <strong>in</strong> 50 mL <strong>of</strong> a 50:50 (v/v) mixture <strong>of</strong> MtBE and carbitol. Thissolution is stable for one month or longer when stored at 4 °C <strong>in</strong> an amberbottle with a PTFE l<strong>in</strong>ed screw cap.7.1.14 SULFURIC ACID – Concentrated, ACS reagent grade.7.1.15 SILICA GEL – ACS reagent grade, 35-60 mesh.7.1.16 HYDROGEN – 99.999% pure or better, GC carrier gas.7.1.17 NITROGEN – 99.999% pure or better, ECD make-up gas.7.2 STANDARD SOLUTIONS – When a compound purity is assayed to be 96% or<strong>515.4</strong>-10
greater, the weight can be used without correction to calculate the concentration <strong>of</strong> thestock standard. Solution concentrations listed <strong>in</strong> this section were used to developthis <strong>method</strong> and are <strong>in</strong>cluded as an example. Standards for sample fortificationgenerally should be prepared <strong>in</strong> the smallest volume that can be accurately measuredto m<strong>in</strong>imize the addition <strong>of</strong> organic solvent to aqueous samples. Laboratoriesshould use standard QC procedures to determ<strong>in</strong>e when Standard Solutionsdescribed <strong>in</strong> this section need to be replaced.7.2.1 INTERNAL STANDARD SOLUTIONS – 4,4'-Dibromooctafluorobiphenyl,99+% is used as an <strong>in</strong>ternal standard for the <strong>method</strong>. This compound has beenshown to be an effective <strong>in</strong>ternal standard for the <strong>method</strong> analytes, but othercompounds may be used if the QC requirements <strong>in</strong> Section 9 are met.7.2.1.1 INTERNAL STANDARD STOCK SOLUTION (2.0 mg/mL) –Prepare an <strong>in</strong>ternal standard a stock solution by accurately weigh<strong>in</strong>gapproximately 0.0200 g <strong>of</strong> neat 4,4'- dibromooctafluorobiphenylmaterial. Dissolve the neat material <strong>in</strong> MtBE and dilute to volume <strong>in</strong> a10-mL volumetric flask. Transfer the solution to an amber glass vialwith a PTFE-l<strong>in</strong>ed screw cap and store at 0 °C. The result<strong>in</strong>gconcentration <strong>of</strong> the stock <strong>in</strong>ternal standard solution will beapproximately 2.0 mg/mL.7.2.1.2 INTERNAL STANDARD PRIMARY DILUTION STANDARD (2.5ug/mL) – Prepare a <strong>in</strong>ternal standard fortification solution atapproximately 2.5 ug/mL by the addition <strong>of</strong> 12.5 uL <strong>of</strong> the stockstandard to 10 mL <strong>of</strong> MtBE. Transfer the primary dilution to an amberglass vial with a PTFE l<strong>in</strong>ed screw cap and store at 0 °C. Thesolution should be replaced when ongo<strong>in</strong>g QC <strong>in</strong>dicates a problem.7.2.1.3 MtBE EXTRACTION SOLVENT WITH INTERNAL STANDARD(2.5 ug/mL) – The <strong>in</strong>ternal standard 4,4'-dibromooctafluorobiphenyl isadded to the extraction solvent prior to analyte extraction tocompensate for any volumetric differences encountered dur<strong>in</strong>g sampleprocess<strong>in</strong>g. This solution should be made fresh prior to extraction.The addition <strong>of</strong> 1 mL <strong>of</strong> the primary dilution standard (2.5 ug/mL) to99-mL MtBE results <strong>in</strong> a f<strong>in</strong>al <strong>in</strong>ternal standard concentration <strong>of</strong> 25ng/mL. This solution is used to extract the samples (Sect. 11.1).7.2.2 SURROGATE (SUR) ANALYTE STANDARD SOLUTION –2,4-Dichlorophenylacetic acid (99+%) is used as a surrogate compound <strong>in</strong> this<strong>method</strong> to evaluate the extraction and derivatization procedures. Thiscompound has been shown to be an effective surrogate for the <strong>method</strong>analytes, but other compounds may be used if the QC requirements <strong>in</strong> Section<strong>515.4</strong>-11
9 are met.7.2.2.1 SURROGATE STOCK SOLUTION (1.0 mg/mL) – Prepare asurrogate stock standard solution <strong>of</strong> 2,4-dichlorophenylacetic acid byweigh<strong>in</strong>g 0.0100 g <strong>of</strong> neat material. Dissolve the neat material <strong>in</strong>acetone and dilute to volume <strong>in</strong> a 10-mL volumetric flask. Transfer thesolution to an amber glass vial with a PTFE l<strong>in</strong>ed screw cap and storeat 0 °C. The result<strong>in</strong>g concentration <strong>of</strong> the stock surrogate solutionwill be 1.0 mg/mL.7.2.2.2 SURROGATE PRIMARY DILUTION STANDARD/SUR SAMPLEFORTIFICATION SOLUTION (100 ug/mL) – Prepare a primarydilution standard at approximately 100 ug/mL by the addition <strong>of</strong> 1 mL<strong>of</strong> the stock standard to 10 mL <strong>of</strong> acetone. Transfer the primarydilution to an amber glass vial with a PTFE l<strong>in</strong>ed screw cap and storeat 0 °C. Addition <strong>of</strong> 10 ul, <strong>of</strong> the primary dilution standard to the40-mL aqueous sample results <strong>in</strong> a surrogate concentration <strong>of</strong> 25ng/mL. The solution should be replaced when ongo<strong>in</strong>g QC <strong>in</strong>dicates aproblem.7.2.3 ANALYTE STANDARD SOLUTIONS – Obta<strong>in</strong> the analytes listed <strong>in</strong> thetable <strong>in</strong> Section 1.1 as neat or solid free acid standards or as commerciallyprepared ampulized solutions from a reputable standard manufacturer. Theuse <strong>of</strong> pre-methylated standards is not allowed for the preparation <strong>of</strong> analytestandards. Prepare the Analyte Stock and Primary Dilutions Standards asdescribed below.7.2.3.1 ANALYTE STOCK STANDARD SOLUTION – Prepare separatestock standard solutions for each analyte <strong>of</strong> <strong>in</strong>terest at a concentration<strong>of</strong> 1-5 mg/mL <strong>in</strong> acetone. Method analytes may be obta<strong>in</strong>ed as neatmaterials or ampulized solutions (> 99% purity) from a number <strong>of</strong>commercial suppliers. These stock standard solutions should be storedat 0 °C.7.2.3.1.1 For analytes which are solids <strong>in</strong> their pure form, preparestock standard solutions by accurately weigh<strong>in</strong>gapproximately 0.01 to 0.05 grams <strong>of</strong> pure material <strong>in</strong> a 10-mL volumetric flask. Dilute to volume with acetone.7.2.3.1.2 For analytes which are liquid <strong>in</strong> their pure form at roomtemperature, place about 9.8 mL <strong>of</strong> acetone <strong>in</strong>to a 10-mLvolumetric flask. Allow the flask to stand, unstoppered, forabout 10 m<strong>in</strong>utes to allow solvent film to evaporate from<strong>515.4</strong>-12
the <strong>in</strong>ner walls <strong>of</strong> the volumetric, and weigh to the nearest0.1 mg. Use a 10-uL syr<strong>in</strong>ge and immediately add 10.0 uL<strong>of</strong> standard material to the flask by keep<strong>in</strong>g the syr<strong>in</strong>geneedle just above the surface <strong>of</strong> the acetone. Be sure thatthe standard material falls dropwise directly <strong>in</strong>to theacetone without contact<strong>in</strong>g the <strong>in</strong>ner wall <strong>of</strong> the volumetric.Calculate the concentration <strong>in</strong> milligrams per milliliter fromthe net ga<strong>in</strong> <strong>in</strong> weight. Dilute to volume, stopper, then mixby <strong>in</strong>vert<strong>in</strong>g the flask several times.7.2.3.2 PRIMARY DILUTION STANDARD (PDS) – Prepare the primarydilution standard solution by comb<strong>in</strong><strong>in</strong>g and dilut<strong>in</strong>g stock standardsolutions with acetone. This primary dilution standard solution shouldbe stored at 0 °C. As a guidel<strong>in</strong>e to the analyst, the analyteconcentrations used <strong>in</strong> the primary dilution standard solution dur<strong>in</strong>g<strong>method</strong> development are given below.AnalyteConcentration(ug/mL)Acifluorfen 5.0Bentazon 10Chloramben 5.02,4-D 10Dalapon 102,4-DB 10Dacthal acid metabolites 5.0Dicamba 5.03,5-Dichlorobenzoic acid 5.0Dichlorprop 10D<strong>in</strong>oseb 10Pentachlorophenol 1.0Picloram 5.02,4,5-T 2.52,4,5-TP (Silvex) 2.5Qu<strong>in</strong>clorac 5.0<strong>515.4</strong>-13
This primary dilution standard is used to fortify reagent <strong>water</strong> forcalibration standards. The lowest calibration standard concentrationmust be at or below the MRL <strong>of</strong> each analyte. The concentrations <strong>of</strong>the other standards should def<strong>in</strong>e a range conta<strong>in</strong><strong>in</strong>g the expectedsample concentrations or the work<strong>in</strong>g range <strong>of</strong> the detector.7.2.4 CALIBRATION STANDARDS (CAL) – A five-po<strong>in</strong>t calibration curve is tobe prepared by fortify<strong>in</strong>g reagent <strong>water</strong> with the primary dilution standard. Adesignated amount <strong>of</strong> each calibration standard <strong>in</strong> acetone is spiked <strong>in</strong>toseparate 40-mL aliquots <strong>of</strong> reagent <strong>water</strong> to produce a calibration curverang<strong>in</strong>g from below or at the MRL to approximately 10-20 times the lowestcalibration level. These aqueous calibration standards should be treated likesamples and therefore require the addition <strong>of</strong> all preservation and otherreagents. They are extracted by the procedure described <strong>in</strong> Section 11. Thecalibration standard solutions <strong>in</strong> acetone should be stored at 0 °C.8. SAMPLE COLLECTION, PRESERVATION, AND STORAGE8.1 SAMPLE BOTTLE PREPARATION8.1.1 Grab samples must be collected <strong>in</strong> accordance with conventional sampl<strong>in</strong>gpractices (7) us<strong>in</strong>g amber glass conta<strong>in</strong>ers with PTFE l<strong>in</strong>ed screw caps andcapacities <strong>of</strong> at least 40 mL.8.1.2 Add sodium sulfite crystals (approximately 2 mg/40 mL <strong>of</strong> sample) to thesample bottle prior to collect<strong>in</strong>g the sample. This reagent elim<strong>in</strong>ates residualchlor<strong>in</strong>e <strong>in</strong> the sample.8.2. SAMPLE COLLECTION8.2.1 Fill sample bottles but take care not to flush out the sodium sulfite. Becausethe target analytes <strong>of</strong> this <strong>method</strong> are not volatile, it is not necessary to ensurethat the sample bottles are completely headspace free.8.2.2 When sampl<strong>in</strong>g from a <strong>water</strong> tap, remove the aerator so that no air bubbleswill be trapped <strong>in</strong> the sample. Open the tap and allow the system to flush untilthe <strong>water</strong> temperature has stabilized (usually about 3-5 m<strong>in</strong>utes). Collectsamples from the flow<strong>in</strong>g system.8.2.3 When sampl<strong>in</strong>g from an open body <strong>of</strong> <strong>water</strong>, fill a 1 quart wide-mouth bottleor 1 liter beaker with sample from a representative area, and carefully fillsample vials from the conta<strong>in</strong>er.<strong>515.4</strong>-14
8.2.4 After collect<strong>in</strong>g the sample, seal the bottle and agitate by hand for 15 seconds.8.3 SAMPLE SHIPMENT AND STORAGE – All samples should be iced dur<strong>in</strong>gshipment and must not exceed 10 o C dur<strong>in</strong>g the first 48 hours after collection.Samples should be confirmed to be at or below 10 o C when they are received at thelaboratory. Samples stored <strong>in</strong> the lab must be held at or below 6 o C and protectedfrom light until extraction. Samples should not be frozen.8.4 SAMPLE AND EXTRACT HOLDING TIMES – Because <strong>of</strong> the several pHadjustments made to the samples <strong>in</strong> the course <strong>of</strong> this <strong>method</strong>, the addition <strong>of</strong> organicor <strong>in</strong>organic biocides, <strong>in</strong>clud<strong>in</strong>g hydrochloric acid, have been omitted. The analystshould be aware <strong>of</strong> the potential for the biological degradation <strong>of</strong> the analytes.Accord<strong>in</strong>gly, samples should be extracted as soon as possible. Samples must beextracted with<strong>in</strong> 14 days. Extracts must be stored at 0 o C or less and protected fromlight <strong>in</strong> glass vials with PTFE l<strong>in</strong>ed caps. Hold<strong>in</strong>g time studies <strong>in</strong>dicate that theanalytes are stable for up to 21 days <strong>in</strong> the extracts.9. QUALITY CONTROL9.1 Quality control (QC) requirements <strong>in</strong>clude the Initial Demonstration <strong>of</strong> Capability(Sect. 17, Table 13), the <strong>determ<strong>in</strong>ation</strong> <strong>of</strong> the Detection Limit, and subsequentanalysis <strong>in</strong> each analysis batch <strong>of</strong> a Laboratory Reagent Blank (LRB), Cont<strong>in</strong>u<strong>in</strong>gCalibration Check Standards (CCC), a Laboratory Fortified Sample Matrix (LFM),and either a Laboratory Fortified Sample Matrix Duplicate (LFMD) or a FieldDuplicate Sample. This section details the specific requirements for each QCparameter. The QC criteria discussed <strong>in</strong> the follow<strong>in</strong>g sections are summarized <strong>in</strong>Section 17, Tables 13 and 14. These criteria are considered the m<strong>in</strong>imum acceptableQC criteria, and laboratories are encouraged to <strong>in</strong>stitute additional QC practices tomeet their specific needs.9.1.1 Process all quality control samples through all steps <strong>of</strong> Section 11, <strong>in</strong>clud<strong>in</strong>ghydrolysis and methylation. Sample preservatives as described <strong>in</strong> Section 8.1must be added prior to extract<strong>in</strong>g and analyz<strong>in</strong>g the quality control samples.9.2 INITIAL DEMONSTRATION OF CAPABILITY (IDC) – Requirements for theInitial Demonstration <strong>of</strong> Capability are described <strong>in</strong> the follow<strong>in</strong>g sections andsummarized <strong>in</strong> Section 17, Table 13.9.2.1 INITIAL DEMONSTRATION OF LOW SYSTEM BACKGROUND –Before any samples are analyzed, it must be demonstrated that a laboratoryreagent blank (LRB) is reasonably free <strong>of</strong> contam<strong>in</strong>ation and that the criteria<strong>in</strong> Section 9.4 are met. Process all quality control samples through all all steps<strong>of</strong> the <strong>method</strong> (Sect. 9.1.1).<strong>515.4</strong>-15
9.2.2 INITIAL DEMONSTRATION OF PRECISION – Prepare, extract, andanalyze 4-7 replicate LFBs fortified at 5 ug/L, or near the mid-range <strong>of</strong> the<strong>in</strong>itial calibration curve. Process all quality control samples through all allsteps <strong>of</strong> the <strong>method</strong> (Sect. 9.1.1). The relative standard deviation (RSD) <strong>of</strong> theresults <strong>of</strong> the replicate analyses must be less than 20%.9.2.3 INITIAL DEMONSTRATION OF ACCURACY – Us<strong>in</strong>g the same set <strong>of</strong>replicate data generated for Section 9.2.2, calculate average recovery. Theaverage recovery <strong>of</strong> the replicate values must be with<strong>in</strong> ± 20% <strong>of</strong> the truevalue.9.2.4 DETECTION LIMIT – Prepare, extract and analyze at least seven replicateLFBs at a concentration estimated to be near the Detection Limit, over aperiod <strong>of</strong> at least three days (both extraction and analysis should be conductedover at least three days) us<strong>in</strong>g the procedure described <strong>in</strong> Section 11. Processall quality control samples through all all steps <strong>of</strong> the <strong>method</strong> (Sect. 9.1.1).The fortification level may be estimated by select<strong>in</strong>g a concentration with asignal <strong>of</strong> 2 to 5 times the noise level but must be at or below the laboratory’sMRL (Sect. 9.3). The appropriate concentration will be dependent upon thesensitivity <strong>of</strong> the GC/ECD system be<strong>in</strong>g used. Sample preservatives asdescribed <strong>in</strong> Section 8.1 must be added to these samples. Calculate theDetection Limit us<strong>in</strong>g the equationDetection Limit = St (n - 1, 1 - alpha = 0.99)wheret (n - 1, 1 - alpha = 0.99) = Students t value for the 99% confidence level with n-1 degrees <strong>of</strong> freedom,n = number <strong>of</strong> replicates, andS = standard deviation <strong>of</strong> replicate analyses.NOTE: Calculated Detection Limits need only be less than 1/3 <strong>of</strong> thelaboratory’s MRL to be considered acceptable. Do not subtract blank valueswhen perform<strong>in</strong>g Detection Limit calculations. The Detection Limit is astatistical <strong>determ<strong>in</strong>ation</strong> <strong>of</strong> precision only. (1) If the Detection Limit replicatesare fortified at a low enough concentration, it is likely that they will not meetprecision and accuracy criteria, and may result <strong>in</strong> a calculated Detection Limitthat is higher than the fortified concentration9.2.5 METHOD MODIFICATIONS – The analyst is permitted to modify GCcolumns, GC conditions, <strong>in</strong>ternal standards or surrogate standards, but eachtime such <strong>method</strong> modifications are made, the analyst must repeat theprocedures <strong>of</strong> the IDC (Sect. 9.2).<strong>515.4</strong>-16
9.3 M<strong>in</strong>imum Report<strong>in</strong>g Level (MRL) – The MRL is the threshold concentration <strong>of</strong> ananalyte that a laboratory can expect to accurately quantitate <strong>in</strong> an unknown sample.The MRL should not be established at an analyte concentration that is less than eitherthree times the Detection Limit or a concentration which would yield a response lessthan a signal-to-noise (S/N) ratio <strong>of</strong> five. Depend<strong>in</strong>g upon the study’s data qualityobjectives it may be set at a higher concentration. Although the lowest calibrationstandard must be at or below the MRL, the MRL must never be established at aconcentration lower than the lowest calibration standard.9.4 LABORATORY REAGENT BLANK (LRB) – An LRB is required with eachextraction batch (Sect. 3.1) <strong>of</strong> samples to determ<strong>in</strong>e the background systemcontam<strong>in</strong>ation. If the LRB produces a peak with<strong>in</strong> the retention time w<strong>in</strong>dow <strong>of</strong> anyanalyte that would prevent the <strong>determ<strong>in</strong>ation</strong> <strong>of</strong> that analyte, determ<strong>in</strong>e the source <strong>of</strong>contam<strong>in</strong>ation and elim<strong>in</strong>ate the <strong>in</strong>terference before process<strong>in</strong>g samples. Backgroundcontam<strong>in</strong>ation must be reduced to an acceptable level before proceed<strong>in</strong>g. Backgroundfrom <strong>method</strong> analytes or contam<strong>in</strong>ants that <strong>in</strong>terfere with the measurement <strong>of</strong> <strong>method</strong>analytes must be below 1/3 <strong>of</strong> the MRL. If the target analytes are detected <strong>in</strong> the LRBat concentrations equal to or greater than this level, then all data for the problemanalyte(s) must be considered <strong>in</strong>valid for all samples <strong>in</strong> the extraction batch.9.5 CONTINUING CALIBRATION CHECK (CCC) – A standard prepared <strong>in</strong> the sameextraction batch as the samples <strong>of</strong> <strong>in</strong>terest that conta<strong>in</strong>s all compounds <strong>of</strong> <strong>in</strong>terest andis extracted <strong>in</strong> the same manner as the procedural standards used to prepare the <strong>in</strong>itialcalibration curve. Calibration checks, prepared with the samples be<strong>in</strong>g analyzed, arerequired at the beg<strong>in</strong>n<strong>in</strong>g <strong>of</strong> each day that samples are analyzed, after every tensamples, and at the end <strong>of</strong> any group <strong>of</strong> sample analyses. See Section 10.3 forconcentration requirements, frequency requirements, and acceptance criteria.9.6 LABORATORY FORTIFIED BLANK (LFB) – S<strong>in</strong>ce this <strong>method</strong> utilizes proceduralcalibration standards, which are fortified reagent <strong>water</strong>s, there is no differencebetween the LFB and the cont<strong>in</strong>u<strong>in</strong>g calibration check standard. Consequently, theanalysis <strong>of</strong> an LFB is not required ; however the acronym LFB is used for clarity <strong>in</strong>the IDC.9.7 INTERNAL STANDARDS (IS) – The analyst must monitor the peak area <strong>of</strong> each<strong>in</strong>ternal standard <strong>in</strong> all <strong>in</strong>jections dur<strong>in</strong>g each analysis day. The IS response (as<strong>in</strong>dicated by peak area) for any chromatographic run must not deviate by more than ±50% from the average area measured dur<strong>in</strong>g the <strong>in</strong>itial calibration for that IS. A poor<strong>in</strong>jection could cause the IS area to exceed these criteria. Inject a second aliquot <strong>of</strong>the suspect extract to determ<strong>in</strong>e whether the failure is due to poor <strong>in</strong>jection or<strong>in</strong>strument response drift.<strong>515.4</strong>-17
9.7.1 If the re<strong>in</strong>jected aliquot produces an acceptable <strong>in</strong>ternal standard response,report results for that aliquot.9.7.2 If the <strong>in</strong>ternal standard area for the re<strong>in</strong>jected extract deviates greater than50% from the <strong>in</strong>itial calibration average, the analyst should check thecont<strong>in</strong>u<strong>in</strong>g calibration check standards that ran before and after the sample. Ifthe cont<strong>in</strong>u<strong>in</strong>g calibration check fails the criteria <strong>of</strong> Section 10.3, recalibrationis <strong>in</strong> order per Section 10. If the calibration standard is acceptable, extraction<strong>of</strong> the sample should be repeated provided the sample is still with<strong>in</strong> hold<strong>in</strong>gtime. Otherwise, report results obta<strong>in</strong>ed from the re<strong>in</strong>jected extract, butannotate as suspect.9.8 SURROGATE RECOVERY – The surrogate standard is fortified <strong>in</strong>to the aqueousportion <strong>of</strong> all samples, LRBs, and LFMs and LFMDs prior to extraction. It is alsoadded to the calibration curve and calibration check standards. The surrogate is ameans <strong>of</strong> assess<strong>in</strong>g <strong>method</strong> performance from extraction to f<strong>in</strong>al chromatographicmeasurement.9.8.1 When surrogate recovery from a sample, blank, or CCC is less than 70% orgreater than 130%, check (1) calculations to locate possible errors, (2)standard solutions for degradation, (3) contam<strong>in</strong>ation, and (4) <strong>in</strong>strumentperformance. If those steps do not reveal the cause <strong>of</strong> the problem, reanalyzethe extract.9.8.2 If the extract reanalysis meets the surrogate recovery criterion, report only datafor the reanalyzed extract.9.8.3 If the extract reanalysis fails the 70-130% recovery criterion, the analystshould check the calibration by <strong>in</strong>ject<strong>in</strong>g the last calibration standard thatpassed. If the calibration standard fails the criteria <strong>of</strong> Section 9.8.1,recalibration is <strong>in</strong> order per Section 10.2. If the calibration standard isacceptable, extraction <strong>of</strong> the sample should be repeated provided the sample isstill with<strong>in</strong> the hold<strong>in</strong>g time. If the sample re-extract also fails the recoverycriterion, report all data for that sample as suspect/surrogate recovery to<strong>in</strong>form the data user that the results are suspect due to surrogate recovery.9.9 LABORATORY FORTIFIED SAMPLE MATRIX AND DUPLICATE (LFM ANDLFMD) – Analyses <strong>of</strong> LFMs (Sect. 3.7) are required <strong>in</strong> each extraction batch and areused to determ<strong>in</strong>e that the sample matrix does not adversely affect <strong>method</strong> accuracy.If the occurrence <strong>of</strong> target analytes <strong>in</strong> the samples is <strong>in</strong>frequent, or if historical trendsare unavailable, a second LFM or LMFD must be prepared, extracted, and analyzedfrom a duplicate field sample used to prepare the LFM to assess <strong>method</strong> precision.Extraction batches that conta<strong>in</strong> LFMDs will not require the analysis <strong>of</strong> a Field<strong>515.4</strong>-18
Duplicate (Sect. 9.10). If a variety <strong>of</strong> different sample matrices are analyzedregularly, for example, dr<strong>in</strong>k<strong>in</strong>g <strong>water</strong> from ground<strong>water</strong> and surface <strong>water</strong> sources,<strong>method</strong> performance should be established for each. Over time, LFM data should bedocumented for all rout<strong>in</strong>e sample sources for the laboratory.9.9.1 With<strong>in</strong> each extraction batch, a m<strong>in</strong>imum <strong>of</strong> one field sample is fortified as anLFM for every 20 samples extracted. The LFM is prepared by spik<strong>in</strong>g asample with an appropriate amount <strong>of</strong> Analyte PDS (Sect. 7.2.3.2). Select aspik<strong>in</strong>g concentration that is at least twice the matrix backgroundconcentration, if known. Use historical data and rotate through the designatedconcentrations when select<strong>in</strong>g a fortify<strong>in</strong>g concentration.9.9.2 Calculate the percent recovery (R) for each analyte us<strong>in</strong>g the equationwhereA = measured concentration <strong>in</strong> the fortified sample,B = measured concentration <strong>in</strong> the unfortified sample, andC = fortification concentration.9.9.3 Analyte recoveries may exhibit matrix bias. For samples fortified at or abovetheir native concentration, recoveries should range between 70 and 130%,except for low-level fortification near or at the MRL where 50 to 150%recoveries are acceptable. If the accuracy <strong>of</strong> any analyte falls outside thedesignated range, and the laboratory performance for that analyte is shown tobe <strong>in</strong> control <strong>in</strong> the LFB, the recovery is judged to be matrix biased. Theresult for that analyte <strong>in</strong> the unfortified sample is labeled suspect/matrix to<strong>in</strong>form the data user that the results are suspect due to matrix effects.9.9.4 If an LFMD is analyzed <strong>in</strong>stead <strong>of</strong> a Field Duplicate (Sect. 9.10), calculate therelative percent difference (RPD) for duplicate LFMs (LFM and LFMD) us<strong>in</strong>gthe equationRPDs for duplicate LFMs should fall <strong>in</strong> the range <strong>of</strong> ± 30% for samplesfortified at or above their native concentration. Greater variability may beobserved when LFMs are spiked near the MRL. At the MRL, RPDs shouldfall <strong>in</strong> the range <strong>of</strong> ± 50% for samples fortified at or above their native<strong>515.4</strong>-19
concentration. If the accuracy <strong>of</strong> any analyte falls outside the designatedrange, and the laboratory performance for that analyte is shown to be <strong>in</strong>control <strong>in</strong> the LFB, the recovery is judged to be matrix biased. The result forthat analyte <strong>in</strong> the unfortified sample is labeled suspect/matrix to <strong>in</strong>form thedata user that the results are suspect due to matrix effects.9.10 FIELD DUPLICATES (FD1 AND FD2) – With<strong>in</strong> each extraction batch, a m<strong>in</strong>imum<strong>of</strong> one Field Duplicate (FD) or LFMD (Sect. 9.9) must be analyzed. FDs check theprecision associated with sample collection, preservation, storage, and laboratoryprocedures. If target analytes are not rout<strong>in</strong>ely observed <strong>in</strong> field samples, a LFMD(Sect. 9.10) should be analyzed to substitute for this requirement. Extraction batchesthat conta<strong>in</strong> LFMDs will not require the analysis <strong>of</strong> a Field Duplicate.9.10.1 Calculate the relative percent difference (RPD) for duplicate measurements(FD1 and FD2) us<strong>in</strong>g the equation9.10.2 RPDs for duplicates should be <strong>in</strong> the range <strong>of</strong> ± 30%. Greater variability maybe observed when analyte concentrations are near the MRL. At the MRL,RPDs should fall <strong>in</strong> the range <strong>of</strong> ± 50%. If the accuracy <strong>of</strong> any analyte fallsoutside the designated range, and the laboratory performance for that analyteis shown to be <strong>in</strong> control <strong>in</strong> the LFB, the recovery is judged to be matrixbiased. The result for that analyte <strong>in</strong> the unfortified sample is labeledsuspect/matrix to <strong>in</strong>form the data user that the results are suspect due to matrixeffects.9.11 QUALITY CONTROL SAMPLES (QCS) – A QCS sample should be analyzed eachtime that new Primary Dilution Standards (Sect. 7.2.3.2) are prepared. The source <strong>of</strong>the QCS sample should ideally be a second vendor. If a second vendor is notavailable then a different lot <strong>of</strong> the standard should be used. Although the use <strong>of</strong> premethylatedstandards is prohibited for prepar<strong>in</strong>g analyte standard solutions, premethylatedstandards may be used to prepare the QCS. The QCS may be <strong>in</strong>jected asa calibration standard or fortified <strong>in</strong>to reagent <strong>water</strong> and analyzed as a LFB. If theQCS is analyzed as a cont<strong>in</strong>u<strong>in</strong>g calibration, then the acceptance criteria are the sameas for the CCC. If the QCS is analyzed as a LFB, then the acceptance criteria are thesame as for an LFB. If measured analyte concentrations are not <strong>of</strong> acceptableaccuracy, check the entire analytical procedure to locate and correct the problemsource.<strong>515.4</strong>-20
10. CALIBRATION AND STANDARDIZATION10.1 After <strong>in</strong>itial calibration is successful, a Cont<strong>in</strong>u<strong>in</strong>g Calibration Check (CCC) isrequired at the beg<strong>in</strong>n<strong>in</strong>g and end <strong>of</strong> each analysis batch, and after every tenth sample(Sect. 10.3). Because this is a procedural standard <strong>method</strong>, the analyst will need tomake a decision to <strong>in</strong>clude an appropriate number <strong>of</strong> CCCs or an entire <strong>in</strong>itialcalibration curve with each extraction batch. Initial calibration should be repeatedeach time a major <strong>in</strong>strument modification or ma<strong>in</strong>tenance is performed.10.2 INITIAL CALIBRATION10.2.1 Establish GC operat<strong>in</strong>g parameters equivalent to the suggested specifications<strong>in</strong> Section 17, Table 1. The GC system must be calibrated us<strong>in</strong>g the <strong>in</strong>ternalstandard (IS) technique. Other columns or conditions may be used ifequivalent or better performance can be demonstrated.10.2.2 Prepare a set <strong>of</strong> at least 5 calibration standards as described <strong>in</strong> Section 7.2.4.The lowest concentration <strong>of</strong> calibration standard must be at or below theMRL, which will depend on system sensitivity.10.2.3 CALIBRATION – Use the GC data system s<strong>of</strong>tware to generate a l<strong>in</strong>earregression or quadratic calibration curve us<strong>in</strong>g the <strong>in</strong>ternal standard. Theanalyst may choose whether or not to force zero to obta<strong>in</strong> a curve that best fitsthe data. Examples <strong>of</strong> common GC system calibration curve options are:1) A x /A is vs Q x /Q is and 2) RRF vs A x /A is .where:A x =A is =Q x =Q is =<strong>in</strong>tegrated peak area <strong>of</strong> the analyte,<strong>in</strong>tegrated peak area <strong>of</strong> the <strong>in</strong>ternal standard,quantity <strong>of</strong> analyte <strong>in</strong>jected <strong>in</strong> ng or concentration units,andquantity <strong>of</strong> <strong>in</strong>ternal standard <strong>in</strong>jected <strong>in</strong> ng or concentrationunits.10.2.4 As an alternative, concentrations may be calculated through the use <strong>of</strong> averagerelative response factor (RRF). Calculate the RRFs us<strong>in</strong>g the equationAverage RRF calibrations may only be used if the RRF values over the<strong>515.4</strong>-21
calibration range are relatively constant (
11. PROCEDURE11.1 SAMPLE EXTRACTION AND HYDROLYSIS11.1.1 Remove the samples from storage (Sect. 8.3) and allow them to equilibrate toroom temperature.11.1.2 Place 40 mL <strong>of</strong> the <strong>water</strong> sample <strong>in</strong>to a precleaned 60-mL, glass vial with aPTFE l<strong>in</strong>ed screw cap us<strong>in</strong>g a graduated cyl<strong>in</strong>der.11.1.3 Add 10 uL <strong>of</strong> surrogate standard (100 ug/mL, 2,4-dichlorophenylacetic acid <strong>in</strong>acetone per Section 7.2.2) to the aqueous sample.11.1.4 Add 1 mL, <strong>of</strong> the 4 N NaOH solution prepared <strong>in</strong> Section 7.1.10 to each glassvial. Check the pH <strong>of</strong> the sample with pH paper or a pH meter. If the sampledoes not have a pH greater than or equal to 12, adjust the pH by add<strong>in</strong>g more4 N NaOH solution. Let the sample sit at room temperature for 1 hour,shak<strong>in</strong>g the contents periodically.NOTE: S<strong>in</strong>ce many <strong>of</strong> the herbicides conta<strong>in</strong>ed <strong>in</strong> this <strong>method</strong> are applied as avariety <strong>of</strong> esters and salts, it is vital to hydrolyze them to the parent acid priorto extraction. This step must be <strong>in</strong>cluded <strong>in</strong> the analysis <strong>of</strong> all extracted fieldsamples, LRBs, LFMs and calibration standards. Failure to perform this stepmay result <strong>in</strong> data that are biased low for some targets <strong>in</strong> field samples. (8)11.1.5 Follow<strong>in</strong>g hydrolysis, add 5 mL <strong>of</strong> (90:10, v:v) hexane:MtBE (Section 7.1.5)and shake vigorously for three m<strong>in</strong>utes. Allow the phases to separate forapproximately 5 m<strong>in</strong>utes then remove and discard the top hexane/MtBE layer.This wash aids <strong>in</strong> sample cleanup and removes any Dacthal from the samplewhich would <strong>in</strong>terfere with the quantitation <strong>of</strong> the Dacthal metabolites.11.1.6 Adjust the pH to approximately 1 by add<strong>in</strong>g concentrated sulfuric acid. Cap,shake and then check the pH with a pH meter or narrow range pH paper. Addadditional sulfuric acid as needed to properly adjust the pH.11.1.7 Quickly add approximately 2 g <strong>of</strong> copper II sulfate pentahydrate and shakeuntil dissolved. This colors the aqueous phase blue and allows the analyst tobetter dist<strong>in</strong>guish between the aqueous phase and the organic phase <strong>in</strong> thismicro extraction.11.1.8 Quickly add approximately 16 g <strong>of</strong> muffled sodium sulfate (Sect. 7.1.7) andshake until almost all is dissolved. Sodium sulfate is added to <strong>in</strong>crease theionic strength <strong>of</strong> the aqueous phase and thus further drive the chlorophenoxy<strong>515.4</strong>-23
<strong>acids</strong> <strong>in</strong>to the organic phase. The addition <strong>of</strong> salt also decreases the solubility<strong>of</strong> MtBE <strong>in</strong> the aqueous phase and allows greater volumetric recovery. Theaddition <strong>of</strong> this salt and the copper II sulfate pentahydrate should be donequickly so that the heat generated from the addition <strong>of</strong> the acid (Section11.1.6) will help dissolve the salts.11.1.9 Add exactly 4.0-mL MtBE and shake vigorously for three m<strong>in</strong>utes.11.1.10 Allow the phases to separate for approximately 5 m<strong>in</strong>utes.11.2 SAMPLE METHYLATION WITH DIAZOMETHANE11.2.1 GENERATION OF DIAZOMETHANE11.2.1.1 Assemble the diazomethane generator (Figure 4) <strong>in</strong> a hood. Thecollection vessel is a 10- or 15-mL, glass vial equipped with aPTFE l<strong>in</strong>ed screw cap that is ma<strong>in</strong>ta<strong>in</strong>ed at 0 - 5 °C.11.2.1.2 Add a sufficient amount <strong>of</strong> MtBE (approximately 7 mL) to tube 1to cover the first imp<strong>in</strong>ger. Add 10 mL <strong>of</strong> MtBE to the collectionvial. Set the nitrogen flow at 5-10 mL/m<strong>in</strong>. Add 4-mL Diazaldsolution (Sect. 7.1.13) and 3 mL <strong>of</strong> 37% KOH solution (Sect.7.1.11) to the second imp<strong>in</strong>ger. Connect the tub<strong>in</strong>g as shown andallow the nitrogen flow to purge the diazomethane from thereaction vessel <strong>in</strong>to the collection vial for 30 m<strong>in</strong>utes. Cap the vialwhen collection is complete and ma<strong>in</strong>ta<strong>in</strong> at 0-5 °C. When storedat 0-5 °C, this diazomethane solution may be used over a period <strong>of</strong>72 hours.11.2.1.3 Several commercial sources <strong>of</strong> glassware are available fordiazomethane generation. These <strong>in</strong>clude a m<strong>in</strong>i Diazald apparatusfrom Aldrich (Cat. #:Z10,889-8).11.2.2 Us<strong>in</strong>g a Pasteur pipette, transfer the sample extract (upper MtBE layer) to a 7-mL, screw cap vial. Add 0.6 g acidified sodium sulfate (Sect. 7.1.8) andshake. This step is <strong>in</strong>cluded to dry the MtBE extract.11.2.3 Us<strong>in</strong>g a Pasteur pipette, transfer the extract to a second, 7-mL glass vial.11.2.4 Add 250 uL <strong>of</strong> the diazomethane solution prepared <strong>in</strong> Section 11.2.1 to eachvial. The contents <strong>of</strong> the vial should rema<strong>in</strong> slightly yellow <strong>in</strong> color <strong>in</strong>dicat<strong>in</strong>gan excess <strong>of</strong> diazomethane. Additional diazomethane may be added ifnecessary. Let the esterification reaction proceed for 30 m<strong>in</strong>utes.<strong>515.4</strong>-24
11.2.5 Remove any unreacted diazomethane by add<strong>in</strong>g 0.1 g <strong>of</strong> silica gel.Effervescence (evolution <strong>of</strong> nitrogen) is an <strong>in</strong>dication that excessdiazomethane was present. Allow the extracts to sit for 0.5 hour.11.2.6 Transfer the extract to an autosampler vial. A duplicate vial may be filledus<strong>in</strong>g the excess extract.11.2.7 Analyze the sample extracts as soon as possible. The sample extract may bestored up to 21 days if kept at 0 °C or less. Keep the extracts away from light<strong>in</strong> amber glass vials with PTFE l<strong>in</strong>ed caps.11.3 GAS CHROMATOGRAPHY11.3.1 If the fast GC option is used, several important changes from “conventionalGC” should be made to aid <strong>in</strong> the rapid analysis <strong>of</strong> the analytes. The<strong>in</strong>strument should have a fast temperature ramp (50 °C/m<strong>in</strong>ute) oven and ahigh pressure (≥ 50 psi) split/splitless <strong>in</strong>jector. When us<strong>in</strong>g columns withdiameters less than 180 um the <strong>in</strong>strument should be equipped with a lowvolume (150 µL ) micro ECD. Additionally, the column diameter and filmthickness should be decreased and the carrier gas should be changed tohydrogen.11.3.2 Use <strong>of</strong> Hydrogen Safely – Although hydrogen can be used safely as a carriergas, the potential for fire or explosion does exist if the gas system ismishandled. If you are unsure <strong>of</strong> the safety guidel<strong>in</strong>es for us<strong>in</strong>g hydrogen as acarrier gas, seek advice from your <strong>in</strong>strument manufacturer regard<strong>in</strong>g its use.11.3.3 Column Selection and Installation – Dur<strong>in</strong>g <strong>method</strong> development the RTX-1701 columns provided basel<strong>in</strong>e resolution for the 2,4-DB /Chloramben pair(peaks 11 and 12 <strong>in</strong> Figure 1). Columns from other manufacturers were not aseffective <strong>in</strong> separat<strong>in</strong>g these analytes. Strict attention must be paid toestablished column <strong>in</strong>stallation guidel<strong>in</strong>es with regard to the proper cutt<strong>in</strong>gand placement <strong>of</strong> the capillary columns with<strong>in</strong> the <strong>in</strong>strument. Additionally, aloss <strong>of</strong> response over time was noted for Acifluorifen and D<strong>in</strong>oseb. Trimm<strong>in</strong>gapproximately 1 meter from the head <strong>of</strong> the column restored the response forthese analytes. If conditions <strong>in</strong> the laboratory necessitate frequent columntrimm<strong>in</strong>g, a guard column is recommended.11.4 ANALYSIS OF EXTRACTS11.4.1 Establish operat<strong>in</strong>g conditions as described <strong>in</strong> Section 17, Table 1 (Table 2 ifperform<strong>in</strong>g confirmation). Confirm that retention times, compound separationand resolution are similar to those summarized <strong>in</strong> Table 1 and Figure1.<strong>515.4</strong>-25
11.4.2 Establish an appropriate retention time w<strong>in</strong>dow for each target and surrogateto identify them <strong>in</strong> the QC and field samples. This should be based onmeasurements <strong>of</strong> actual retention time variation for each compound <strong>in</strong>standard solutions analyzed on the GC over the course <strong>of</strong> time. Plus or m<strong>in</strong>usthree times the standard deviation <strong>of</strong> the retention time for each compoundwhile establish<strong>in</strong>g the <strong>in</strong>itial calibration and complet<strong>in</strong>g the IDC can be usedto calculate a suggested w<strong>in</strong>dow size; however, the experience <strong>of</strong> the analystshould weigh heavily on the <strong>determ<strong>in</strong>ation</strong> <strong>of</strong> the appropriate retentionw<strong>in</strong>dow size.11.4.3 Check system calibration by analyz<strong>in</strong>g a CCC (Sect. 10.3) and calibrate thesystem by either the analysis <strong>of</strong> a calibration curve (Sect. 10. 2) or byconfirm<strong>in</strong>g the <strong>in</strong>itial calibration is still valid by analyz<strong>in</strong>g a cont<strong>in</strong>u<strong>in</strong>gcalibration check as described <strong>in</strong> Section 10.3. Beg<strong>in</strong> analyz<strong>in</strong>g field and QCsamples at their appropriate frequency by <strong>in</strong>ject<strong>in</strong>g the same size aliquotsunder the same conditions used to analyze the <strong>in</strong>itial calibration.11.4.4 An analyst must not extrapolate beyond the established calibration range. Ifan analyte result exceeds the range <strong>of</strong> the <strong>in</strong>itial calibration curve, the extractmay be diluted with MtBE conta<strong>in</strong><strong>in</strong>g the <strong>in</strong>ternal standard (Sect. 7.2.1.3), andthe diluted extract <strong>in</strong>jected. Acceptable surrogate performance (Sect. 9.8)should be determ<strong>in</strong>ed from the undiluted sample extract. Incorporate thedilution factor <strong>in</strong>to f<strong>in</strong>al concentration calculations. The dilution will alsoaffect analyte MRLs.12. DATA ANALYSIS AND CALCULATION12.1 Identify the <strong>method</strong> analytes <strong>in</strong> the sample chromatogram by compar<strong>in</strong>g the retentiontime <strong>of</strong> the suspect peak to retention time <strong>of</strong> an analyte peak <strong>in</strong> a calibration standard.Surrogate retention times should be confirmed to be with<strong>in</strong> acceptance limits (Sect.11.4.2) even if no target compounds are detected.12.2 Calculate the analyte concentrations us<strong>in</strong>g the <strong>in</strong>itial calibration curve generated asdescribed <strong>in</strong> Section 10.2. Quantitate only those values that fall between the MRLand the highest calibration standard. Samples with target analyte responses thatexceed the highest standard require dilution and reanalysis (Sect. 11.4.4).12.3 Analyte identifications should be confirmed us<strong>in</strong>g the confirmation column specified<strong>in</strong> Table 2 or another column that is dissimilar to the primary column or by GC/MS ifthe concentrations are sufficient.12.4 Adjust the calculated concentrations <strong>of</strong> the detected analytes to reflect the <strong>in</strong>itial<strong>515.4</strong>-26
sample volume and any dilutions performed.12.5 Analyte concentrations are reported <strong>in</strong> ug/L as the total free acid. Calculations shoulduse all available digits <strong>of</strong> precision.13. METHOD PERFORMANCE13.1 PRECISION, ACCURACY, AND Detection Limits – Tables for these data arepresented <strong>in</strong> Section 17. S<strong>in</strong>gle laboratory precision and accuracy data are presented<strong>in</strong> Tables 5 -10. Detection Limits are presented <strong>in</strong> Table 4 and were calculated us<strong>in</strong>gthe formula presented <strong>in</strong> Section 9.2.4.14. POLLUTION PREVENTION14.1 This <strong>method</strong> utilizes liquid:liquid microextraction to extract analytes from <strong>water</strong>. Itrequires the use <strong>of</strong> very small volumes <strong>of</strong> organic solvent and very small quantities <strong>of</strong>pure analytes, thereby m<strong>in</strong>imiz<strong>in</strong>g the potential hazards to both the analyst and theenvironment as compared to the use <strong>of</strong> large volumes <strong>of</strong> organic solvents <strong>in</strong>conventional liquid-liquid extractions.14.2 For <strong>in</strong>formation about pollution prevention that may be applicable to laboratoryoperations, consult “Less is Better: Laboratory Chemical Management for WasteReduction” available from the American Chemical Society’s Department <strong>of</strong>Government Relations and Science Policy, 1155 16th Street N.W., Wash<strong>in</strong>gton, D.C.,20036.15. WASTE MANAGEMENT15.1 The analytical procedures described <strong>in</strong> this <strong>method</strong> generate relatively small amounts<strong>of</strong> waste s<strong>in</strong>ce only small amounts <strong>of</strong> reagents and solvents are used. The matrices <strong>of</strong>concern are f<strong>in</strong>ished dr<strong>in</strong>k<strong>in</strong>g <strong>water</strong> or source <strong>water</strong>. However, the Agency requiresthat laboratory waste management practices be conducted consistent with allapplicable rules and regulations, and that laboratories protect the air, <strong>water</strong>, and landby m<strong>in</strong>imiz<strong>in</strong>g and controll<strong>in</strong>g all releases from fume hoods and bench operations.Also, compliance is required with any sewage discharge permits and regulations,particularly the hazardous waste identification rules and land disposal restrictions.For further <strong>in</strong>formation on waste management, consult “The Waste ManagementManual for Laboratory Personnel” also available from the American ChemicalSociety at the address <strong>in</strong> Section 14.2.<strong>515.4</strong>-27
16. REFERENCES1. Glaser, J.A., Foerst, D.L., McKee, G.D., Quave, S.A., and Budde, W.L., “TraceAnalyses for Waste<strong>water</strong>s,” Environ. Sci. Technol., 15 (1981) 1426-1435.2. Giam, C.S., Chan, H.S., and Nef, G.S., "Sensitive Method for Determ<strong>in</strong>ation <strong>of</strong>Phthalate Ester Plasticizers <strong>in</strong> Open-Ocean Biota Samples," Analytical Chemistry,47,2225 (1975).3. Giam, C.S., and Chan, H.S., "Control <strong>of</strong> Blanks <strong>in</strong> the Analysis <strong>of</strong> Phthalates <strong>in</strong> Airand Ocean Biota Samples," U.S. National Bureau <strong>of</strong> Standards, Special Publication442, 701-708, (1976).4. "OSHA Safety and Health Standards, General Industry," (29CRF1910). OccupationalSafety and Health Adm<strong>in</strong>istration, OSHA 2206, (Revised, Jan.1976).5. “Carc<strong>in</strong>ogens-Work<strong>in</strong>g with Carc<strong>in</strong>ogens,” Publication No. 77-206, Department <strong>of</strong>Health, Education, and Welfare, Public Health Service, Center for Disease Control,National Institute <strong>of</strong> Occupational Safety and Health, Atlanta, Georgia, August 1977.6. “Safety In Academic Chemistry Laboratories,” 3rd Edition, American ChemicalSociety Publication, Committee on Chemical Safety, Wash<strong>in</strong>gton, D.C., (1979).7. ASTM Annual Book <strong>of</strong> Standards, Part II, Volume 11.01, D3370-82, "StandardPractice for Sampl<strong>in</strong>g Water," American Society for Test<strong>in</strong>g and Materials,Philadelphia, PA, 1986.8. Bassett, M.V.; Pepich, B.V. and Munch, D.M., “The Role Playedby Basic Hydrolysis<strong>in</strong> the Validity <strong>of</strong> Acid herbicide Data - Recommendations for Future Preparation <strong>of</strong>Herbicide Performance Evaluation Standards.” Environ. Sci. Technol., Vol.34, 1117,(2000).<strong>515.4</strong>-28
17. TABLES, DIAGRAMS, FLOWCHARTS, AND VALIDATION DATATABLE 1: CHROMATOGRAPHIC CONDITIONS AND AVERAGE RETENTION TIMEDATA FOR THE PRIMARY COLUMN (RTX-1701, 40m x 180 um i.d.)Peak Number(Figure 1)CompoundAverage T r(m<strong>in</strong>) a% RSD1 Dalapon 7.06 0.0172 3,5 Dichlorobenzoic acid 11.32 0.0023 2,4-Dichlorophenylacetic acid (SUR) 11.80 0.0024 Dicamba 11.91 0.0025 Dichlorprop 12.21 0.0026 4,4'-Dibromooctafluorobiphenyl (IS) 12.25 0.0027 2,4-D 12.37 0.0028 Pentachlorophenol 12.49 0.0029 Silvex 12.70 0.00210 2,4,5-T 12.90 0.00211 2,4-DB 13.10 0.00312 Chloramben 13.15 0.00313 D<strong>in</strong>oseb 13.44 0.00314 Bentazon 13.60 0.00315 Dacthal 13.68 0.00216 Qu<strong>in</strong>clorac 13.85 0.00417 Picloram 14.02 0.00318 Acifluorfen 15.20 0.004a The average retention time represents the average <strong>of</strong> 7 runs.Primary Column:DB-1701, 40 m x 0.180 mm i.d., 0.20 µm film thickness, <strong>in</strong>jector temp. 200 º C, l<strong>in</strong>er 2 mm straight siltek ®deactivated, <strong>in</strong>jection volume 1 µL <strong>of</strong> 200 ng/m L (highest level com ponent) standard, splitless <strong>in</strong>jection hold to1 m<strong>in</strong> then purge @ 50 mL/m<strong>in</strong>, detector temp 360 º C, detector make up gas nitrogen at 20 mL/m<strong>in</strong>ute.Temperature program: 45 º C <strong>in</strong>itial, program at 5 º C/m<strong>in</strong>ute to 80 º C, Then 50 º C/m<strong>in</strong>ute to 220 º C, Then 20º C/m<strong>in</strong>ute to 280 º C and Hold for 3 m<strong>in</strong>, Data collection via HP GC Chemstation at a rate <strong>of</strong> 20Hz.Carrier gas: Hydrogen (UHP)Detector makeup gas: Nitrogen (UHP)<strong>515.4</strong>-29
TABLE 2: CHROMATOGRAPHIC CONDITIONS AND AVERAGE RETENTION TIMEDATA FOR THE CONFIRMATION COLUMN (DB-5, 40 m x 180 um i.d.)Peak Number(Figure 1)CompoundAverage T r(m<strong>in</strong>) a% RSD1 Dalapon 5.04 0.0572 3,5-Dichlorobenzoic acid 10.33 0.0073 2,4-Dichlorophenylacetic acid (SUR) 11.31 0.0044 Dicamba 11.46 0.0065 Dichlorprop 12.19 0.0066 4,4'-Dibromooctafluorobiphenyl (IS) 12.71 0.0047 2,4-D 12.34 0.0058 Pentachlorophenol 13.16 0.0069 Silvex 13.29 0.00410 2,4,5-T 13.48 0.00511 2,4-DB 13.94 0.00512 Chloramben 13.34 0.00413 D<strong>in</strong>oseb 14.01 0.00414 Bentazon 14.28 0.00615 Dacthal 15.00 0.00416 Qu<strong>in</strong>clorac 14.88 0.00417 Picloram 14.59 0.00418 Acifluorfen 16.38 0.003a The average retention time represents the average <strong>of</strong> 7 runs.Confirmation Column:DB-5, 40 m x 0.180 mm i.d., 0.20 µm film thickness, <strong>in</strong>jector temp. 200 º C, l<strong>in</strong>er 2 mm straight siltek ®deactivated, <strong>in</strong>jection volume 1 µL <strong>of</strong> 100 ng/m L (highest level com ponent) standard, splitless <strong>in</strong>jection hold to1 m<strong>in</strong> then purge @ 50 mL/m<strong>in</strong>, detector temp 360 º C, detector make up gas nitrogen at 20 mL/m<strong>in</strong>ute.Temperature program: 45 º C <strong>in</strong>itial, program at 4 º C/m<strong>in</strong>ute to 80 º C then program at 30 º C/m<strong>in</strong>ute to 280 andHold for 2 m<strong>in</strong>, Data collection via HP GC Chemstation at a rate <strong>of</strong> 20Hz.Carrier gas: Hydrogen (UHP)Detector makeup gas: Nitrogen (UHP)<strong>515.4</strong>-30
TABLE 3: CHROMATOGRAPHIC CONDITIONS AND AVERAGE RETENTION TIMEDATA FOR A CONVENTIONAL PRIMARY COLUMN (DB-5, 30 m x 250 um i.d.)Peak Number(Figure 3)CompoundT r(m<strong>in</strong>)1 Dalapon 14.282 3,5-Dichlorobenzoic acid 20.353 2,4-Dichlorophenylacetic acid (SUR) 20.984 Dicamba 21.105 Dichlorprop 21.466 4,4'-Dibromooctafluorobiphenyl (IS) 21.537 2,4-D 21.648 Pentachlorophenol 21.819 Silvex 22.0310 2,4,5-T 22.2711 2,4-DB 22.5112 Chloramben 22.5513 D<strong>in</strong>oseb 22.9414 Bentazon 23.1715 Dacthal 23.3016 Qu<strong>in</strong>clorac 23.5517 Picloram 23.8218 Acifluorfen 25.90Conventional Primary Column:DB-1701, 30 m x 0.250 mm i.d., 0.25 µm film thickness, <strong>in</strong>jector temp. 200 º C, l<strong>in</strong>er 2 mm straight deactivated,<strong>in</strong>jection volume 1 µL <strong>of</strong> 100 ng/mL (highest level component) standard, splitless <strong>in</strong>jection hold to .5 m<strong>in</strong> thenpurge @ 30 mL/m<strong>in</strong>, detector temp 290 º C, detector make up gas P-5 at 60 mL/m<strong>in</strong>ute. Temperature program:45 º C <strong>in</strong>itial, hold 10 m<strong>in</strong> then program at 5 º C/m<strong>in</strong>ute to 70 º C, Then 30 º C/m<strong>in</strong>ute to 260 º C, and Hold for 5m<strong>in</strong>, Data collection via T urbochro m 4.1Carrier gas: Helium (UHP)Detector makeup gas: 5% methane/argon (UHP)<strong>515.4</strong>-31
TABLE 4: DETECTION LIMITS IN REAGENT WATERCompoundFortificationLevel (ug/L)PrimaryColumnDetectionLimit a (ug/L)SecondaryColumnDetectionLimit a (ug/L)Dalapon 0.100 0.054 0.0743,5-Dichlorobenzoic acid 0.050 0.212 0.049Dicamba 0.050 0.032 0.042Dichlorprop 0.100 0.433 0.122,4-D 0.100 0.055 0.066Pentachlorophenol 0.010 0.014 0.084Silvex 0.025 0.033 0.0182,4,5-T 0.025 0.024 0.0332,4-DB 0.100 0.246 0.182Chloramben 0.050 0.057 0.083D<strong>in</strong>oseb 0.100 0.166 0.081Bentazon 0.100 0.064 0.185Dacthal 0.050 0.113 0.105Qu<strong>in</strong>clorac 0.050 0.080 0.113Picloram 0.050 0.076 0.055Acifluorfen 0.250 0.307 0.092aDetection Limits were extracted and analyzed over 3 days for 9 replicates follow<strong>in</strong>gthe procedure outl<strong>in</strong>ed <strong>in</strong> Section 9.<strong>515.4</strong>-32
TABLE 5: LOW LEVEL PRECISION AND ACCURACY IN REAGENT WATERCompoundFortificationLevel (ug/L)Mean %Recovery% RSD(n=7)S/NRatio aDalapon 1.0 108 2.2 5783,5-Dichlorobenzoic acid 0.50 117 16 9Dicamba 0.50 97 3.7 35Dichlorprop 1.0 95 5.7 192,4-D 1.0 98 5.2 23Pentachlorophenol 0.10 76 7.4 21Silvex 0.25 84 20 92,4,5-T 0.25 96 7.3 162,4-DB 1.0 97 8.4 6Chloramben 0.50 90 9.0 113D<strong>in</strong>oseb 1.0 103 6.7 8Bentazon 1.0 100 2.1 41Dacthal 0.50 92 6.5 100Qu<strong>in</strong>clorac 0.10 106 9.3 20Picloram 1.0 92 2.6 23Acifluorfen 0.50 77 5.9 802,4-Dichlorophenylacetic acid (SUR) 25 104 8.0 -aSignal-to-noise ratios were calculated for each target compound peak by divid<strong>in</strong>g thepeak height for each compound by the peak-to-peak noise, which was determ<strong>in</strong>ed foreach component from the <strong>method</strong> blank over a period <strong>of</strong> time equal to the full peakwidth <strong>in</strong> the target analyte’s retention time w<strong>in</strong>dow.<strong>515.4</strong>-33
TABLE 6: MID LEVEL PRECISION AND ACCURACY IN REAGENT WATERCompoundFortificationLevel (ug/L)Mean %Recovery% RSD(n=7)Dalapon 10 107 2.33,5-Dichlorobenzoic acid 5.0 96 2.3Dicamba 5.0 102 1.5Dichlorprop 10 107 0.62,4-D 10 106 1.4Pentachlorophenol 1.0 103 1.4Silvex 2.5 107 4.42,4,5-T 2.5 105 1.32,4-DB 10 93 1.6Chloramben 5.0 105 2.9D<strong>in</strong>oseb 10 119 4.6Bentazon 10 98 0.7Dacthal 5.0 100 1.9Qu<strong>in</strong>clorac 1.0 101 2.9Picloram 10 99 3.1Acifluorfen 5.0 107 4.52,4-Dichlorophenylacetic acid (SUR) 25 112 1.3<strong>515.4</strong>-34
TABLE 7: LOW LEVEL PRECISION AND ACCURACY IN FORTIFIED CHLORINATEDSURFACE WATERCompoundFortificationLevel (ug/L)Mean %Recovery% RSD(n=7)Dalapon 1.0 104 2.13,5-Dichlorobenzoic acid 0.50 110 3.0Dicamba 0.50 93 4.4Dichlorprop 1.0 93 112,4-D 1.0 97 5.2Pentachlorophenol 0.10 86 3.2Silvex 0.25 103 4.32,4,5-T 0.25 100 3.52,4-DB 1.0 104 5.9Chloramben 0.50 93 2.0D<strong>in</strong>oseb 1.0 99 1.2Bentazon 1.0 91 2.2Dacthal 0.50 92 4.6Qu<strong>in</strong>clorac 0.10 96 15Picloram 1.0 102 2.4Acifluorfen 0.50 98 4.12,4-Dichlorophenylacetic acid (SUR) 25 107 1.5<strong>515.4</strong>-35
TABLE 8: MID LEVEL PRECISION AND ACCURACY IN FORTIFIED CHLORINATEDSURFACE WATERCompoundFortificationLevel (ug/L)Mean %Recovery% RSD(n=7)Dalapon 10 100 2.53,5-Dichlorobenzoic acid 5.0 104 2.6Dicamba 5.0 102 2.9Dichlorprop 10 101 1.22,4-D 10 101 1.2Pentachlorophenol 1.0 100 1.0Silvex 2.5 101 1.02,4,5-T 2.5 100 1.62,4-DB 10 101 2.3Chloramben 5.0 102 2.6D<strong>in</strong>oseb 10 101 1.6Bentazon 10 98 1.8Dacthal 5.0 99 2.0Qu<strong>in</strong>clorac 1.0 105 2.5Picloram 10 107 3.2Acifluorfen 5.0 92 2.42,4-Dichlorophenylacetic acid (SUR) 25 106 1.4<strong>515.4</strong>-36
TABLE 9: LOW LEVEL PRECISION AND ACCURACY IN FORTIFIED CHLORINATEDGROUND WATERCompoundFortificationLevel (ug/L)Mean %Recovery% RSD(n=7)Dalapon 1.0 105 1.53,5-Dichlorobenzoic acid 0.50 104 6.0Dicamba 0.50 100 2.2Dichlorprop 1.0 109 3.52,4-D 1.0 108 10Pentachlorophenol 0.10 103 17Silvex 0.25 96 3.02,4,5-T 0.25 91 3.42,4-DB 1.0 94 3.1Chloramben 0.50 88 2.7D<strong>in</strong>oseb 1.0 100 4.0Bentazon 1.0 101 2.8Dacthal 0.50 62 a 9.9Qu<strong>in</strong>clorac 0.10 107 5.7Picloram 1.0 97 2.8Acifluorfen 0.50 92 4.22,4-Dichlorophenylacetic acid (SUR) 25 95 3.1aDacthal was present <strong>in</strong> the <strong>chlor<strong>in</strong>ated</strong> surface <strong>water</strong> at about 1/5th the fortificationlevel. This was taken <strong>in</strong>to account <strong>in</strong> the <strong>determ<strong>in</strong>ation</strong> <strong>of</strong> the Mean % Recovery.<strong>515.4</strong>-37
TABLE 10: MID LEVEL PRECISION AND ACCURACY IN FORTIFIED CHLORINATEDGROUND WATERCompoundFortificationLevel (ug/L)Mean %Recovery% RSD(n=7)Dalapon 10 97 5.53,5-Dichlorobenzoic acid 5.0 95 2.1Dicamba 5.0 98 1.6Dichlorprop 10 79 0.72,4-D 10 99 1.6Pentachlorophenol 1.0 100 4.2Silvex 2.5 97 1.62,4,5-T 2.5 97 1.52,4-DB 10 92 1.1Chloramben 5.0 102 2.6D<strong>in</strong>oseb 10 105 2.6Bentazon 10 101 1.8Dacthal 5.0 99 1.2Qu<strong>in</strong>clorac 1.0 94 1.5Picloram 10 103 2.5Acifluorfen 5.0 84 2.52,4-Dichlorophenylacetic acid (SUR) 25 106 1.1<strong>515.4</strong>-38
TABLE 11.SAMPLE HOLDING TIME DATA FOR SAMPLES FROM ACHLORINATED SURFACE WATER FORTIFIED WITH METHODANALYTES aCompoundDay 0% RecDay 2% RecDay 7% RecDay 14% RecDalapon 91 90 91 1083,5-Dichlorobenzoic acid 98 97 85 91Dicamba 92 92 96 99Dichlorprop 89 88 91 952,4-D 88 85 87 92Pentachlorophenol 92 85 86 93Silvex 91 88 86 942,4,5-T 89 89 85 912,4-DB 87 84 86 93Chloramben 86 86 88 100D<strong>in</strong>oseb 105 95 99 111Bentazon 91 87 95 99Dacthal 92 91 86 94Qu<strong>in</strong>clorac 90 80 84 91Picloram 94 85 85 99Acifluorfen 109 96 103 123aAll samples fortified at the same level used to collect the mid level precision andaccuracy data (see Table 10 for example).<strong>515.4</strong>-39
TABLE 12.EXTRACT HOLDING TIME DATA FOR SAMPLES FROM ACHLORINATED SURFACE WATER FORTIFIED WITH METHODANALYTES a,b CompoundInitial a, bInjection%RecDay 21Re<strong>in</strong>jection%RecDalapon 100 893,5-Dichlorobenzoic acid 104 113Dicamba 102 104Dichlorprop 100 1012,4-D 101 102Pentachlorophenol 100 102Silvex 101 1032,4,5-T 99 1022,4-DB 101 102Chloramben 102 105D<strong>in</strong>oseb 99 81Bentazon 98 100Dacthal 99 103Qu<strong>in</strong>clorac 105 127Picloram 107 98Acifluorfen 92 1042,4-Dichlorophenylacetic acid(SUR)106 105aSample storage stability is expressed as a percent recovery (%Rec) value calculated asdescribed <strong>in</strong> Section 9.9.2.bAll samples fortified at the same level used to collect the mid level precision andaccuracy data (see Table 10 for example).<strong>515.4</strong>-40
TABLE 13: INITIAL DEMONSTRATION OF CAPABILITY (IDC) REQUIREMENTSMethodReferenceRequirementSpecification andFrequencyAcceptance CriteriaSection9.2.1InitialDemonstration <strong>of</strong>Low MethodBackgroundAnalyze LRB prior to anyother IDC stepsDemonstrate that all targetanalytes are below 1 / 3 thereport<strong>in</strong>g limit or lowest CALstandard, and that possible<strong>in</strong>terference from extractionmedia do not prevent theidentification andquantification <strong>of</strong> <strong>method</strong>analytes.Section9.2.2InitialDemonstration <strong>of</strong>Precision (IDP)Analyze 4-7 replicate LFBsfortified at midrangeconcentration.%RSD must be 20%Section9.2.3InitialDemonstration <strong>of</strong>AccuracyCalculate average recoveryfor replicates used <strong>in</strong> IDPMean recovery must be with<strong>in</strong>± 20% <strong>of</strong> true value.Section9.2.4Detection LimitDeterm<strong>in</strong>ationOver a period <strong>of</strong> three days,prepare a m<strong>in</strong>imum <strong>of</strong> 7replicate LFBs fortified at aconcentration estimated tobe near the Detection Limit.Analyze the replicatesthrough all steps <strong>of</strong> theanalysis. Calculate theDetection Limit us<strong>in</strong>g theequation <strong>in</strong> Section 9.2.4.Must be 1/3 <strong>of</strong> theestablished MRL.Note: Data from DetectionLimit replicates are notrequired to meet <strong>method</strong>precision and accuracy criteria.If the Detection Limitreplicates are fortified at a lowenough concentration, it islikely that they will not meetprecision and accuracy criteria.<strong>515.4</strong>-41
TABLE 14: QUALITY CONTROL REQUIREMENTS (SUMMARY)MethodReferenceRequirementSpecification andFrequencyAcceptance CriteriaSection10.2Initial CalibrationUse <strong>in</strong>ternal standardcalibration technique togenerate a calibration curve.Use at least 5 standardconcentrations.When each calibration standardis calculated as an unknownus<strong>in</strong>g the calibration curve, theresult must be 70-130% <strong>of</strong> thetrue value for all except thelowest standard, which must be50-150% <strong>of</strong> the true value.Section9.4LaboratoryReagent Blank(LRB)Daily, or with eachextraction batch <strong>of</strong> up to 20samples, whichever is morefrequent.Demonstrate that all targetanalytes are below 1 / 3 the<strong>method</strong> report<strong>in</strong>g limit orlowest CAL standard, and thatpossible <strong>in</strong>terferences do notprevent quantification <strong>of</strong><strong>method</strong> analytes.If targets exceed 1 / 3 the MRL,results for all subject analytes <strong>in</strong>extraction batch are <strong>in</strong>valid.Sections9.5 and10.3Cont<strong>in</strong>u<strong>in</strong>gCalibration Check(CCC)Verify <strong>in</strong>itial calibration byanalyz<strong>in</strong>g a calibrationstandard at the beg<strong>in</strong>n<strong>in</strong>g <strong>of</strong>each analysis batch prior toanalyz<strong>in</strong>g samples, afterevery 10 samples, and afterthe last sample.Low CCC - near MRLMid CCC - near midpo<strong>in</strong>t <strong>in</strong><strong>in</strong>itial calibration curveHigh CCC - near highestcalibration standard1) The result for each analytemust be 70-130% <strong>of</strong> the truevalue for all but the loweststandard. The lowest standardmust be 50-150% <strong>of</strong> the truevalue.2) The peak area <strong>of</strong> <strong>in</strong>ternalstandards must be 50-150% <strong>of</strong>the average peak area calculateddur<strong>in</strong>g the <strong>in</strong>itial calibration.Results for analytes that do notmeet IS criteria or are notbracketed by acceptable CCCsare <strong>in</strong>valid.<strong>515.4</strong>-42
TABLE 14: QUALITY CONTROL REQUIREMENTS (SUMMARY)MethodReferenceRequirementSpecification andFrequencyAcceptance CriteriaSection 9.7InternalStandard(IS)4,4'-dibromooctafluorobiphenylis added to theextraction solvent.Peak area counts for the IS <strong>in</strong> LFBs,LRBs, and sample extracts must bewith<strong>in</strong> 50-150% <strong>of</strong> the average peakarea calculated dur<strong>in</strong>g the <strong>in</strong>itialcalibration. If the IS does not meetcriteria, correspond<strong>in</strong>g target resultsare <strong>in</strong>valid.Section 9.8SurrogateStandard(SUR)2,4-dichlorophenylaceticacid is added to allcalibration standards andsamples, <strong>in</strong>clud<strong>in</strong>g QCsamples.Surrogate recovery must be 70-130%<strong>of</strong> the true value. If surrogate failsthis criterion, report all results forsample as suspect/surrogate recovery.Section 9.9LaboratoryFortifiedSampleMatrix (LFM)andLaboratoryFortifiedMatrixDuplicate(LFMD)Analyze one LFM peranalysis batch (20samples or less) fortifiedwith <strong>method</strong> analytes at aconcentration close to butgreater than the nativeconcentration.LFMD should be used <strong>in</strong>place <strong>of</strong> Field Duplicate iffrequency <strong>of</strong> detects fortargets is low.Recoveries at mid and high levels notwith<strong>in</strong> 70-130% or low-levelrecoveries not with<strong>in</strong> 50-150% <strong>of</strong> thefortified amount may <strong>in</strong>dicate a matrixeffect.Target analyte RPDs for LFMDshould be with<strong>in</strong> ±30% at mid andhigh levels <strong>of</strong> fortification and with<strong>in</strong>±50% near MRL.Section9.10FieldDuplicates(FD)Extract and analyze atleast one FD with eachextraction batch (20samples or less). ALFMD may be substitutedfor a FD when thefrequency <strong>of</strong> detects fortarget analytes is low.Target analyte RPDs for FD should bewith<strong>in</strong> ±30% at mid and high levels <strong>of</strong>fortification and with<strong>in</strong> ±50% nearMRL.Section9.11QualityControlSample(QCS)Analyzed when newPrimary DilutionStandards (PDS) areprepared.Results must be 70-130% <strong>of</strong> theexpected value.<strong>515.4</strong>-43
MethodReferenceRequirementSpecification andFrequencyAcceptance CriteriaSection 8.4SampleHold<strong>in</strong>g Time14 days with appropriatepreservation and storageSample results are valid only ifsamples are extracted with<strong>in</strong> samplehold time.Section 8.4ExtractHold<strong>in</strong>g Time21 days with appropriatestorageSample results are valid only ifextracts are analyzed with<strong>in</strong> extracthold time.<strong>515.4</strong>-44
FIGURE 1CHROMATOGRAM OF THE CHLORPHENOXY HERBICIDES ON A RTX-1701 COLUMNCHROMATOGRAPHIC CONDITIONS ARE GIVEN IN TABLE 1.<strong>515.4</strong>-45
FIGURE 2CHROMATOGRAM OF THE CHLORPHENOXY HERBICIDES ON A DB-5 COLUMNCHROMATOGRAPHIC CONDITIONS ARE GIVEN IN TABLE 2.<strong>515.4</strong>-46
FIGURE 3CHROMATOGRAM OF THE CHLORPHENOXY HERBICIDES ON A CONVENTIONAL PRIMARY COLUMN(30 m x 250 um) CHROMATOGRAPHIC CONDITIONS ARE GIVEN IN TABLE 3.<strong>515.4</strong>-47
FIGURE 4DIAZOMETHANE GENERATOR<strong>515.4</strong>-48


