METHOD 8272: PARENT AND ALKYL POLYCYCLIC ... - Xenco
METHOD 8272: PARENT AND ALKYL POLYCYCLIC ... - Xenco
METHOD 8272: PARENT AND ALKYL POLYCYCLIC ... - Xenco
You also want an ePaper? Increase the reach of your titles
YUMPU automatically turns print PDFs into web optimized ePapers that Google loves.
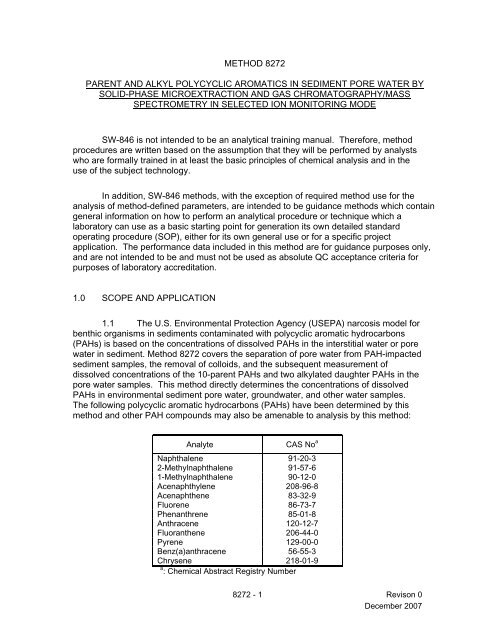
NOTE: Method <strong>8272</strong> is specifically for the determination of dissolved PAHs ininterstitial water or pore water in sediment samples only. If the heavymolecular weight PAHs that may be present in the particulates are ofconcern, additional determinative extraction and analysis methods arerequired to measure suspended and sediment-based (i.e., total) PAHs.Regulatory methods using solvent extraction have not achieved the widecalibration ranges from nanograms to milligrams per liter and the necessary levels ofdetection in the nanogram per liter range. In addition, conventional solvent extractionmethods require large aliquot volumes (liter or larger), the use of large volumes oforganic solvents, and filtration to generate the pore water. Solvent extraction entails thestorage and processing of large volumes of sediment samples and may result in the lossof low molecular weight PAHs in the filtration and solvent evaporation steps.This method can be used to determine nanogram to milligram per liter PAHconcentrations in pore water. Small volumes of pore water are needed for solid phasemicroextraction (SPME), only 1.5 mL per determination, and virtually no solventextraction waste is generated.1.2 Lower molecular weight PAHs are more water soluble than highermolecular weight PAHs. Therefore, PAH concentrations in pore water samples varywidely due to differing saturation water solubilities that range from 0.2 µg/L forindeno[1,2,3-cd]pyrene to 31,000 µg/L for naphthalene. This method can accommodatethe measurement of milligram per liter concentrations for low molecular weight PAHsand nanogram per liter concentrations for high molecular weight PAHs, such asbenz(a)anthracene and chrysene and any other four-five ring PAHs that can bedetermined by this method.1.3 This method can achieve the necessary lower limits of quantitation,which range from approximately 0.06 µg/L for high molecular weight PAHs, toapproximately 9 µg/L for low molecular weight PAHs.1.4 Prior to employing this method, analysts are advised to consult the basemethod for each type of procedure that may be employed in the overall analysis (e.g.,Methods 3500, 3600 and 8000). For additional information on quality controlprocedures, development of QC acceptance criteria, calculations, and general guidance,analysts also should consult the disclaimer statement at the front of the manual and theinformation in Chapter Two for guidance on the intended flexibility in the choice ofmethods, apparatus, materials, reagents, and supplies, and on the responsibilities of theanalyst for demonstrating that the techniques employed are appropriate for the analytesof interest, in the matrix of interest, and at the levels of concern.In addition, analysts and data users are advised that, except where explicitlyspecified in a regulation, the use of SW-846 methods is not mandatory in response toFederal testing requirements. The information contained in this method is provided byEPA as guidance to be used by the analyst and the regulated community in makingjudgments necessary to generate results that meet the data quality objectives for theintended application.1.5 This method is restricted to use by or under the supervision of analystsexperienced in the use of gas chromatography/mass spectrometers and skilled in the<strong>8272</strong> - 2 Revison 0December 2007
interpretation of mass spectra. Each analyst must demonstrate the ability to generateacceptable results with this method.2.0 SUMMARY OF <strong>METHOD</strong>2.1 Pore water is separated from wet sediment samples by centrifugationand supernatant collection. The groundwater and tap water samples begin preparationwith the colloid removal step. Colloids are removed from the separated pore water,groundwater, and tap water samples by flocculation with aluminum potassium sulfate(alum) and sodium hydroxide. A second flocculation and centrifugation step, followed bysupernatant collection, completes the colloid removal.2.2 The PAHs are determined using SPME followed by gaschromatography/mass spectrometry (GC/MS) analysis in selected ion monitoring (SIM)mode. Either the use of an autosampler, or a manual approach can be used to performthe SPME extraction and the subsequent injection of collected analytes into the GC/MS.Isotopically labeled analogs of the target compounds are introduced prior to theextraction, and are used as quantitation references.2.3 The mass spectrometer is operated in the SIM mode for the molecularions of the target PAHs and d-PAHs to achieve low limits of detection. Analyteconcentrations are quantitated by either of two methods: (1) parent PAHs (i.e.,unsubstituted PAHs) for which an exact deuterated analog is not included in the internalstandard mix are quantitated by reference to a deuterated analog of a PAH with thesame number of rings as the analyte, or (2) PAHs for which an exact deuterated analogis included in the internal standard mix are quantitated by isotope dilution.2.4 Test Method Options: Either the use of an autosampler or a manualapproach may be used to perform the SPME extraction and the subsequent injection ofcollected analytes into the GC/MS. An autosampler is much preferred over the manualmethod because: (1) the autosampler yields lower and more reproducible blanks, (2) themanual method requires the use of a stir bar that can cause sample crosscontamination,(3) the manual method is highly labor-intensive and requires multipletimed manipulations per analysis leading to operator fatigue and resultant errors, and (4)the autosampler reduces the technician time required to prepare samples for a 24-hourrun sequence to approximately 3 hours, while the manual method requires 24 houroperator attendance. Therefore, the method procedures are written assuming the use ofan autosampler, with modifications to the autosampler procedures listed for the manualmethod.2.4.1 Autosampler Method2.4.1.1 Pore Water Separation and Preparation: Porewater is separated from wet sediment samples by centrifugation andsupernatant collection. The groundwater and tap water samples beginpreparation with the colloid removal step. Colloids are removed fromthe separated pore water, groundwater, and tap water samples byflocculation with aluminum potassium sulfate (alum) and sodiumhydroxide. A second flocculation and centrifugation, followed by<strong>8272</strong> - 3 Revison 0December 2007
supernatant collection completes the colloid removal. The preparedwater samples are then split into the number of replicate aliquotsneeded and placed into silanized glass autosampler vials. The 8perdeuterated PAH internal standards (d-PAHs) are then addedimmediately. All of the water preparation steps beginning with thecentrifugation and ending with the addition of d-PAH internal standardsshould be conducted continuously and in the minimum amount of timepossible.The SPME fiber should be cleaned at the beginning of eachsampling set (and after very contaminated samples) while the watersamples are being prepared.2.4.1.2 Solid-Phase Microextraction: The SPME extractionof the water samples is performed using a commercially availablepolydimethylsiloxane (PDMS)-coated fused silica fiber while the watersample is mixed by the precession of the autosampler mixing chamber.The target PAHs and d-PAH internal standards adsorb to the nonpolarPDMS phase at equivalent rates. The use of the d-PAHs (i.e., isotopicdilution) to quantitate the target PAHs compensates for variations inequilibrium partitioning and kinetics.2.4.1.3 GC/MS SIM Analysis: Following the sorptionperiod, the SPME fiber is immediately desorbed to a GC/MS injectionport in the splitless mode. Following the desorption period, the SPMEfiber is inserted into the cleaning port and additionally cleaned. At theend of the cleaning period, sorption of the next water sample is begun.2.4.2 Manual MethodAlternate Procedures for Manual Method: Samples are prepared as forthe autosampler method, except that a small Teflon-coated stir bar is placed in thesilanized autosampler vial prior to adding the water and d-PAH internal standardsolution. A new stir bar should be used for each sample, calibration standard, andblank to avoid cross-contamination caused by carryover on the stir bar. To performthe SPME step, the vial is set on a stir plate and the stirring rate adjusted so thatno large vortex is formed. The SPME fiber should be inserted into the water so thatthe entire active length is exposed to the water sample, but not so low that the fibercomes into contact with the stir bar or that the metal needle sheath contacts thewater. All time sequences should be the same as described for the autosamplermethod. A spare GC split/splitless injection port under helium flow can be used forthe cleaning step between samples as well as for the initial cleaning step at thebeginning of each working day.2.5 This method includes specific calibration, sample analysis, and qualitycontrol steps that supersede the general requirements provided in Method 8000.<strong>8272</strong> - 4 Revison 0December 2007
3.0 DEFINITIONSRefer to the SW-846 Chapter One, Chapter Four and appendix of terms anddefinitions for potentially applicable definitions.3.1 Data Acquisition Parameters – Parameters affecting the scanningoperation and conversion of the analytical signal to digitized data files. These include theconfiguration of the ADC circuitry, the ion dwell time, the MID cycle time, and acquisitionmodes set up for the method. Examples of acquisition modes for the HP5973 includeSIM mode and Low Mass Resolution Mode.3.2 Lower Limit of Quantitation – The lower limit of quantitation (LLOQ) foreach individual PAH is defined as the concentration of an individual PAH that would yield1/34 of a toxic unit (see Sec. 3.4). Due to the differences in saturation solubilities for thePAH compounds recommended in this method the LLOQ will also vary for eachcompound. Ideally, the exact LLOQ should be at or below those recommended in Table3 for optimum method performance. However, the actual LLOQs should be a projectplanning decision based on the desired project-specific data quality objectives. Forexample lower limits of quantitation of each individual PAH refer to Table 3. See Ref. 2in Sec. 16.0 for additional details.3.3 Solid Phase Microextraction (SPME): Solid phase microextraction hasbeen used for the determination of PAHs in water samples. SPME utilizes acommercially available 7 micron thick polydimethylsiloxane (PDMS)-coated fused silicafiber. The target PAHs and d-PAH internal standards adsorb to the nonpolar PDMSphase at equivalent rates. PAHs are extracted onto the fiber from the sediment porewater for 30 minutes before they are desorbed into the GC/MS injection port.3.4 Toxic Units - Using contaminated site sediment PAH concentrations andsediment organic carbon content, equilibrium partitioning (EqP) is used to predict thepore water concentrations of the PAHs, which are equivalent to the bioavailableconcentrations for the hydrocarbon narcosis model. Alternatively, the pore waterconcentrations can be directly measured to more accurately determine the bioavailableconcentrations than is possible using sediment concentrations and the EqP model. Theanalyte list in Sec. 1.1 can be expanded as described in Refs. 2 and 7 to include thealkyl PAHs necessary to calculate total toxic units based on hydrocarbon narcosistheory. For a more detailed discussion of toxic units and their application see Ref. 6 inSec. 16.0.4.0 INTERFERENCES4.1 Non-target hydrocarbons can cause peaks on selected ion currentprofiles (SICPs) intended for other PAHs. Analysts should be familiar with both parentand alkyl PAH analyses in complex environmental samples.4.2 Solvents, reagents, glassware and other sample processing hardwaremay yield discrete artifacts or elevated baselines that may cause misinterpretation of thechromatographic data. All of these materials must be demonstrated to be free frominterferences under the conditions of analysis by performing laboratory method blanks.<strong>8272</strong> - 5 Revison 0December 2007
Analysts should avoid using PVC gloves, powdered gloves, or gloves with measurablelevels of phthalates. The use of high purity reagents and solvents helps minimizeinterference problems.4.3 For lower molecular weight PAHs, atmospheric contaminants can causesignificant background peaks. This problem is most likely to be significant in urban areasimpacted by atmospheric PAHs (e.g, from diesel exhaust), and with laboratories usingmanual techniques, rather than the SPME autosampler.5.0 SAFETYThis method does not address all safety issues associated with its use. Thelaboratory is responsible for maintaining a safe work environment and a currentawareness file of OSHA regulations regarding the safe handling of the chemicals listedin this method. A reference file of material safety data sheets (MSDSs) should beavailable to all personnel involved in these analyses.6.0 EQUIPMENT <strong>AND</strong> SUPPLIESThis section does not list common laboratory glassware (e.g., beakers andflasks).The mention of trade names or commercial products in this method is forillustrative purposes only, and does not constitute an EPA endorsement of exclusiverecommendation for use. The products and instrument settings cited in SW-846methods represent those products and settings used during method development orsubsequently evaluated by the Agency. Glassware, reagents, supplies, equipment, andsettings other than those listed in this manual may be employed provided that methodperformance for the intended application has been demonstrated and documented.6.1 Centrifuge capable of sustaining 1000 g with cups for securing 40-mLand 20-mL vials.6.2 SPME fiber holder compatible with 7-µm SPME fiber and compatiblewith either the autosampler or the manual method.6.3 SPME fused silica fibers coated with 7 µm film thicknesspolydimethylsiloxane (PDMS) from Sigma-Aldrich (formerly Supelco®) or equivalent.6.4 PTFE coated stir bars (stir fleas) of a size effective for stirring 1.5 mLwater without vortexing (for manual method only).6.5 Magnetic stir plate (for manual method only).6.6 SPME holder stand (for manual method only) or GC/MS autosamplercapable of SPME extraction and injection (LEAP Technologies Combi-Pal or equivalent).<strong>8272</strong> - 6 Revison 0December 2007
6.7 Cleaning port, capable of purging SPME fibers in a helium-sweptatmosphere at 320 °C.6.8 40-mL vials with Teflon-lined caps.6.9 20-mL vials with Teflon-lined caps.6.10 Silanized 2.0-mL autosampler vials.6.11 GC/MS Analysis6.11.1 Gas Chromatograph – Shall have split/splitless injection portfor capillary column, temperature program with isothermal hold.6.11.2 GC column – 60 m x 0.25 mm ID x 0.25 μm film thicknessHP5-MS or equivalent. The column listed in this section was the column used indeveloping the method. The listing of this column in this method is not intendedto exclude the use of other columns that are available or that may be developed.Laboratories may use this or another column provided that the laboratoriesdocument method performance data (e.g., chromatographic resolution, analytebreakdown, and sensitivity) that are appropriate for the intended application.6.11.3 Inlet liner 2 mm i.d. silanized glass.6.11.4 GC inlet 320 °C, splitless mode.6.11.5 Oven program: Isothermal 5 minute hold at 40 °C. Ramp at50 °C /minute to 110 °C, followed by a temperature ramp of 12 °C/minute to320 °C (Hold for 10 min).6.11.6 Mass Spectrometer – Electron impact ionization with theionization energy optimized for best instrument sensitivity (typically 70 eV),stability and signal to noise ratio. Shall be capable of repetitively and selectivelymonitoring at least 12 separate m/zs during a period of approximately 1 second.6.11.7 Data System – A computer system must be interfaced to themass spectrometer. The system must allow the continuous acquisition andstorage on machine-readable media of all mass spectral information obtainedthroughout the duration of the chromatographic program. The computer shouldhave software that can search any GC/MS data file for the SIM ions collectedduring each time window and that can plot such ion abundances.7.0 REAGENTS <strong>AND</strong> ST<strong>AND</strong>ARDS7.1 Reagent grade chemicals must be used in all tests. Unless otherwiseindicated, it is intended that all reagents shall conform to the specifications of theCommittee on Analytical Reagents of the American Chemical Society, where suchspecifications are available. Other grades may be used, provided it is first ascertainedthat the reagent is sufficiently high purity to permit its use without lessening the accuracy<strong>8272</strong> - 7 Revison 0December 2007
of the determination. Reagents should be stored in glass to prevent the leaching ofcontaminants from plastic containers.7.2 Reagent water: Deionized water, free of the analytes of interest. Waterthat meets the purity specifications of HPLC-grade water, or equivalent.7.3 Internal standard stock solution. A dichloromethane solution of d-PAHinternal standards used for preparing spiking solutions by dilution into acetone (see Sec.11.3).7.4 Internal standard spiking solution. A dilution of the internal standardstock solution in acetone used to spike d-PAH internal standards into all sample,calibration, and blank water vials (see Sec. 11.3).7.5 Calibration stock solution. A dichloromethane solution of PAHs used forpreparing calibration standards (see Sec. 11.3).7.6 Calibration Spiking Solutions. A series of solutions prepared by dilutingthe calibration stock solution with acetone (see Sec. 11.3).7.7 Calibration Standards. Prepared by adding internal standard andcalibration spiking solutions in reagent water (see Sec. 11.3).7.8 Acetone (CH 3 COCH 3 )7.9 Dichloromethane (DCM) (CH 2 Cl 2 )7.10 Sodium Hydroxide (NaOH). 1 M NaOH - Slowly add 10 g NaOH pelletsto 125 mL reagent water and stir until completely dissolved. Fill the flask to 250 mL.Wear goggles and be aware of heat of solution. Store in a plastic container.7.11 Aluminum Potassium Sulfate Dodecahydrate (AlK(SO 4 ) 2·12H 2 O).7.12 Alum Solution: Add 20g (AlK(SO 4 ) 2·12H 2 O) to 80 mL reagent water.8.0 SAMPLE COLLECTION, PRESERVATION, <strong>AND</strong> STORAGE8.1 See the introductory material to Chapter Four, "Organic Analytes." Priorto shipment, the sediment samples should be mixed well. Sieve the slurry of sedimentand site water through a 2-mm screen to remove debris. If the sieved slurry is to bestored or shipped before use, store in 250-mL to 1-L glass jars fitted with PTFE-linedlids. Great care must be taken to clean the lid of the jar before capping the jar with the lidto avoid leakage of the water during shipment. Groundwater and tap water samplesshould be stored in 250-mL to 1-L glass bottles fitted with PTFE-lined caps.8.2 Ship samples in an ice chest with adequate ice to maintain 0-6 °C. Storethe samples at the laboratory in the dark at 0-6 °C. Do not allow the samples to freeze.8.3 Once the sample preparation process has begun, pore waters must begenerated and flocculated as quickly as possible, but must be done within 28 days of<strong>8272</strong> - 8 Revison 0December 2007
sediment sample collection. Pore water, groundwater, and tap water samples must thenbe immediately spiked with 10 µL of d-PAH solution following flocculation.8.4 Solid phase micro-extraction must be completed within 24 hours offlocculation for pore water, groundwater, and tap water samples.9.0 QUALITY CONTROL9.1 Refer to Chapter One for guidance on quality assurance (QA) andquality control (QC) protocols. When inconsistencies exist between QC guidelines,method-specific QC criteria take precedence over both technique-specific criteria andthose criteria given in Chapter One. Any effort involving the collection of analytical datashould include development of a structured and systematic planning document, such asa quality assurance project plan (QAPP) or a sampling and analysis plan (SAP), whichtranslates project objectives and directions for those that will implement the project andassess the results. Each laboratory should maintain a formal quality assuranceprogram. The laboratory should also maintain records to document the quality of thedata generated. All data sheets and quality control data should be maintained forreference and inspection.9.2 Refer to Method 8000 for specific determinative method QC procedures.Refer to Method 3500 for QC procedures to ensure the proper operation of the varioussample preparation techniques. If an extract cleanup procedure is performed, refer tomethod 3600 for the appropriate QC procedures. Any more specific QC proceduresprovided in this method will supersede those noted in Methods 8000, 3500, or 3600.9.3 Quality control procedures necessary to evaluate the GC systemoperation are found in Method 8000 and include evaluation of retention time windows,calibration verification and chromatographic analysis of samples. Any more specific QCprocedures provided in this method will supersede those noted in Method 8000.9.4 Initial demonstration of proficiencyEach laboratory must demonstrate initial proficiency with each samplepreparation and determinative method combination it utilizes by generating data ofacceptable accuracy and precision for target analytes in a clean matrix. Analyze sevenreplicates, or any other suitable number based on the project planning objectives, of aninitial demonstration of performance (IDP) solution. The IDP solution is a reagent wateror field sample matrix solution fortified with the method analytes and internal standardsat known concentrations. Ideally, the IDP solution should be prepared by anindependent analyst. The mean and standard deviation of the seven values should thenbe calculated and compared to the test method accuracy and precision guidance valuesin Sec. 13.0.If an autosampler is used to perform sample dilutions, before using theautosampler to dilute samples, the laboratory should satisfy itself that those dilutions areof equivalent or better accuracy than is achieved by an experienced analyst performingmanual dilutions. The laboratory must also repeat the demonstration of proficiencywhenever new staff is trained or significant changes in instrumentation are made. See<strong>8272</strong> - 9 Revison 0December 2007
Method 8000 for further information on how to accomplish a demonstration ofproficiency.9.5 Initially, before processing any samples, the analyst should demonstratethat all parts of the equipment in contact with the sample and reagents are free fromcontaminants and interferences. As a continuing check, each time samples areextracted, cleaned up, and analyzed, and when there is a change in reagents, a methodblank should be prepared and analyzed for the compounds of interest as a safeguardagainst chronic laboratory contamination. If a peak is observed in the retention timewindow of any analyte that would prevent the determination of the analyte, determine thesource and eliminate it, if possible, before processing any samples. The blanks shouldbe carried through all stages of sample preparation and analysis. When new chemicalsor reagents are received, the laboratory should monitor the preparation and/or analysisblanks associated with the samples for any signs of contamination. It is not necessary totest every new batch of reagents or chemicals prior to sample preparation if the sourceshows no prior problems. However, if reagents are changed during a preparation batch,separate blanks need to be prepared for each set of reagents. This initial and continuingmonitoring is accomplished through the analysis of extraction and analytical methodblanks analyzed between every calibration verification standard and sample to monitorthe baseline. See Table 4. Target analytes must not be detected above 1/3 of the lowerlimits of quantitation or greater than 20% of the associated sample result(s).Should the acceptance criteria not be met for any extraction and analytical blank,locate the source of the contamination and correct the problem. Re-extract andreanalyze the associated samples that are less than ten times the level of thecontaminant(s) present in the method blank.9.6 Sample quality control for preparation and analysisThe laboratory must also have procedures for documenting the effect of thematrix on method performance (i.e., precision, accuracy, method sensitivity). At aminimum, this should include the analysis of QC samples including a method blank, amatrix spike, a duplicate and a laboratory control sample (LCS) in each analytical batch.The use of deuterated analogs as internal standards makes the addition of surrogatesunnecessary. Any method blanks, matrix spike samples, and replicate samples shouldbe subjected to the same analytical procedures (Sec. 11.0) as those used on actualsamples.9.6.1 Documenting the effect of the matrix should include theanalysis of at least one matrix spike and one duplicate unspiked sample or onematrix spike/matrix duplicate pair. The decision on whether to prepare andanalyze duplicate samples or a matrix spike/matrix duplicate must be based onknowledge of the samples in the sample batch. If samples are expected tocontain target analytes, laboratories may use a matrix spike and duplicateanalysis of an unspiked field sample. If samples are not expected to containtarget analytes, the laboratories should use a matrix spike/matrix duplicate pair.See Method 3500 for instructions on preparing the matrix spike standard. Thesame standard may be used as the laboratory control standard (LCS) and thespiking solution should be the same source as used for the initial calibrationstandards to restrict the influence of standard accuracy on the determination of<strong>8272</strong> - 10 Revison 0December 2007
ecovery through preparation and analysis. Consult Method 8000 for informationon developing acceptance criteria for the MS/MSD.9.6.2 A laboratory control sample (LCS) should be included witheach analytical batch. The LCS consists of an aliquot of a clean (control) matrixsimilar to the sample matrix and of the same weight or volume. The LCS isspiked with the same analytes at the same concentrations as the matrix spike,where appropriate. As noted in Sec. 9.6.1, the LCS is ideally prepared from thesame source stock standard that is used to prepare the calibration standards.When the results of the matrix spike analysis indicate a potential problem due tothe sample matrix itself, the LCS results are used to verify that the laboratory canperform the analysis in a clean matrix. Consult Method 8000 for information ondeveloping acceptance criteria for the LCS.9.6.3 Also see Method 8000 for the details on carrying out samplequality control procedures for preparation and analysis. In-house methodperformance criteria for evaluating method performance should be developedusing the guidance in Method 8000.9.7 Initial Calibration. The following acceptance criteria must be used forinitial calibration: (i) The signal to noise (S/N) ratio for the GC signals present in everySICP must be > 10:1 for the labeled internal standards and calibration compounds; (ii)The percent relative standard deviation (RSD) for the mean area ratio/ng for labeledinternal standards and the calibration compounds must be less than 30% for highmolecular weight PAHs and less than 25% for low molecular weight PAHs, and the r 2must be greater than 0.99. The calibration curve must not be forced through the origin;and (iii) the number of calibration standards may be reduced from four to three based onthe criteria in Sec. 11.4.1 of this procedure.There must be an initial calibration of the GC/MS system as described in Sec.11.3. In addition, the initial calibration curve should be verified immediately afterperforming the standard analyses using a second source standard (prepared usingstandards different from the calibration standards if available). It is assumed after thismethod is formally published that various standard vendors will offer other sources thanthe current single standard mix source option. Should an independent source orpossibly another lot number from the same standard source used to prepare thecalibration standards not be available during planned sample analyses, the initialcalibration should be verified using the continuing calibration standard. The suggestedacceptance limits for this initial calibration verification analysis are 70 - 130%. Alternativeacceptance limits may be appropriate based on the desired project-specific data qualityobjectives. Quantitative sample analyses should not proceed for those analytes that failthe second source standard initial calibration verification. However, analyses maycontinue for those analytes that fail the criteria with an understanding these results couldbe used for screening purposes and would be considered estimated values.The initial calibration must be re-established if the RSD(s) exceed the limit(s).However, it is not necessary to re-establish the initial calibration in response to anonconforming RSD if the reported sample result(s) are less than the lower limits ofquantitation and the signal to noise ratio and r 2 criteria are met.<strong>8272</strong> - 11 Revison 0December 2007
9.8 Continuing Calibration Verification. The following acceptance criteriamust be used for the daily duplicate calibration verifications: (1) The S/N ratio for the GCsignals present in every SICP must be > 10:1 for the labeled internal standards and thecalibration compounds; (2) The percent differences for the measured area ratio/ng of allanalytes must be within ±25% for high molecular weight PAHs and within ±20% for lowmolecular weight PAHs of the mean values established during the initial calibration.The calibration verification standard should be prepared from the same stockstandard source as is used for the initial calibration curve standards.Should the acceptance criteria for the daily duplicate calibration verifications notbe met, a new initial calibration curve must be established before sample extracts can beanalyzed.9.9 The signal to noise (S/N) ratio for the GC signals present in every SICPmust be > 3:1 for any target analyte in environmental samples and > 10:1 for the labeledinternal standards.Should the acceptance criteria for any sample and/or labeled internal standardsignal to noise ratio not be met, the sample should be reanalyzed unless obvious matrixinterference is present.10.0 CALIBRATION <strong>AND</strong> ST<strong>AND</strong>ARDIZATIONSee Sec. 11.0 for calibration and standardization information.11.0 PROCEDURE11.1 To prepare the apparatus, set up the GC system using the followingparameters.11.1.1 GC Column Agilent HP-5MS column (0.25 µm film thickness,0.25 mm ID) or equivalent.11.1.2 Inlet liner 2-mm i.d. silanized glass.11.1.3 GC Inlet 320 °C, splitless mode.11.1.4 Oven program: Isothermal 5 minute hold at 40 °C. Ramp at50 °C/minute to 110 °C, followed by a temperature ramp of 12 °C/minute to320 °C. (Hold for 10 min.)MS Quad Temperature: 150 °C, maximum 200 °CMS Source Temperature: 230 °C, maximum 250 °C<strong>8272</strong> - 12 Revison 0December 2007
11.2 SIM Group Set Up11.2.1 Set up a SIM program with the necessary ions to acquire allthe PAHs using the ion groups shown in Table 1 and set a 25 msec dwell timeper ion.11.2.2 Update the expected retention times in the method section ofthe quantitation software using the d-PAH internal standards of previous runs asrelative retention time markers.11.3 Establish Initial CalibrationThe following initial calibration guidance is based on data generated during themethod development process. The recommended calibration concentrations listed inTable 2 were based on the PAH distributions previously determined in 120 sedimentpore water samples and take into account the water solubilities of each individual PAHcompound. These are the recommended calibration standard concentrations foroptimum method performance. However, other concentrations may be used providedacceptable method performance can be attained.11.3.1 Prepare stock solutions of PAHs and internal standard stocksolutions of d-PAHs at approximately the concentrations shown in Table 2.Stocks are prepared in DCM. Spiking solutions are prepared by dilution ofintermediate stocks in acetone. For calibration solutions, spiking solutions areadded to reagent water.11.3.1.1 Prepare calibration standard spiking solutions.These are prepared by adding acetone to the stock to give thecalibration solution concentrations (CS1-CS4), as described below.11.3.1.1.1 For CS1, take 5 µL stock to 100 mL inacetone.11.3.1.1.2 For CS2 take 50 µL to 100 mL inacetone.11.3.1.1.3 For CS3, take 25 µL to 10 mL inacetone.11.3.1.1.4 For CS4, take 100 µL to 10 mL inacetone.11.3.1.2 Spike 4 µL of each calibration solution into 1.5 mLof reagent water to give a calibration series with the low calibration limits(LCLs) and upper calibration limits (UCLs) shown in Table 2. Spike 10µL of internal standard spiking solution at the concentrations shown inTable 2 into each vial.11.3.1.3 Extract and analyze the calibration series.<strong>8272</strong> - 13 Revison 0December 2007
11.3.1.3.1 Extract and analyze two method blanksolutions.11.3.1.3.2 Extract and analyze the watercalibration solutions, as described in Secs. 11.4 and 11.5.Begin with the CS1-spiked sample, followed by sequentiallymore concentrated calibration standards. Follow by twowater blanks.11.3.1.4 Calculate the performance parameters for thecalibration.11.3.1.4.1 Generate ion chromatograms for themasses listed in Table 1 that encompass the expectedretention windows of the target analytes. Integrate theselected ion current profiles of the quantitation ions shown inthe table.11.3.1.4.2 Calculate the area ratio (analyte peakarea divided by internal standard peak area) per unit mass ofanalyte, using the area of the appropriate internal standardlisted in Table 3.Quantitative calculations are based on acomparison of the area ratio per ng from the calibration andsample waters. The area ratio per ng is calculated forcalibration runs by dividing the calibration peak area by thepeak area of its most closely associated d-PAH internalstandard (the deuterated parent PAH, in most cases), anddividing this result by the ng of the calibration PAH present inthe vial (i.e., its mass in the vial, not its concentration).Calibration standards are given in Table 2.(area ratio/ng) = [(peak area cal. std)/(peak area d-PAH)]/(mass of std in cal vial)11.3.1.4.3 Calculate the mean area ratio/ng. Themean relative response factor for these duplicate dailycalibration standards should agree with those from the 4-point (or 3-point) standard curve within 20% for the two- andthree-ring PAHs, and within 25% for the four-ring PAHs. Nosample data will be reported if these calibration criteria arenot met. Calculate the mean area ratio/ng and the standarddeviation of the relative response factors for each calibrationstandard solution using the following equations:area ratio/ng=1nn∑i=1(area ratio/ng) i<strong>8272</strong> - 14 Revison 0December 2007
Where:(area ratio/ng) I = area ratio/ng calculated forcalibration solution “i” using theequation in Sec. 11.3.1.4.2.n = The number of calibration points in thecurve.Where:11.3.1.4.4 Calculate the percent relativestandard deviation.SD% RSD =× 100area ratio/ngarea ratio/ng = Mean area ratio/ng calculatedabove.SD = The sample standard deviation of the replicatearea ratio/ng values used to calculate the meanarea ratio/ng.11.4 Criteria for acceptable initial calibration. Prior to analyzing any samples,the standard curves are prepared using the identical analysis procedures as used forsample waters. To be acceptable, the linearity of each PAH standard curve should be r 2greater than 0.99, and the relative response factor per ng for each concentration shouldshow a relative standard deviation of less than 25% for two- to three-ring PAHs, and lessthan 30% for four-ring PAHs. If an acceptable initial calibration is not achieved, identifythe root cause, perform corrective action, and repeat the initial calibration. If the rootcause can be traced to an abnormal disruption of an individual acquisition (e.g., injectormalfunction) repeat the individual analysis and recalculate the percent relative standarddeviation. If the calibration is acceptable, document the problem and proceed; otherwiserepeat the initial calibration. Additionally, prior to sample analyses the initial calibrationshould be verified using a check standard mix that is prepared from an independentsource as the calibration standards. Should an independent source or possibly anotherlot number from the same standard source used to prepare the calibration standards notbe available during planned sample analyses, the initial calibration should be verifiedusing the continuing calibration check standard.11.4.1 Because of the large range of calibration concentrationsrequired, the wide range of water solubilities of the individual PAHs, and thedesire to require only one stock calibration solution, some PAHs may only have athree point linear calibration curve that meets the above criteria. This is mostlikely to occur for the higher molecular weight PAHs, because the dilution oflowest calibration standard is likely to be below the lower limit of quantitationrequired for the method, so it does not negatively impact the analysis. In such<strong>8272</strong> - 15 Revison 0December 2007
cases, the lowest calibration standard is ignored. Less frequently, the highestconcentrations of the lowest molecular weight PAHs may exceed the lineardynamic range of the GC/MS response. In such cases the laboratory shouldinvestigate lowering the MS multiplier voltage to autotune voltage or slightlybelow and rerun the calibration curve. If the highest calibration standard stillexceeds the detector linearity, it is acceptable to reject the highest concentrationfor those specific PAHs, as long as a minimum of a three-point standard curve isgenerated for each PAH.It is recommended that a 4- (or 3-) point initial calibration be establishedevery two weeks, when continuing calibration criteria are not met, or whenservice is performed on the GC/MS instrument system.11.4.2 The S/N for the GC signals present in every SICP must be >10:1 for the labeled internal standards and unlabeled calibration compounds.11.5 Continuing calibration check is performed daily at the beginning of a 24-hour period. The injection of the first continuing calibration begins the 24-hour window,within which all pore water samples must be injected. Duplicate daily standards areanalyzed.11.5.1 To prepare the continuing calibration check solution, into 1.5mL of reagent water, add 4 µL of the CS3 calibration check spiking solution and10 µL of the d-PAH internal standards.11.5.2 Analyze duplicate vials of the continuing calibration checkstandard solution. Use the same data acquisition parameters as those usedduring the initial calibration. Check for GC resolution and peak shape. If peakshape or retention times are unacceptable, perform column and injectormaintenance. If this fails to correct the problem, the column must be replacedand the calibration repeated.11.5.3 Criteria for Acceptable Daily Calibration Check. The criterialisted below for acceptable calibration must be met at the beginning of each 24-hour period that samples are analyzed. The mean relative response factor for theduplicate daily calibration standards should agree with those from the 4-point (or3-point) standard curve within 20% for the two- and three-ring PAHs, and within25% for the four-ring PAHs. No sample data will be reported if these calibrationcriteria are not met. If the continuing calibration check criteria are not met,identify the root cause, perform corrective action and repeat the continuingcalibration. If the second consecutive continuing calibration check does not meetacceptance criteria, additional corrective action must be performed.Additionally, after establishment of the 4-point calibration curve, the rawpeak areas of each d-PAH for each subsequent daily calibration check, methodblank, and sample analyses must be greater than or equal to 50% of the meanraw peak area for each d-PAH internal standard established for the 4-pointcalibration curve.11.5.4 The S/N for the GC signals present in every SICP must be >10:1 for the labeled internal standards and unlabeled calibration compounds.<strong>8272</strong> - 16 Revison 0December 2007
11.6 Method blanks are prepared and analyzed daily in duplicate followingthe continuing calibration and between analyses of replicate sets of the same pore watersample. See Sec. 11.6.2.2.11.6.1 For each method blank, add 10 µL of the d-PAH internalstandards solution into 1.5 mL of reagent water.11.6.2 Two types of sources of background PAHs must beconsidered. For the higher molecular weight PAHs, typical GC/MS criteria forsignal to noise are appropriate, since their lower limits of quantitation arenormally controlled by GC/MS sensitivity. However, for lower molecular weightPAHs, atmospheric contaminants can cause significant background peaks.11.6.2.1 Background PAHs from Ambient Air –Concentrations of each PAH in the water blanks should be calculated inthe same manner as a sample. Should the blank prior to the subsequentwater sample have any detectable background concentration greaterthan 1/3 of the example lower limits of quantitation given in Table 3, theanalyses should not continue until the fiber is sufficiently cleaned asdemonstrated by a clean reagent water blank.11.6.2.2 Carryover from Highly Contaminated Samples –Carryover blanks are analyzed between each new pore water sample(not including replicates). Significant carryover can occur if the previoussample was highly contaminated. Should the blank prior to thesubsequent water sample have any detectable backgroundconcentrations more than 1/3 of the example lower limits of quantitationgiven in Table 3, the analyses should not continue until the fiber issufficiently cleaned as demonstrated by a clean reagent water blank.Alternatively, if the concentrations determined in the blanks are lessthan 20% of those found in the associated sample(s), the data may beaccepted.11.7 At the laboratory, store samples and extracts in the dark at 0 to 6 °C.NOTE:Once the sample preparation process has begun, porewaters must be generated and flocculated as quickly aspossible, but must be done within 28 days of sedimentsample collection. Pore water, groundwater, and tap watersamples must then be immediately spiked with 10 µL ofd-PAH solution following flocculation.Solid phase micro-extraction must be completed within 24hours of flocculation for pore water, groundwater, and tapwater samples.11.8 Generation of pore water from sediment samples.Stir the slurry and transfer approximately 40 mL (containing a solids and liquidsin proportion to the slurry provided) to a clean 40 mL vial. Cap the vial with a PTFE-lined<strong>8272</strong> - 17 Revison 0December 2007
cap. Place the vials in a centrifuge. Spin for 30 minutes at 1000 g. Using a new,graduated serological pipette, transfer 10 mL of the supernatant to a new 20 mL vial.11.9 Flocculation of pore water samples.11.9.1 Once the process has begun, immediately add the workingalum solution (see Sec. 7.0) to each vial of water (and QC samples). The volumeof the alum solution should be 1/40th of the sample volume. After the addition,swirl the vial for several rotations to incorporate the solution.11.9.2 Add 3-5 drops of NaOH working solution (see Sec. 7.0) toeach vial. Swirl to incorporate the NaOH.11.9.3 Shake the vial for 15 seconds.11.9.4 Centrifuge for 30 minutes at 1000 g.11.9.5 Collect the supernatant into a clean 20 mL vial.11.9.6 Repeat Secs. 11.10.1 through 11.10.5 once.11.9.7 Immediately transfer 1.5 mL aliquots to new silanizedautosampler vials and immediately add the internal standard solution asdescribed below. Vials are weighed before and after adding the water sample todetermine the exact sample water mass.11.10 Extraction and analysis of flocculated pore water, groundwater, and tapwater samples.11.10.1 Split the prepared water samples into the required number ofreplicate samples, placing 1.5 mL aliquots of each into a new silanized glassautosampler vials. For QC samples, add 1.5 mL of reagent water.NOTE: The SPME fiber should be cleaned at the beginning of each samplingset (and after highly contaminated samples) for one hour by placing inthe cleaning chamber under helium flow at 320 °C. This canconveniently be performed while the pore waters are being prepared.11.10.2 Immediately add 10 µL of the d-PAH solution to eachsample and QC sample.NOTE: All of the water preparation steps beginning with the centrifugation andending with the addition of d-PAH internal standards should beconducted continuously and in the minimum amount of time possible.11.10.3 Load the autosampler following the recommended analyticalsequence in Table 4. Verify the sequence against documented sequencefollowing the loading process.11.11 The recommended analytical sequence described in Table 4 is basedon a 24-hour “clock.”<strong>8272</strong> - 18 Revison 0December 2007
11.11.1 Two continuing calibration check standards are analyzed(100 min.). The sequence begins with analysis of the first continuing calibrationstandard.11.11.2 Analyze two method blanks (50 min. each).11.11.3 Analyze pore water samples (in duplicate at a minimum) (50min. each).11.12 Generate ion chromatograms for the masses listed in Table 1 thatencompass the expected retention windows of the target analytes. Integrate the selectedion current profiles of the quantitation ions shown in the table.For a gas chromatographic peak to be identified as a target analyte, it must meetall of the following qualitative identification criteria for individual analytes.11.12.1 The quantitation ion must be present, with a S/N of at least3:1 for environmental samples.11.12.2 The relative retention time (RRT) of the parent PAHs (andthe 2- and 1- methylnaphthalene compounds) compared to the RRT for thelabeled-standards must be within ± 3 seconds of the relative retention timesobtained from the continuing calibration (or initial calibration if this applies).11.13 Quantitation for Target AnalytesResults need to be reported in the units commensurate with their intended useand all dilutions need to be taken into account when computing final results.Sample water concentrations are calculated by dividing the peak area of thesample peak by the peak area of its d-PAH internal standard, and then dividing the resultby the calibration area ratio per ng, and dividing that result by the sample water weight.(area samplepeak)/(area d - PAH peak)Concentrat ion(ng/mL) =(area ratio per ng cal.std) / (sampleweight)The mean calibration area ratio per ng values from the daily calibration checkruns is used for sample concentration calculations (assuming QA/QC checks with the fullcalibration curve meet criteria).NOTE: The two methylnaphthalene isomers are individual alkyl peaks and aretreated as parent PAHs in the calculations.11.13.1 If no peaks are present at a S/N > 3 to 1 in the region of theion chromatogram where the compounds of interest are expected to elute, reportthe result as “Not Detected” (i.e., ND) at the reporting limit.11.13.2 Depending on project objectives, the results may be reportedto lower limit of quantitation which is typically defined as 1/34 of a toxic unit. SeeSec. 3.2 for additional information related to the lower limit of quantitation.<strong>8272</strong> - 19 Revison 0December 2007
12.0 DATA ANALYSIS <strong>AND</strong> CALCULATIONSSee Secs. 11.12 and 11.13 for calculations.13.0 <strong>METHOD</strong> PERFORMANCE13.1 Performance data and related information are provided in SW-846methods only as examples and guidance. The data do not represent requiredperformance goals for users of the methods. Instead, performance goals should bedeveloped on a project-specific basis, and the laboratory should establish in-house QCperformance criteria for the application of this method. These performance data are notintended to be and must not be used as absolute QC acceptance criteria for purposes oflaboratory accreditation.13.2 Tables 5 through 12 present precision and bias data from threeindependent laboratories for spiked reagent water, groundwater, and two sediment porewater matrices. The PAH-impacted sediment samples were collected from an aluminumsmelter site and a manufactured gas plant (MGP) site. These data are provided forguidance purposes only.For the inter-laboratory validation study (ILV), the pore waters were spiked with12 two- to four-ring PAHs at levels approximately 5 times and 50 times above theperformance limit concentrations except for the five heavier PAHs, whose spike levelswere based on the saturation solubility of the individual compounds. The highestmolecular weight PAHs (i.e. benz(a)anthracene and chrysene), were spiked at five timesthe lower limit of quantitiation in the high level samples, instead of 50-fold, because ofsolubility limitations. In the low-level samples, benz(a)anthracene and chrysene werespiked at concentrations less than lower limit of quantitiation for these compounds.Therefore, based on the custodial laboratory recommendation, the low-level spikeresults for benz(a)anthracene and chrysene were not reported.Seven replicate SPME analyses of the spiked sample pore waters wereperformed on each sample by each participating laboratory. Statistical outliers weredetermined and omitted using a one sided t-test at the 1% significance interval. Allstatistical outliers were traceable to one replicate analysis of the low-level groundwatersample from one participating laboratory. The high outlying results were caused byambient (i.e., background) PAH contamination at the laboratory.13.2.1 PAH concentration had no significant effect on the accuracyand reproducibility of the technique. The ILV recoveries for both the low andhigh-level spiked pore water samples (smelter and MGP sediments) ranged from68 to 107 percent. The recoveries for both the low and high-level spikedaqueous samples (reagent water and groundwater) ranged from 81 to 108percent.13.2.2 It was assumed that the calculated standard deviation usingthe combined data from all three participating laboratories was equivalent to the<strong>8272</strong> - 20 Revison 0December 2007
overall standard deviation (S T ). Replicate determinations of sample PAHconcentrations typically had relative standard deviations (RSDs) less than 25percent for the aqueous samples (reagent water and groundwater), with RSDsless than 33% for the impacted sediment samples (smelter and MGP sediments).14.0 POLLUTION PREVENTION14.1 Pollution prevention encompasses any technique that reduces oreliminates the quantity and/or toxicity of waste at the point of generation. Numerousopportunities for pollution prevention exist in the laboratory operation. The USEPA hasestablished a preferred hierarchy of environmental management techniques that placespollution prevention as the management option of first choice. Whenever feasible,laboratory personnel should use pollution prevention techniques to address their wastegeneration. When wastes cannot be feasibly reduced at the source, the Agencyrecommends recycling as the next best option.In keeping with USEPA goals this method uses a minimum of hazardousmaterials and results in only small amounts of hazardous waste.14.2 For information about pollution prevention that may be applicable tolaboratories and research institutions consult Less is Better: Chemical Management forWaste Reduction available from the American Chemical Society’s Department ofGovernment Relations and Science Policy, 1155 16 th St., N.W. Washington D.C. 20036,http://www.acs.org.15.0 WASTE MANAGEMENT15.1 The USEPA requires that laboratory waste management practices beconducted consistent with all applicable rules and regulations. The Agency urgeslaboratories to protect the air, water, and land by minimizing and controlling all releasesfrom hoods and bench operations, complying with the letter and spirit of any sewerdischarge permits and regulations, and by complying with all solid and hazardous wasteidentification rules and land disposal restrictions. For further information on wastemanagement, consult The Waste Management Manual for Laboratory Personnelavailable from the American Chemical Society at the address listed in Sec. 14.2.15.2 Some of the reagents and solutions used in this method as well as theeffluent from the chromatograph contain PAHs and should be handled and disposed ofin an approved manner.16.0 REFERENCES1. American Society for Testing Methods (ASTM), E178-02, “Standard Practice forDealing with Outlying Observations,” Volume 14.02.<strong>8272</strong> - 21 Revison 0December 2007
2. S. B. Hawthorne, C. B. Grabanski, D. J. Miller and J. P. Kreitinger, “Solid PhaseMicroextraction Measurement of Parent and Alkyl Polycyclic AromaticHydrocarbons in Milliliter Sediment Pore Water Samples and Determination ofK DOC Values,” Environ. Sci. Technol, 39, 2795-2803, 2005.3. D. I. Thal, “Preparation of Flocculated Pore Waters and Analysis of Parent andAlkyl Polycyclic Aromatic Hydrocarbons by Isotope Dilution Solid PhaseMicroextraction/Gas Chomatography/Mass Spectrometry (SPME/GC/MS)(Hawthorne Method),” Standard Operating Procedure KNOX-ID-0019, ©SevernTrent Laboratories. 2006.4. S. B. Hawthorne, C. B. Grabanski, and D. J. Miller, “Measured PartitioningCoefficients for Parent and Alkyl Polycyclic Aromatic Hydrocarbons in 114Historically Contaminated Sediments: Part I, Koc Values,” EnvironmentalToxicology and Chemistry, 25, 2901-2911, 2006.5. U.S. EPA (OSWER), “Development and Validation of SW-846 Methods, Phase 2:Formal Validation,” April, 1992.http://www.epa.gov/epaoswer/hazwaste/test/pdfs/methdev.pdf6. U. S. Environmental Protection Agency, “Procedures for the Derivation ofEquilibrium Partitioning Sediment Benchmarks (ESBs) for the Protection ofBenthic Organisms: PAH Mixtures,” EPA/600/R-02/013, Office of Research andDevelopment, Washington D.C., November 2003.7. American Society for Testing Methods (ASTM), D7363-07, “Standard TestMethod For Determination Of Parent Alkyl Polycyclic Aromatics in Sediment PoreWater Using Solid Phase Microextraction and Gas Chromatography/MassSpectrometry in Selected Ion Monitoring Mode,” Volume 11.02.8. D. Mackay and W.U. Shiu, Aqueous solubility of polynuclear aromatichydrocarbons,J. Chem. Eng. Data 22 (1977), pp. 399–402.9. Syracuse Research Corporation, Environmental Database17.0 TABLES <strong>AND</strong> FIGURESThe following pages contain the tables and figures referenced by this method.<strong>8272</strong> - 22 Revison 0December 2007
TABLE 1SIM TARGET IONS <strong>AND</strong> RETENTION TIME WINDOWSAnalyteCarbon Hydrogen Mass of SIM Target12(amu)1.007825(amu)Compound(amu)IonGroupRetentionTime a (min)m/z Start StopNaphthalene 10 8 128.063 1 128.1 7 171-Methylnaphthalene 11 10 142.078 1 142.1 7 172-Methylnaphthalene 11 10 142.078 1 142.1 7 17Acenaphthylene 12 8 152.063 1 152.1 7 17Acenaphthene 12 10 154.078 1 154.1 7 17Fluorene 13 10 166.078 1 166.1 7 17Anthracene 14 10 178.078 2 178.1 17 21Phenanthrene 14 10 178.078 2 178.1 17 21Fluoranthene 16 10 202.078 2,3 202.1 17 30Pyrene 16 10 202.078 2,3 202.1 17 30Benz(a)anthracene 18 12 228.094 3 228.1 21 30Chrysene 18 12 228.094 3 228.1 21 30d-PAH Internal StandardsDeuterium2.014102(amu)Naphthalene-d8 10 8 136.113 1 136.1 7 171-Methylnaphthalene-d10 11 10 152.141 1 152.1 7 17Acenaphthene-d10 12 10 164.141 1 164.1 7 17Fluorene-d10 13 10 176.141 1 176.1 7 17Phenanthrene-d10 14 10 188.141 2 188.1 17 21Fluoranthene-d10 16 10 212.141 2,3 212.1 17 30Pyrene-d10 16 10 212.141 2,3 212.1 17 30Chrysene-d12 18 12 240.169 3 240.2 21 30a : Retention times must be verified by the user.<strong>8272</strong> - 23 Revison 0December 2007
TABLE 2INITIAL CALIBRATION ST<strong>AND</strong>ARD SERIESDCMStockLCLUCLConc. CS1 CS2 CS3 CS4Analyte mg/mL ng/1.5 mL ng/1.5 mL ng/1.5 mL ng/1.5 mLNaphthalene 42 8.3 83 415 16601-Methylnaphthalene 24 4. 8 48 239 9562-Methylnaphthalene 20 4.1 41 204 817Acenaphthylene 9.0 1.8 18 90 361Acenaphthene 11 2.2 22 110 440Fluorene 7.6 1.5 15 76 302Anthracene 0.60 0.12 1.2 6.0 24Phenanthrene 5.5 1.1 11 55 220Fluoranthene 2.1 0.42 4.2 21 84Pyrene 1.8 0.36 3.6 18 72Benz(a)anthracene 0.08 0.02 0.16 0.80 3.2Chrysene 0.03 0.006 0.06 0.30 1.2Deuterated Analogs ofMix A CompoundsStockSolutionCS1 CS2 CS3 CS4Naphthalene-d8 5 50 50 50 501-Methylnaphthalene-d10 6 60 60 60 60Acenaphthene-d10 1.2 12 12 12 12Fluorene-d10 1.2 12 12 12 12Phenanthrene-d10 0.96 9.6 9.6 9.6 9.6Fluoranthene-d10 0.93 9.3 9.3 9.3 9.3Pyrene-d10 0.84 8.4 8.4 8.4 8.4Chrysene-d12 0.033 0.33 0.33 0.33 0.33<strong>8272</strong> - 24 Revison 0December 2007
TABLE 3EXAMPLE TOXIC UNIT FACTORS <strong>AND</strong> LOWER LIMITS OF QUANTITATION (LLOQ)AnalyteAddedd-PAHInternalStandardd-PAHInternalStd. forCalculationSPME-GC/MSRRF vs.ParentConc. ForOne ToxicUnit, C tu ,(ng/mL)LLOQ(ng/mL)Naphthalene A A 1.00 193 5.72-Methylnaphthalene B 1.00 82 2.41-Methylnaphthalene B B 1.00 82 2.4Acenaphthylene C 1.00 307 9.0Acenaphthene C C 1.00 56 1.6Fluorene D D 1.00 39 1.2Phenanthrene E E 1.00 19 0.56Anthracene E 1.00 21 0.61Fluoranthene F F 1.00 7.1 0.21Pyrene G G 1.00 10 0.30Benz(a)anthracene H 1.00 2.2 0.07Chrysene H H 1.00 2.0 0.06Data taken from Ref. 6.<strong>8272</strong> - 25 Revison 0December 2007
TABLE 4EXAMPLE OF A 24-HOUR ANALYTICAL SEQUENCE aRun TypeMinutesCumulativeMinutes toStartCumulativeMinutes toEndCumulativeHours toStart aCumulativeHours toEndVerification Std. 50 0 50 0.0 0.8Verification Std. 50 50 100 0.8 1.7Blank 50 100 150 1.7 2.5Blank 50 150 200 2.5 3.3Sample 50 200 250 3.3 4.2Sample 50 250 300 4.2 5.0Blank 50 300 350 5.0 5.8Blank 50 350 400 5.8 6.7Sample 50 400 450 6.7 7.5Sample 50 450 500 7.5 8.3Blank 50 500 550 8.3 9.2Blank 50 550 600 9.2 10.0Sample 50 600 650 10.0 10.8Sample 50 650 700 10.8 11.7Blank 50 700 750 11.7 12.5Blank 50 750 800 12.5 13.3Sample 50 800 850 13.3 14.2Sample 50 850 900 14.2 15.0Blank 50 900 950 15.0 15.8Blank 50 950 1000 15.8 16.7Sample 50 1000 1050 16.7 17.5Sample 50 1050 1100 17.5 18.3Blank 50 1100 1150 18.3 19.2a The last pore water sample must be injected within 24 hours of the flocculation step.(i.e., The value for cumulative hours to start must be < 24.)<strong>8272</strong> - 26 Revison 0December 2007
TABLE 5REAGENT WATER LOW-LEVEL PRECISION <strong>AND</strong> BIAS DATAAnalyteTrueValue(ng/mL)NumberofRetainedValuesOverallMeanRecovery(ng/mL)OverallMeanRecovery(%)OverallStandardDeviation(S T )RelativeStandardDeviation(ng/mL)Naphthalene 28 21 27 99 2.9 112-Methylnaphthalene 14 21 12 91 1.7 141-Methylnaphthalene 16 21 15 97 1.8 12Acenaphthylene 6.0 21 5.5 92 0.74 13Acenaphthene 7.3 21 6.9 94 0.77 11Fluorene 5.0 21 4.8 96 0.49 10Phenanthrene 3.7 21 3.5 96 0.34 10Anthracene 0.40 21 0.32 81 0.10 30Fluoranthene 1.4 21 1.4 97 0.18 13Pyrene 1.2 21 1.2 97 0.14 12Benz(a)anthracene 0.05 21 NR NR NR NRChrysene 0.02 21 NR NR NR NRNR: Not reported.<strong>8272</strong> - 27 Revison 0December 2007
TABLE 6REAGENT WATER HIGH-LEVEL PRECISION <strong>AND</strong> BIAS DATAAnalyteTrueValue(ng/mL)NumberofRetainedValuesOverallMeanRecovery(ng/mL)OverallMeanRecovery(%)OverallStandardDeviation(S T )RelativeStandardDeviation(ng/mL)Naphthalene 277 21 263 95 30 112-Methylnaphthalene 136 21 118 87 22 191-Methylnaphthalene 159 21 150 94 20 13Acenaphthylene 60 21 56 94 9.6 17Acenaphthene 73 21 70 96 8.4 12Fluorene 50 21 48 96 6.0 12Phenanthrene 37 21 35 96 4.6 13Anthracene 4.0 21 3.6 89 0.70 20Fluoranthene 14 21 13 96 1.8 14Pyrene 12 21 11 95 1.5 13Benz(a)anthracene 0.53 21 0.48 91 0.04 7.4Chrysene 0.20 21 0.20 99 0.02 7.6<strong>8272</strong> - 28 Revison 0December 2007
TABLE 7GROUNDWATER LOW-LEVEL PRECISION <strong>AND</strong> BIAS DATAAnalyteTrueValue(ng/mL)NumberofRetainedValuesOverallMeanRecovery(ng/mL)OverallMeanRecovery(%)OverallStandardDeviation(S T )RelativeStandardDeviation(ng/mL)Naphthalene 28 20 26 93 1.6 6.12-Methylnaphthalene 14 20 13 93 1.1 8.81-Methylnaphthalene 16 20 15 92 0.98 6.7Acenaphthylene 6.0 21 5.4 90 0.51 9.4Acenaphthene 7.3 20 6.6 91 0.40 6.1Fluorene 5.0 20 4.6 91 0.26 5.7Phenanthrene 3.7 21 3.6 99 0.36 10Anthracene 0.40 21 0.42 105 0.03 7.9Fluoranthene 1.4 20 1.3 93 0.07 5.1Pyrene 1.2 21 1.1 92 0.07 6.4Benz(a)anthracene 0.05 21 NR NR NR NRChrysene 0.02 21 NR NR NR NRNR: Not reported.<strong>8272</strong> - 29 Revison 0December 2007
TABLE 8GROUNDWATER HIGH-LEVEL PRECISION <strong>AND</strong> BIAS DATAAnalyteTrueValue(ng/mL)NumberofRetainedValuesOverallMeanRecovery(ng/mL)OverallMeanRecovery(%)OverallStandardDeviation(S T )RelativeStandardDeviation(ng/mL)Naphthalene 277 21 254 92 23 9.02-Methylnaphthalene 136 21 118 86 16 131-Methylnaphthalene 159 21 145 91 15 11Acenaphthylene 60 21 54 90 4.9 9.1Acenaphthene 73 21 69 94 5.3 7.7Fluorene 50 21 47 94 2.7 5.7Phenanthrene 37 21 37 101 6.6 18Anthracene 4.0 21 3.9 97 0.56 14Fluoranthene 14 21 13 92 0.86 6.7Pyrene 12 21 11 90 0.61 5.7Benz(a)anthracene 0.53 21 0.48 91 0.05 11Chrysene 0.20 21 0.18 88 0.02 8.7<strong>8272</strong> - 30 Revison 0December 2007
TABLE 9ALUMINUM SMELTER SEDIMENT LOW-LEVEL PRECISION <strong>AND</strong> BIAS DATAAnalyteTrueValue(ng/mL)NumberofRetainedValuesOverallMeanRecovery(ng/mL)OverallMeanRecovery(%)OverallStandardDeviation(S T )RelativeStandardDeviation(ng/mL)Naphthalene 28 21 27 99 2.9 112-Methylnaphthalene 14 21 13 96 1.3 9.91-Methylnaphthalene 16 21 15 97 1.7 11Acenaphthylene 6.0 21 6.2 102 0.54 8.8Acenaphthene 7.3 21 7.1 96 0.59 8.4Fluorene 5.0 21 4.9 97 0.42 8.6Phenanthrene 3.7 21 3.6 99 0.37 10Anthracene 0.54 21 0.58 107 0.10 18Fluoranthene 2.5 21 2.3 93 0.46 20Pyrene 1.7 21 1.5 87 0.33 22Benz(a)anthracene 0.15 21 NR NR NR NRChrysene 0.20 21 NR NR NR NRNR: Not reported.<strong>8272</strong> - 31 Revison 0December 2007
TABLE 10ALUMINUM SMELTER SEDIMENT HIGH-LEVEL PRECISION <strong>AND</strong> BIAS DATAAnalyteTrueValue(ng/mL)NumberofRetainedValuesOverallMeanRecovery(ng/mL)OverallMeanRecovery(%)OverallStandardDeviation(S T )RelativeStandardDeviation(ng/mL)Naphthalene 277 21 260 94 42 162-Methylnaphthalene 136 21 111 81 29 261-Methylnaphthalene 159 21 147 92 26 18Acenaphthylene 60 21 60 99 14 24Acenaphthene 73 21 70 95 11 16Fluorene 50 21 48 96 7.2 15Phenanthrene 37 21 34 93 5.6 16Anthracene 4.0 21 4.2 104 0.63 15Fluoranthene 14 21 14 99 2.4 17Pyrene 12 21 11 94 1.8 16Benz(a)anthracene 0.63 21 0.49 78 0.04 8.5Chrysene 0.37 21 0.30 81 0.05 18<strong>8272</strong> - 32 Revison 0December 2007
TABLE 11MGP SEDIMENT LOW-LEVEL PRECISION <strong>AND</strong> BIAS DATAAnalyteTrueValue(ng/mL)NumberofRetainedValuesOverallMeanRecovery(ng/mL)OverallMeanRecovery(%)OverallStandardDeviation(S T )RelativeStandardDeviation(ng/mL)Naphthalene 28 21 26 95 2.1 8.12-Methylnaphthalene 14 21 13 92 1.2 9.31-Methylnaphthalene 16 21 15 92 1.3 8.6Acenaphthylene 6.0 21 5.6 92 0.48 8.6Acenaphthene 7.3 21 6.7 91 0.51 7.6Fluorene 5.0 21 4.6 91 0.34 7.5Phenanthrene 3.7 21 3.3 91 0.21 6.4Anthracene 0.40 21 0.34 85 0.08 24Fluoranthene 1.4 21 1.3 92 0.11 8.4Pyrene 1.2 21 1.1 92 0.09 7.8Benz(a)anthracene 0.05 21 NR NR NR NRChrysene 0.02 21 NR NR NR NRNR: Not reported.<strong>8272</strong> - 33 Revison 0December 2007
TABLE 12MGP SEDIMENT HIGH-LEVEL PRECISION <strong>AND</strong> BIAS DATAAnalyteTrueValue(ng/mL)NumberofRetainedValuesOverallMeanRecovery(ng/mL)OverallMeanRecovery(%)OverallStandardDeviation(S T )RelativeStandardDeviation(ng/mL)Naphthalene 277 21 257 93 36 142-Methylnaphthalene 136 21 118 87 24 211-Methylnaphthalene 159 21 148 93 22 15Acenaphthylene 60 21 58 96 9.0 16Acenaphthene 73 21 70 95 9.8 14Fluorene 50 21 48 95 6.9 14Phenanthrene 37 21 35 94 5.4 16Anthracene 4.0 21 3.5 87 1.1 30Fluoranthene 14 21 13 94 2.0 16Pyrene 12 21 11 94 1.6 14Benz(a)anthracene 0.53 21 0.43 81 0.05 12Chrysene 0.20 21 0.19 93 0.02 8.8<strong>8272</strong> - 34 Revison 0December 2007


