King Island Council Annual Report 2011-2012 (1921 kb)
King Island Council Annual Report 2011-2012 (1921 kb)
King Island Council Annual Report 2011-2012 (1921 kb)

Create successful ePaper yourself
Turn your PDF publications into a flip-book with our unique Google optimized e-Paper software.
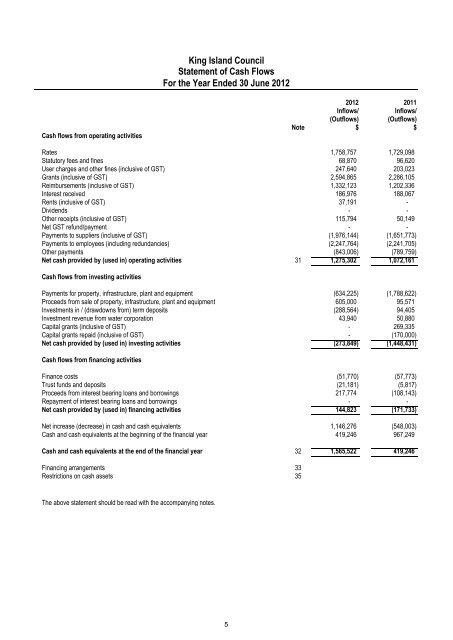
<strong>King</strong> <strong>Island</strong> <strong>Council</strong>Statement of Cash FlowsFor the Year Ended 30 June <strong>2012</strong>Cash flows from operating activities<strong>2012</strong> <strong>2011</strong>Inflows/Inflows/(Outflows) (Outflows)Note $ $Rates 1,758,757 1,729,098Statutory fees and fines 68,870 96,620User charges and other fines (inclusive of GST) 247,640 203,023Grants (inclusive of GST) 2,594,865 2,286,105Reimbursements (inclusive of GST) 1,332,123 1,202,336Interest received 186,976 188,067Rents (inclusive of GST) 37,191 -Dividends - -Other receipts (inclusive of GST) 115,794 50,149Net GST refund/payment - -Payments to suppliers (inclusive of GST) (1,976,144) (1,651,773)Payments to employees (including redundancies) (2,247,764) (2,241,705)Other payments (843,006) (789,759)Net cash provided by (used in) operating activities 31 1,275,302 1,072,161Cash flows from investing activitiesPayments for property, infrastructure, plant and equipment (634,225) (1,788,622)Proceeds from sale of property, infrastructure, plant and equipment 605,000 95,571Investments in / (drawdowns from) term deposits (288,564) 94,405Investment revenue from water corporation 43,940 50,880Capital grants (inclusive of GST) - 269,335Capital grants repaid (inclusive of GST) - (170,000)Net cash provided by (used in) investing activities (273,849) (1,448,431)Cash flows from financing activitiesFinance costs (51,770) (57,773)Trust funds and deposits (21,181) (5,817)Proceeds from interest bearing loans and borrowings 217,774 (108,143)Repayment of interest bearing loans and borrowings - -Net cash provided by (used in) financing activities 144,823 (171,733)Net increase (decrease) in cash and cash equivalents 1,146,276 (548,003)Cash and cash equivalents at the beginning of the financial year 419,246 967,249Cash and cash equivalents at the end of the financial year 32 1,565,522 419,246Financing arrangements 33Restrictions on cash assets 35The above statement should be read with the accompanying notes.5