Aging in Hingham - Town of Hingham Massachusetts
Aging in Hingham - Town of Hingham Massachusetts
Aging in Hingham - Town of Hingham Massachusetts

Create successful ePaper yourself
Turn your PDF publications into a flip-book with our unique Google optimized e-Paper software.
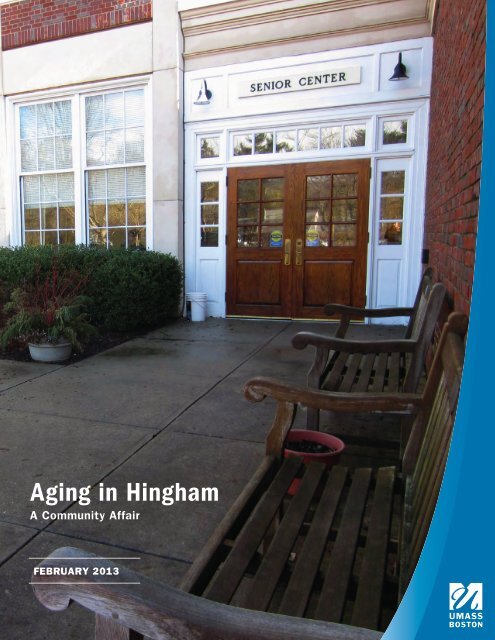
<strong>Ag<strong>in</strong>g</strong> <strong>in</strong> H<strong>in</strong>gham: A Community AffairCommissioned by the <strong>Town</strong> <strong>of</strong> H<strong>in</strong>ghamDepartment <strong>of</strong> Elder ServicesBarbara Farnsworth, DirectorFebruary 2013Jan E. Mutchler, PhDCaitl<strong>in</strong> Coyle, MSHayley Gravette, MSWCenter for Social & Demographic Research <strong>in</strong> <strong>Ag<strong>in</strong>g</strong>Gerontology InstituteJohn W. McCormack Graduate School <strong>of</strong> Policy & Global StudiesUniversity <strong>of</strong> <strong>Massachusetts</strong> Boston
January 31, 2013Dear Citizens <strong>of</strong> H<strong>in</strong>gham,On behalf <strong>of</strong> the Department <strong>of</strong> Elder Services, I am pleased to present the f<strong>in</strong>d<strong>in</strong>gs <strong>of</strong> the“Needs Assessment Study” that was <strong>in</strong>tended to be proactive <strong>in</strong> obta<strong>in</strong><strong>in</strong>g basicdemographic data along with a comprehensive pr<strong>of</strong>ile <strong>of</strong> Baby Boomers and Seniors <strong>in</strong>H<strong>in</strong>gham. The impetus for this project grew out <strong>of</strong> the self-assessment process that wasconducted <strong>in</strong> preparation for our 2012 application for National Senior Center Accreditationthrough the National Institute <strong>of</strong> Senior Centers.In 2007, the Department <strong>of</strong> Elder Services was awarded National Senior CenterAccreditation for a five year period. In 2011, we began the process to reta<strong>in</strong> thisAccreditation which <strong>in</strong>volved a self-assessment based on national standards and criteria.To accomplish this task, a Self-Assessment Committee comprised <strong>of</strong> Council on <strong>Ag<strong>in</strong>g</strong>members, staff, other <strong>Town</strong> <strong>of</strong>ficials, representatives from various community agencies,and <strong>in</strong>terested citizens was formed. Dur<strong>in</strong>g the self-assessment process, we identifiedweaknesses with<strong>in</strong> our current plann<strong>in</strong>g document and the need to develop acomprehensive strategic plan that would better meet the social and human service needs <strong>of</strong>H<strong>in</strong>gham’s grow<strong>in</strong>g adult population as identified <strong>in</strong> the 2010 US Census.Follow<strong>in</strong>g the completion <strong>of</strong> the self-assessment process, the Council on <strong>Ag<strong>in</strong>g</strong> (theadvisory body to the Department <strong>of</strong> Elder Services) decided that the first step <strong>in</strong> thedevelopment <strong>of</strong> a strategic plan was to obta<strong>in</strong> basic demographic data along with acomprehensive pr<strong>of</strong>ile <strong>of</strong> H<strong>in</strong>gham residents 45 and older. In the spr<strong>in</strong>g <strong>of</strong> 2012, theGerontology Institute at the University <strong>of</strong> <strong>Massachusetts</strong> Boston was commissioned toconduct a “Needs Assessment Study” with the f<strong>in</strong>d<strong>in</strong>gs culm<strong>in</strong>ated <strong>in</strong>to a f<strong>in</strong>al report. Theresults will help us to identify the underserved and the unmet needs and <strong>in</strong>sure that weprovide the social and human services.
Where do we go from here?The study will aid the Department <strong>of</strong> Elder Services <strong>in</strong> sett<strong>in</strong>g priorities, develop<strong>in</strong>g a planthat <strong>in</strong>cludes viable options, and implement<strong>in</strong>g specific strategies based on the data. Thisplan will affect both short and long term plann<strong>in</strong>g related to services, programm<strong>in</strong>g, space,staff<strong>in</strong>g, budget<strong>in</strong>g, outreach and public relations.There were various themes identified by the survey that not only have implications for theDepartment <strong>of</strong> Elder Services but for other <strong>Town</strong> services as well. The <strong>in</strong>crease <strong>in</strong> the ag<strong>in</strong>gpopulation and demand for services <strong>in</strong> the next decade are <strong>of</strong> great concern. Provid<strong>in</strong>gtransportation options <strong>in</strong> H<strong>in</strong>gham with its geographically widespread area will rema<strong>in</strong> atop priority. There was a demonstrated commitment among respondents to rema<strong>in</strong> liv<strong>in</strong>g<strong>in</strong> H<strong>in</strong>gham for as long as possible. However, there was trepidation among respondents <strong>of</strong>all ages regard<strong>in</strong>g the affordability <strong>of</strong> their homes and the ability to ma<strong>in</strong>ta<strong>in</strong> their homes.Many Seniors and Boomers reported that they knew very little about the services providedby the Department <strong>of</strong> Elder Services. The study also <strong>in</strong>dicated that participat<strong>in</strong>g <strong>in</strong>caregiv<strong>in</strong>g activities while meet<strong>in</strong>g other work and family responsibilities was “very” or“somewhat” difficult for Senior and Boomer caregivers. This <strong>in</strong>formation provides us notonly with challenges but also with opportunities on how to best plan for future programsand services as identified <strong>in</strong> this study.At the present time the Department <strong>of</strong> Elder Services is operat<strong>in</strong>g with the same number <strong>of</strong>staff we had <strong>in</strong> place 15 years ago and <strong>in</strong> the same location. We have witnessed growth <strong>in</strong>programs. Participation <strong>in</strong> some Senior Center programs is limited because <strong>of</strong> physicalspace constra<strong>in</strong>ts. Our Outreach Program has grown and more <strong>in</strong>dividuals are seek<strong>in</strong>gassistance and <strong>in</strong>formation about the decisions that they must make regard<strong>in</strong>g medical<strong>in</strong>surance and other f<strong>in</strong>ancial benefits. These programs and others are now more complexbecause <strong>of</strong> changes <strong>in</strong> operational regulations <strong>in</strong> federal and state programs. We are greatlyconcerned about the imm<strong>in</strong>ent <strong>in</strong>flux <strong>of</strong> new Seniors need<strong>in</strong>g services, especially ifenhanced outreach efforts <strong>in</strong>crease the number <strong>of</strong> people com<strong>in</strong>g through the doors. Willwe have the resources or capacity to preserve vital services and adequately meet thegrow<strong>in</strong>g needs? Are we ready for the chang<strong>in</strong>g needs and preferences <strong>of</strong> the BabyBoomers? Our efforts to provide service may be cont<strong>in</strong>gent upon town, state and federalbudgetary constra<strong>in</strong>ts. These fluctuations and limitations will most certa<strong>in</strong>ly have animpact on what we are able to do at the local level both at the Department <strong>of</strong> Elder Servicesand complimentary <strong>Town</strong> services.Although we face many challenges we are confident <strong>in</strong> the knowledge that we have ga<strong>in</strong>edfrom the needs assessment study and will move forward <strong>in</strong> a positive and productivedirection. This survey is a tool that will greatly help us <strong>in</strong> creat<strong>in</strong>g a vision for the futureand allow us to evolve and rema<strong>in</strong> relevant <strong>in</strong> the community.
Executive SummaryIntroductionThe purpose <strong>of</strong> this needs assessment is to <strong>in</strong>vestigate the needs, <strong>in</strong>terests, and op<strong>in</strong>ions <strong>of</strong>mature residents <strong>of</strong> H<strong>in</strong>gham, <strong>Massachusetts</strong>, relat<strong>in</strong>g to their ag<strong>in</strong>g experiences and needsfor age-related services. This assessment was undertaken by the Gerontology Institute <strong>of</strong> theMcCormack Graduate School at UMass Boston on behalf <strong>of</strong> the <strong>Town</strong> <strong>of</strong> H<strong>in</strong>ghamDepartment <strong>of</strong> Elder Services (here<strong>in</strong>after referred to as the Department <strong>of</strong> Elder Services).The focus <strong>of</strong> this report is on H<strong>in</strong>gham residents aged 60+ (referred to here as “Seniors”)and residents aged 45-59 (referred to here as “Boomers”). Information about these two agegroups was obta<strong>in</strong>ed both through the U.S. Census Bureau, and through a sample surveydesigned and conducted <strong>in</strong> support <strong>of</strong> this project. Two focus groups were conducted toobta<strong>in</strong> feedback on the survey results and generate recommendations. Key <strong>in</strong>formant<strong>in</strong>terviews with six <strong>Town</strong> <strong>of</strong>ficials and community leaders were conducted to provide expert<strong>in</strong>put on the implications <strong>of</strong> the ag<strong>in</strong>g population for the <strong>Town</strong> as a whole, and thefunction<strong>in</strong>g <strong>of</strong> the Department <strong>of</strong> Elder Services. The content <strong>of</strong> this report is <strong>in</strong>tended to beuseful to the Department <strong>of</strong> Elder Services, other <strong>Town</strong> <strong>of</strong>fices, and organizations thatprovide services with<strong>in</strong> H<strong>in</strong>gham, advocates, and community members.ResultsH<strong>in</strong>gham <strong>in</strong>cludes more than 22,000 residents, many <strong>of</strong> whom are part <strong>of</strong> the large andgrow<strong>in</strong>g Boomer and Senior populations. The 2010 Census <strong>in</strong>dicates that 5,735 H<strong>in</strong>ghamresidents are aged 60 and over, represent<strong>in</strong>g 26% <strong>of</strong> the H<strong>in</strong>gham population. Another5,139 residents (23%) are aged 45 to 59, poised to move <strong>in</strong>to later life with<strong>in</strong> the com<strong>in</strong>gdecade. H<strong>in</strong>gham has also experienced strong growth <strong>of</strong> its older population <strong>in</strong> recentdecades. Between 2000 and 2010, the number <strong>of</strong> H<strong>in</strong>gham residents aged 60 and overrose from 3,700 to 5,735 (an <strong>in</strong>crease <strong>of</strong> 55%), and the number <strong>of</strong> H<strong>in</strong>gham residents aged45-59 grew from 4,575 to 5,139 (an <strong>in</strong>crease <strong>of</strong> 12%). Over the next ten years, the ag<strong>in</strong>g <strong>of</strong>the Boomer cohort will cont<strong>in</strong>ue to swell the size <strong>of</strong> the 60+ population <strong>in</strong> H<strong>in</strong>gham.Data from the American Community Survey suggests that the older population represents asubstantial presence with<strong>in</strong> H<strong>in</strong>gham, with 46% <strong>of</strong> households <strong>in</strong>clud<strong>in</strong>g at least one personaged 60 or older. One-third <strong>of</strong> H<strong>in</strong>gham’s residents aged 65 and over live alone, and morethan half <strong>of</strong> these <strong>in</strong>dividuals are homeowners. Although a sizable share <strong>of</strong> H<strong>in</strong>gham’shouseholds report relatively high <strong>in</strong>comes, many H<strong>in</strong>gham Seniors experience a comparativeeconomic disadvantage. The median household <strong>in</strong>come for residents who are aged 65 andover is less than half that <strong>of</strong> younger households. Many seniors also experience some level<strong>of</strong> disability, which may impact their ability to function well and <strong>in</strong>dependently <strong>in</strong> thecommunity. More than one-third <strong>of</strong> H<strong>in</strong>gham’s residents aged 75 and over report a disability.4
Results from the H<strong>in</strong>gham community survey suggest that most Boomer and Seniorresidents have lived <strong>in</strong> H<strong>in</strong>gham for many years, although L<strong>in</strong>den Ponds and Allerton Houseattract some seniors from outside <strong>of</strong> H<strong>in</strong>gham, with the result that a sizable share <strong>of</strong> theoldest-old Seniors (aged 80 or more) are relatively new to the community. Across the board,Seniors and Boomers are highly committed to rema<strong>in</strong><strong>in</strong>g <strong>in</strong> H<strong>in</strong>gham as they grow older. Yetsome challenges to successfully ag<strong>in</strong>g <strong>in</strong> place are reported. Most survey respondents areactively engaged <strong>in</strong> social activities and enjoy good support from their social networks.Good health is common, with more than 60% <strong>of</strong> the Boomers and 30% <strong>of</strong> the Seniorsreport<strong>in</strong>g excellent health. Although most respondents <strong>in</strong> both age groups report that theyare rarely depressed, approximately 5% <strong>of</strong> the respondents report feel<strong>in</strong>g this way "<strong>of</strong>ten" or"always." Consistent with the good health shared by most <strong>of</strong> the respondents to thecommunity survey, relatively few report needs for assistance with daily activities. A largershare reports need<strong>in</strong>g help with household activities such as do<strong>in</strong>g rout<strong>in</strong>e householdchores, especially among those aged 80 and older. Among those who need support, nearlyall report receiv<strong>in</strong>g it, and a large number <strong>of</strong> the recipients pay for these services. Manyrespondents report provid<strong>in</strong>g unpaid care or assistance to a disabled, ill, or elderly spouse,relative or friend. Provid<strong>in</strong>g caregiv<strong>in</strong>g activities while meet<strong>in</strong>g other work and familyresponsibilities is described as very or somewhat difficult by most <strong>of</strong> the Boomers and onethird<strong>of</strong> the Seniors.Driv<strong>in</strong>g and transportation concerns are key issues <strong>in</strong> H<strong>in</strong>gham. The vast majority <strong>of</strong> thecommunity survey respondents drive, and driv<strong>in</strong>g themselves is the primary form <strong>of</strong>transportation used by most. Most Boomers drive themselves without modification, but asizable share <strong>of</strong> Seniors modify their driv<strong>in</strong>g to some extent, by avoid<strong>in</strong>g driv<strong>in</strong>g at night,avoid<strong>in</strong>g driv<strong>in</strong>g <strong>in</strong> bad weather, or other adaptations to driv<strong>in</strong>g behavior. Nearly threequarters<strong>of</strong> the respondents are aware that the Department <strong>of</strong> Elder Services providestransportation services, but very few report hav<strong>in</strong>g used these services. About one-quarter<strong>of</strong> non-drivers have used Elder Services transportation over the past 6 months; half <strong>of</strong> thedrivers who responded report that they would use this service if they could not drive <strong>in</strong> thefuture. If unable to drive <strong>in</strong> the future, most respondents <strong>in</strong>dicate that they would rely onfamily members, friends, or neighbors, with one-third or less be<strong>in</strong>g will<strong>in</strong>g to use The Ride,public transportation or taxi.The Department <strong>of</strong> Elder Services <strong>of</strong>fers a wide range <strong>of</strong> services and programs, many <strong>of</strong>which generate high participation levels. Usage statistics collected by the Senior Centersuggest that as many as one-third <strong>of</strong> H<strong>in</strong>gham Seniors participated <strong>in</strong> Senior Centeractivities dur<strong>in</strong>g FY 2012, a figure that aligns well with community survey f<strong>in</strong>d<strong>in</strong>gs, whichshow that 35% <strong>of</strong> Seniors report participat<strong>in</strong>g <strong>in</strong> Senior Center programs. Participation levelsare higher among older Seniors who do not live <strong>in</strong> one <strong>of</strong> the residential communities thatprovide services and programs, such as L<strong>in</strong>den Ponds. Expanded service demandsassociated with growth <strong>of</strong> the older population may soon exceed available programm<strong>in</strong>gspace and park<strong>in</strong>g, which are already deemed <strong>in</strong>adequate by some participants <strong>in</strong> the study.Programs associated with the largest usage <strong>in</strong> FY 2012 are fitness/exercise programs,social activities, and transportation. In the community survey, respondents were asked toevaluate Senior Center programs <strong>in</strong> terms <strong>of</strong> their importance; fitness classes andrecreational programs were rated most positively by Seniors and Boomers, withtransportation services not far beh<strong>in</strong>d. Few respondents reported any difficulties access<strong>in</strong>g5
Senior Center programs. However, 18% <strong>of</strong> Seniors report lack <strong>of</strong> park<strong>in</strong>g as a challenge, and8% report not know<strong>in</strong>g what is available as a problem. Segments <strong>of</strong> the older populationlack familiarity with the Senior Center. Forty-four percent <strong>of</strong> the Seniors and 83% <strong>of</strong> theBoomers report that they know "very little" about H<strong>in</strong>gham Senior Center programm<strong>in</strong>g.However, among the Seniors most likely to use the Senior Center—those aged 70 and olderwho do not live <strong>in</strong> L<strong>in</strong>den Ponds or Allerton House—knowledge is good.Look<strong>in</strong>g ahead to the future, respondents voice a number <strong>of</strong> concerns as they age <strong>in</strong> place.Many respondents are concerned about the high cost <strong>of</strong> liv<strong>in</strong>g <strong>in</strong> H<strong>in</strong>gham, and whetherlimited retirement funds will stretch to meet expenses. A sizable number <strong>of</strong> respondentsexpress concern that transportation options will be unavailable or <strong>in</strong>adequate if they areunable to drive <strong>in</strong> the future. A strong desire to rema<strong>in</strong> active and engaged with socialnetworks and community activities is expressed by many, along with concerns thatopportunities to do so may be restricted by disability, transportation impediments, or thelack <strong>of</strong> programs for seniors. A strong desire to rema<strong>in</strong> <strong>in</strong>dependent is expressed by many,tempered by concerns that they may face challenges <strong>in</strong> ma<strong>in</strong>ta<strong>in</strong><strong>in</strong>g their homes andproperty.Information from two focus groups held to review prelim<strong>in</strong>ary results from the demographicand survey analyses highlight conclusions drawn from the community survey. One focusgroup was composed <strong>of</strong> representatives from a variety <strong>of</strong> community organizations. Thisgroup described a collaborative and positive relationship between their organizations andthe Department <strong>of</strong> Elder Services. Participants highlight transportation issues as keyconcerns for older residents, po<strong>in</strong>t<strong>in</strong>g out that a lack <strong>of</strong> transportation can lead to socialisolation and form a barrier to obta<strong>in</strong><strong>in</strong>g needed services. Caregiv<strong>in</strong>g was also mentioned asan important issue by this group, and cited as an issue on which the Senior Center canexercise leadership for the community. Other issues discussed <strong>in</strong>clude the need foraffordable hous<strong>in</strong>g, stigma associated with ask<strong>in</strong>g for and accept<strong>in</strong>g help, and theimportance <strong>of</strong> strong market<strong>in</strong>g <strong>of</strong> Senior Center services and programs.The second focus group was composed <strong>of</strong> community members aged 45 and over. Members<strong>of</strong> this group commented favorably on the Senior Center’s publicity efforts, and suggestedthat expand<strong>in</strong>g <strong>in</strong>to social media may be a vehicle for rais<strong>in</strong>g awareness among Boomers aswell as many Seniors who may have <strong>in</strong>sufficient awareness. This group also mentioned thechallenge <strong>of</strong> provid<strong>in</strong>g adequate transportation options, and cited especially the need formore paid drivers through the Senior Center. Mak<strong>in</strong>g a strong case for the value <strong>of</strong> a strongSenior Center for the community at large was recommended by this group.Interviews were conducted with six representatives from <strong>Town</strong> <strong>of</strong>fices and organizations.Each person <strong>in</strong>terviewed described ways <strong>in</strong> which the older population shapes the work thatthey do. All <strong>in</strong>terviewees acknowledged that economic challenges and transportationbarriers are key issues fac<strong>in</strong>g H<strong>in</strong>gham’s Seniors. These <strong>in</strong>dividuals described numerousways <strong>in</strong> which <strong>Town</strong> <strong>of</strong>fices and organizations work effectively together to support the olderpopulation. As well, they described collaborative and effective work<strong>in</strong>g relationships withthe Department <strong>of</strong> Elder Services. Accord<strong>in</strong>g to these community leaders, Elder Services iswell known and has mean<strong>in</strong>gful impact with<strong>in</strong> the community. They reported that theDepartment <strong>of</strong> Elder Services plays a valued leadership role <strong>in</strong> address<strong>in</strong>g the issues and6
AcknowledgementsThe authors gratefully acknowledge the contributions <strong>of</strong> the <strong>Town</strong> <strong>of</strong> H<strong>in</strong>gham Department <strong>of</strong>Elder Services. Barbara Farnsworth, Director <strong>of</strong> Elder Services, the Council on <strong>Ag<strong>in</strong>g</strong> LongRange Plann<strong>in</strong>g Committee and the full Council on <strong>Ag<strong>in</strong>g</strong> provided valued leadership <strong>in</strong>def<strong>in</strong><strong>in</strong>g the scope and focus <strong>of</strong> the project. Collectively they collaborated with theresearchers to br<strong>in</strong>g the project to a successful conclusion, help<strong>in</strong>g to identify key researchquestions, secure fund<strong>in</strong>g, and determ<strong>in</strong>e the content <strong>of</strong> the community survey.We thank the H<strong>in</strong>gham Department <strong>of</strong> Elder Services and the <strong>Massachusetts</strong> ExecutiveOffice <strong>of</strong> Elder Affairs for their f<strong>in</strong>ancial support <strong>of</strong> the project.We appreciate the contributions and <strong>in</strong>sights <strong>of</strong> the many <strong>Town</strong> <strong>of</strong>ficials and communitymembers who participated <strong>in</strong> <strong>in</strong>terviews and focus groups. We especially thank the manyresidents <strong>of</strong> H<strong>in</strong>gham who completed a survey <strong>in</strong> support <strong>of</strong> our data collection.Jan Mutchler, Caitl<strong>in</strong> Coyle, and Hayley Gravette, from the Gerontology Department &Institute, University <strong>of</strong> <strong>Massachusetts</strong> Boston, are responsible for the contents <strong>of</strong> this report.COUNCIL ON AGINGGretchen CondonEdward FordJune FreedmanLeah GodfreyChrisanne Gregoire, ChairmanJoan Iov<strong>in</strong>oNorma JacksonArthur LeMayDick PonteBeth RouleauPhotography by Kate Richardson.8
Table <strong>of</strong> ContentsI. Introduction ...................................................................................................................... 10II. Background ...................................................................................................................... 10III. Methodology ..................................................................................................................... 13IV. Results .............................................................................................................................. 16Demographic results from Census 2010 ....................................................................... 16Social and Economic Results from the American Community Survey ......................... 21Results from the H<strong>in</strong>gham Community Survey <strong>of</strong> Boomers and Seniors ..................... 26Results from the Focus Groups ...................................................................................... 48Results from the Key Informant Interviews .................................................................... 50V. Summary and Recommendations .................................................................................. 53VI. References ....................................................................................................................... 54VII. Appendices ....................................................................................................................... 55Appendix A: Community Survey ....................................................................................... 56Appendix B: Detailed tables from the H<strong>in</strong>gham community survey ............................. 649
I. Introduction<strong>Ag<strong>in</strong>g</strong> <strong>in</strong> H<strong>in</strong>gham: A Community AffairThe purpose <strong>of</strong> this needs assessment is to <strong>in</strong>vestigate the needs, <strong>in</strong>terests, and op<strong>in</strong>ions <strong>of</strong>mature residents <strong>of</strong> H<strong>in</strong>gham, <strong>Massachusetts</strong>, relat<strong>in</strong>g to their ag<strong>in</strong>g experiences and needsfor age-related services. This assessment was undertaken by the Gerontology Institute <strong>of</strong>the McCormack Graduate School at UMass Boston on behalf <strong>of</strong> the <strong>Town</strong> <strong>of</strong> H<strong>in</strong>ghamDepartment <strong>of</strong> Elder Services (hereafter referred to as the Department <strong>of</strong> Elder Services).The Department <strong>of</strong> Elder Services is a human service department with<strong>in</strong> the <strong>Town</strong>, andserves as a resource to H<strong>in</strong>gham’s Senior population, facilitat<strong>in</strong>g the delivery <strong>of</strong> services andactivities. This project:develops a demographic pr<strong>of</strong>ile <strong>of</strong> the population <strong>of</strong> H<strong>in</strong>gham, focus<strong>in</strong>g especially onthe resident population aged 45-59 and aged 60 and over, based on data from theU.S. Census Bureau, <strong>in</strong>clud<strong>in</strong>g the 2010 Census <strong>of</strong> Population and recent data fromthe American Community Survey;develops orig<strong>in</strong>al data drawn from a sample <strong>of</strong> adults aged 45+, regard<strong>in</strong>g theirhous<strong>in</strong>g, health, service use, and transportation needs;identifies community members’ concerns relat<strong>in</strong>g to ag<strong>in</strong>g <strong>in</strong> H<strong>in</strong>gham, and theirideas for ways <strong>in</strong> which the quality <strong>of</strong> life could be improved for older <strong>in</strong>dividuals liv<strong>in</strong>g<strong>in</strong> the community; andsummarizes <strong>in</strong>put from key <strong>in</strong>formants, <strong>in</strong>clud<strong>in</strong>g <strong>Town</strong> <strong>of</strong>ficials and communityleaders, about the implications <strong>of</strong> the ag<strong>in</strong>g population for the <strong>Town</strong> as a whole, andthe function<strong>in</strong>g <strong>of</strong> Elder Services.The content <strong>of</strong> this report is <strong>in</strong>tended to be useful to the Department <strong>of</strong> Elder Services, other<strong>Town</strong> <strong>of</strong>fices, organizations that provide services with<strong>in</strong> H<strong>in</strong>gham, advocates, andcommunity members.II.BackgroundH<strong>in</strong>gham is a community <strong>of</strong> more than 22,000 residents on the South Shore <strong>of</strong><strong>Massachusetts</strong>. Similar to other communities throughout the country, H<strong>in</strong>gham isexperienc<strong>in</strong>g a surge <strong>in</strong> its population aged 60+ as the so-called Baby Boomers (those bornbetween 1946 and 1964) age <strong>in</strong>to later life (V<strong>in</strong>cent and Velk<strong>of</strong>f 2010). A sizable researchliterature demonstrates that circumstances common with<strong>in</strong> older populations‒such asphysical mobility difficulties, economic and social losses, and cognitive decl<strong>in</strong>es‒placeunique demands on community resources. Inasmuch as many <strong>of</strong> the services required byolder populations are provided either publicly or through public-private partnerships,municipalities are f<strong>in</strong>d<strong>in</strong>g it necessary to adapt quickly to chang<strong>in</strong>g age pr<strong>of</strong>iles with<strong>in</strong> theirpopulations. The Department <strong>of</strong> Elder Services is plann<strong>in</strong>g for the expected expansion <strong>of</strong> itsolder population by learn<strong>in</strong>g more about the current and expected needs and experiences <strong>of</strong>its mature population.10
“<strong>Ag<strong>in</strong>g</strong> <strong>in</strong> place” is a commonly voiced goal among seniors. This term implies rema<strong>in</strong><strong>in</strong>g <strong>in</strong>familiar community sett<strong>in</strong>gs, with supports as needed, as opposed to <strong>in</strong>stitutional liv<strong>in</strong>gsituations (Salomon 2010). By ag<strong>in</strong>g <strong>in</strong> place, seniors are able to reta<strong>in</strong> their <strong>in</strong>dependence,as well as ma<strong>in</strong>ta<strong>in</strong> valued social relationships and community <strong>in</strong>volvements. In turn, ag<strong>in</strong>g<strong>in</strong> place may promote “successful ag<strong>in</strong>g,” <strong>in</strong>clud<strong>in</strong>g lower<strong>in</strong>g risks <strong>of</strong> chronic disease anddisabl<strong>in</strong>g conditions. By tak<strong>in</strong>g steps to support seniors’ goals <strong>in</strong> terms <strong>of</strong> successful ag<strong>in</strong>gand ag<strong>in</strong>g <strong>in</strong> place, a community may reta<strong>in</strong> a larger share <strong>of</strong> its older population and benefitfrom the experience and community commitment that long-term residents <strong>of</strong>fer, whilereduc<strong>in</strong>g potential resource demands associated with frailty and dependence.Our approach to assess<strong>in</strong>g the ag<strong>in</strong>g-related needs <strong>of</strong> H<strong>in</strong>gham’s residents aligns withefforts to identify ways <strong>in</strong> which communities may become more "livable": features that allowseniors "to ma<strong>in</strong>ta<strong>in</strong> their <strong>in</strong>dependence and quality <strong>of</strong> life as they age and retire" (Nelsonand Guengerich 2009). Key components <strong>of</strong> livability <strong>in</strong>clude:availability and affordability <strong>of</strong> hous<strong>in</strong>g suitable for ag<strong>in</strong>g <strong>in</strong> place;transportation options that allow <strong>in</strong>dividuals to ma<strong>in</strong>ta<strong>in</strong> social ties, obta<strong>in</strong> neededgoods and services, access community amenities and be engaged with theircommunities; andavailability <strong>of</strong> community features and services that meet people’s evolv<strong>in</strong>g needs,<strong>in</strong>clud<strong>in</strong>g home and community-based long-term care services (AARP 2005).Hous<strong>in</strong>g is a key factor shap<strong>in</strong>g the ability <strong>of</strong> community residents to age <strong>in</strong> place. Nationalstudies suggest that most older adults would prefer to rema<strong>in</strong> <strong>in</strong> their exist<strong>in</strong>g homes as longas possible (AARP 2005). A home serves not only as a source <strong>of</strong> shelter, but also as theplatform for ma<strong>in</strong>ta<strong>in</strong><strong>in</strong>g social networks and connect<strong>in</strong>g residents to neighborhoodamenities. Hold<strong>in</strong>g long-last<strong>in</strong>g memories, <strong>of</strong>ten developed over many years, the attachmentto one’s home is <strong>of</strong>ten substantial. As well, homeownership represents one <strong>of</strong> the mostsignificant sources <strong>of</strong> wealth for most seniors. Yet over time, the “fit” between residents andtheir homes may weaken. A home may become too large for current needs, or may becometoo cumbersome or expensive to ma<strong>in</strong>ta<strong>in</strong> on a fixed <strong>in</strong>come. Design <strong>of</strong> the home, such asthe number <strong>of</strong> stories and manageability <strong>of</strong> stairs, may challenge an older resident’s abilityto stay. Even for <strong>in</strong>dividuals who no longer are pay<strong>in</strong>g <strong>of</strong>f a mortgage, the expenseassociated with property taxes, <strong>in</strong>surance, and rout<strong>in</strong>e upkeep may exceed availableresources. Home modifications, such as the <strong>in</strong>stallation <strong>of</strong> bathroom bars, ramps, or firstfloorbathrooms, may support resident safety and facilitate ag<strong>in</strong>g <strong>in</strong> place. However, some<strong>in</strong>dividuals will need to change residences <strong>in</strong> later life. The availability <strong>of</strong> affordable hous<strong>in</strong>goptions, especially those with universal design features, and hous<strong>in</strong>g that blends shelter andservice, such as assisted liv<strong>in</strong>g or cont<strong>in</strong>u<strong>in</strong>g care retirement communities, may allow aresident who is no longer able to stay <strong>in</strong> his or her exist<strong>in</strong>g home to rema<strong>in</strong> <strong>in</strong> the community(AARP 2005). Communities may facilitate ag<strong>in</strong>g <strong>in</strong> place by mak<strong>in</strong>g residents aware <strong>of</strong> homebasedservices for which they may be eligible, <strong>in</strong>clud<strong>in</strong>g services that would help ma<strong>in</strong>ta<strong>in</strong>and modify a home for safe liv<strong>in</strong>g, and programs that may help them pay utility or otherhome-related expenses. As well, communities may plan for the residence needs <strong>of</strong> theirag<strong>in</strong>g populations by promot<strong>in</strong>g the development <strong>of</strong> affordable hous<strong>in</strong>g that is seniorfriendly.11
Transportation options shape the extent to which older residents are able to rema<strong>in</strong>connected to their social networks, <strong>in</strong>volved <strong>in</strong> their communities, and able to accessneeded goods and services. The vast majority <strong>of</strong> Americans rely primarily on privatetransportation to meet these needs, and most <strong>in</strong>dividuals drive their own privateautomobiles well <strong>in</strong>to old age. The attachment <strong>of</strong> Americans to their automobiles is afunction both <strong>of</strong> the association <strong>of</strong> driv<strong>in</strong>g with <strong>in</strong>dependence and autonomy, and the limitedalternatives that are available. Many communities have few public transportation options,and those that do exist may be <strong>in</strong>convenient, expensive, or unreliable. Individuals withhealth conditions that adversely affect their ability to drive safely may be unable toparticipate <strong>in</strong> activities they previously enjoyed. Indeed, a national survey <strong>of</strong> people aged 50and over conducted by the AARP (2005) f<strong>in</strong>ds that non-drivers report lower quality <strong>of</strong> life,less <strong>in</strong>volvement with other people, and more isolation than do drivers. By provid<strong>in</strong>g highquality, reliable and convenient travel options, communities may promote quality <strong>of</strong> life andcommunity engagement for those seniors and other community members who are unable todrive safely, or who prefer public transportation alternatives.Community features and services that respond to people’s evolv<strong>in</strong>g needs, <strong>in</strong>clud<strong>in</strong>g homeand community-based long-term care services, further def<strong>in</strong>e the “liveability” <strong>of</strong> a communityfor older residents. Medical and social services that can be easily accessed or delivered <strong>in</strong>homeare needed by seniors who have mobility limitations, as well as by residents whoexperience challenges with transportation. Programs that connect seniors with affordableassistance for ma<strong>in</strong>ta<strong>in</strong><strong>in</strong>g their homes and their yards can help protect seniors’<strong>in</strong>vestments and ma<strong>in</strong>ta<strong>in</strong> their neighborhoods. Safe and walkable shopp<strong>in</strong>g andenterta<strong>in</strong>ment districts are valued by all age groups, but may be especially helpful for thosewith mobility and transportation limitations. Provid<strong>in</strong>g opportunities for social engagement —through volunteer programs, opportunities to take classes or participate <strong>in</strong> exerciseprograms, or social activities—can help community members ma<strong>in</strong>ta<strong>in</strong> social support andrema<strong>in</strong> active. National research has demonstrated that social support is key to well-be<strong>in</strong>g<strong>in</strong> later life, and that cont<strong>in</strong>ued engagement <strong>in</strong> social and community activities promotessuccessful ag<strong>in</strong>g. In H<strong>in</strong>gham, as <strong>in</strong> many communities, the Department <strong>of</strong> Elder Servicesprovides leadership <strong>in</strong> identify<strong>in</strong>g and promot<strong>in</strong>g community features and services thatrespond to seniors’ evolv<strong>in</strong>g needs, <strong>in</strong>clud<strong>in</strong>g programs and services <strong>of</strong>fered through itsSenior Center. National research has l<strong>in</strong>ked participation <strong>in</strong> senior centers to healthbenefits, reduced social isolation, and <strong>in</strong>creased life satisfaction (Pardasani and Thompson2012).This report assembles <strong>in</strong>formation from a number <strong>of</strong> sources, designed to address aspects<strong>of</strong> these issues with respect to the needs <strong>of</strong> the ag<strong>in</strong>g population <strong>in</strong> H<strong>in</strong>gham. Alsopresented is a pr<strong>of</strong>ile <strong>of</strong> the characteristics and resources <strong>of</strong> the current population <strong>of</strong>H<strong>in</strong>gham, those who are at and approach<strong>in</strong>g later life (the 60+ population) as well as thosewho will be mov<strong>in</strong>g <strong>in</strong>to later life over the next few decades (the 45-59 population).Knowledge <strong>of</strong> these characteristics provides an important basis for plann<strong>in</strong>g, for theDepartment <strong>of</strong> Elder Services as well as for other <strong>Town</strong> <strong>of</strong>fices and nonpr<strong>of</strong>it agencies with<strong>in</strong>the community.12
III.MethodologyNeeds assessments are common vehicles through which research efforts may contribute toplann<strong>in</strong>g activities on the part <strong>of</strong> communities and organizations (Nol<strong>in</strong> et al. 2006). Datafrom many different sources may be usefully applied to the development <strong>of</strong> a needsassessment. Our approach <strong>in</strong> the current project is to compile data from the U.S. CensusBureau, along with quantitative and qualitative data from H<strong>in</strong>gham residents and key<strong>in</strong>formants. The primary research tool used <strong>in</strong> this project is a mail survey distributed to asample <strong>of</strong> H<strong>in</strong>gham residents aged 45 and over. Information obta<strong>in</strong>ed through this survey,along with publicly available <strong>in</strong>formation obta<strong>in</strong>ed through the U.S. Census Bureau, is usedto generate a pr<strong>of</strong>ile <strong>of</strong> the older population <strong>in</strong> H<strong>in</strong>gham. The goal is to help the Department<strong>of</strong> Elder Services understand the support needs <strong>of</strong> the ag<strong>in</strong>g population <strong>of</strong> H<strong>in</strong>gham, andidentify the services <strong>of</strong>fered by the Department <strong>of</strong> Elder Services that are most valued byH<strong>in</strong>gham residents. All aspects <strong>of</strong> the data collection received approval through theUniversity <strong>of</strong> <strong>Massachusetts</strong> Boston Institutional Review Board.H<strong>in</strong>gham demographic analysisA demographic pr<strong>of</strong>ile <strong>of</strong> H<strong>in</strong>gham is generated, focus<strong>in</strong>g especially on characteristics <strong>of</strong> theBoomer and Senior populations. Data from the 2010 Census <strong>of</strong> Population and from theAmerican Community Survey (ACS) are used for this pr<strong>of</strong>ile. The ACS is a large, annualsurvey <strong>of</strong> the population, conducted by the U.S. Census Bureau. Information from the ACSfor communities the size <strong>of</strong> H<strong>in</strong>gham is reported for multi-year time periods, and covers awide range <strong>of</strong> demographic, social, and economic characteristics. The <strong>in</strong>formation used <strong>in</strong>this report is drawn primarily from the 2007-2011 American Community Survey, the mostcurrent data available.H<strong>in</strong>gham resident mailed surveySurvey DevelopmentA survey <strong>in</strong>strument, <strong>in</strong>clud<strong>in</strong>g both quantitative and open-ended questions, was developedby the research team at the Gerontology Institute, University <strong>of</strong> <strong>Massachusetts</strong> Boston, <strong>in</strong>collaboration with the Department <strong>of</strong> Elder Services. Topics were chosen based on salienceto the plann<strong>in</strong>g needs <strong>of</strong> communities as they relate to ag<strong>in</strong>g populations, and key po<strong>in</strong>ts <strong>of</strong><strong>in</strong>terest as judged by the <strong>Town</strong>. The full questionnaire is reproduced <strong>in</strong> Appendix A.Questions were asked relat<strong>in</strong>g to the follow<strong>in</strong>g themes:Hous<strong>in</strong>g characteristicsSocial activities and relationshipsCaregiv<strong>in</strong>g activities and associated burdenHealth and needs for assistanceUse <strong>of</strong> and familiarity with Elder ServicesCommunity and neighborhoodTransportation needs and useCurrent and future retirement plansSocial, demographic, and economic <strong>in</strong>formation relevant to ag<strong>in</strong>g populations13
Survey Sample SelectionMunicipal census records for the <strong>Town</strong> <strong>of</strong> H<strong>in</strong>gham were used to identify residents <strong>of</strong>H<strong>in</strong>gham aged 45 and over. A mail<strong>in</strong>g list <strong>of</strong> all town residents, <strong>in</strong>clud<strong>in</strong>g name, address,and date <strong>of</strong> birth, was obta<strong>in</strong>ed through the H<strong>in</strong>gham <strong>Town</strong> Clerk. The names andaddresses on this list were updated by the mail house service used by the Department <strong>of</strong>Elder Services (Ryan Weaver Mail<strong>in</strong>g Services). From the updated list, researchers randomlyselected a sample <strong>of</strong> 3,400 residents, or approximately 30% <strong>of</strong> the residents aged 45 andolder on the corrected address list.RecruitmentApproximately one week prior to the distribution <strong>of</strong> the questionnaire, a personallyaddressed postcard was mailed to selected respondents <strong>in</strong>vit<strong>in</strong>g their participation <strong>in</strong> thedata collection. The message on the postcard was from Barbara Farnsworth, Director <strong>of</strong>Elder Services, and was designed to make participants aware that they would receive amail<strong>in</strong>g <strong>in</strong> the com<strong>in</strong>g week. In October 2012, we distributed the questionnaireaccompanied by a cover letter signed by Barbara Farnsworth. The cover letter outl<strong>in</strong>ed thepurpose <strong>of</strong> the survey and the measures taken to protect the rights and privacy <strong>of</strong> theparticipants. Those who wished to respond to the questionnaire onl<strong>in</strong>e, rather than return<strong>in</strong>gthe questionnaire by mail, were directed to an electronic version <strong>of</strong> the questionnaire hostedon the SurveyMonkey website. UMass Boston was clearly identified <strong>in</strong> the materials as theresearch partner for the study. As an <strong>in</strong>centive for participation, respondents were entered<strong>in</strong> a draw<strong>in</strong>g for one <strong>of</strong> ten H<strong>in</strong>gham Downtown Association $50 gift cards. These gift cardswere donated <strong>in</strong> part by the H<strong>in</strong>gham Downtown Association. Identification numbers were<strong>in</strong>cluded on each questionnaire so that the researchers could monitor who was eligible forthe draw<strong>in</strong>g. The database conta<strong>in</strong><strong>in</strong>g these numbers is securely ma<strong>in</strong>ta<strong>in</strong>ed by theresearchers.Response RateDur<strong>in</strong>g October and November <strong>of</strong> 2012, a total <strong>of</strong> 749 surveys were received, result<strong>in</strong>g <strong>in</strong> anoverall response rate <strong>of</strong> 22% (see Table 1). 1 The return rate was higher for Seniors (28%)than for Boomers (15%), and was especially high for those aged 80 and older (34%). 2 Only2% <strong>of</strong> the responses were returned onl<strong>in</strong>e.1 Time and budget constra<strong>in</strong>ts precluded issu<strong>in</strong>g follow-up mail<strong>in</strong>gs as a means <strong>of</strong> <strong>in</strong>creas<strong>in</strong>g the overallresponse rate. Although our return rate is with<strong>in</strong> acceptable limits for surveys <strong>of</strong> this type, it is lower than wehad hoped for. Surveys were received <strong>in</strong> selected homes on about October 18-21. About this time, HurricaneSandy was be<strong>in</strong>g tracked on its path toward the east coast; it made landfall <strong>in</strong> the New England area onOctober 29 th . Although Sandy had limited impact on H<strong>in</strong>gham, we speculate that preparations and mediasurround<strong>in</strong>g the hurricane may have reduced participation to the survey.2 “Baby Boomers” refer to the cohort <strong>of</strong> <strong>in</strong>dividuals born follow<strong>in</strong>g World War II. In the U.S., this cohort istypically def<strong>in</strong>ed as those born between 1946 and 1964. As a result, <strong>in</strong> 2012 the Baby Boom cohort was aged48 to 66. We use the term “Boomers” <strong>in</strong> this report to refer to residents aged 45 to 59. This draws adist<strong>in</strong>ction between “Boomers” and “Seniors” (def<strong>in</strong>ed as residents age 60 and older, consistent with languageused <strong>in</strong> the Older Americans Act). As well, this approach facilitates comparison <strong>of</strong> the data presented from thecommunity survey with data drawn from the U.S. Census Bureau, which reports data for the 45-59 population,but not for those aged 48-59.14
Table 1: H<strong>in</strong>gham Community Survey Response RatesTotal Boomers SeniorsSurveys mailed 3,400 1,539 1,861Incorrect address, deceased, ormoved out <strong>of</strong> H<strong>in</strong>gham60 27 33Surveys received (basel<strong>in</strong>e) 3,340 1,512 1,828Surveys returned 749 231 518Response rate 22% 15% 28%ApproachData were entered directly <strong>in</strong>to an SPSS database (version 18.0). Most <strong>of</strong> the items on thequestionnaire were closed-ended questions. These data were analyzed us<strong>in</strong>g descriptivestatistics, <strong>in</strong>clud<strong>in</strong>g frequencies and crosstabs. Responses elicited through open-endedquestions were coded by the research staff and tabulated.All participants <strong>in</strong> the study were aged 45 and older; 69% were aged 60 or more and 19%were aged 80 or more. Although data are not available to generate precise estimates on thedemographic characteristics <strong>of</strong> all potential participants, <strong>in</strong>clud<strong>in</strong>g those who did notrespond to the survey, data from the 2010 Census suggest that 53% <strong>of</strong> the H<strong>in</strong>ghamresidents aged 45+ are aged 60 and over and 16% are aged 80+. Respondents to thecommunity survey are therefore more likely to be Seniors (as compared to Boomers),relative to the community at large.Key <strong>in</strong>formant <strong>in</strong>terviewsOne-on-one <strong>in</strong>terviews were conducted with six <strong>in</strong>dividuals who play leadership roles <strong>in</strong> thecommunity: the <strong>Town</strong> Adm<strong>in</strong>istrator; a member <strong>of</strong> the H<strong>in</strong>gham Board <strong>of</strong> Selectmen;representatives <strong>of</strong> the Police Department; the Fire Chief; the <strong>Town</strong> nurse; and arepresentative from the H<strong>in</strong>gham Interfaith Food Pantry. These <strong>in</strong>terviews focused on ways<strong>in</strong> which H<strong>in</strong>gham’s ag<strong>in</strong>g population is affect<strong>in</strong>g the community at large and other <strong>Town</strong><strong>of</strong>fices and organizations, and to provide <strong>in</strong>put on the perceived effectiveness <strong>of</strong> thecommunity <strong>in</strong> respond<strong>in</strong>g to elders’ needs.Focus groupsTwo focus groups were held <strong>in</strong> H<strong>in</strong>gham to preview the draft results from the H<strong>in</strong>gham dataanalysis and to share <strong>in</strong>sights. A goal <strong>of</strong> hold<strong>in</strong>g these focus groups was to engage <strong>in</strong> <strong>in</strong>depthdiscussion on topics relat<strong>in</strong>g to the report, and to <strong>in</strong>volve community members and<strong>Town</strong> <strong>of</strong>fices <strong>in</strong> the process <strong>of</strong> design<strong>in</strong>g the Recommendations section <strong>of</strong> the report. Onefocus group (N= 10) was composed <strong>of</strong> representatives <strong>of</strong> <strong>Town</strong> <strong>of</strong>fices and nonpr<strong>of</strong>itorganizations. The other focus group (N= 5) was composed <strong>of</strong> community members aged15
45 and older. Focus groups were held at the H<strong>in</strong>gham Senior Center <strong>in</strong> December, 2012,and were approximately 1-1/2 hours <strong>in</strong> duration.IV.ResultsDemographic results from Census 2010The 2010 Census enumerated 22,157 residents <strong>of</strong> the town <strong>of</strong> H<strong>in</strong>gham. Among theseresidents are large and grow<strong>in</strong>g Boomer and Senior populations. Accord<strong>in</strong>g to the 2010Census, 4,020 H<strong>in</strong>gham residents are aged 60-79 (18% <strong>of</strong> the H<strong>in</strong>gham population) and1,715 are aged 80 and older (8%; see Table 2). Another 5,139 residents (23%) are aged 45to 59, poised to move <strong>in</strong>to later life with<strong>in</strong> the com<strong>in</strong>g decade (U.S. Census Bureau, 2010).Compared to the Commonwealth <strong>of</strong> <strong>Massachusetts</strong> overall, a larger share <strong>of</strong> H<strong>in</strong>gham’spopulation is aged 45 or older (see Figure 1). Forty-two percent <strong>of</strong> the <strong>Massachusetts</strong>population is aged 45 or older, compared to 49% <strong>of</strong> H<strong>in</strong>gham’s population. In comparisonto surround<strong>in</strong>g communities, H<strong>in</strong>gham has a similar or slightly higher percentage <strong>of</strong> itspopulation aged 45+. Cohasset, Norwell, and Scituate all have between 48% and 50% <strong>of</strong>their populations <strong>in</strong> this age range. Rockland, Milton, Bra<strong>in</strong>tree, Weymouth, and Andover allhave somewhat smaller shares (43-46%), and Hull has 55% <strong>of</strong> its population aged 45 andolder. With respect to all <strong>of</strong> these communities, the share <strong>of</strong> H<strong>in</strong>gham’s population that is60+, and especially the share aged 80 and older, is considerably higher. Twenty-six percent<strong>of</strong> H<strong>in</strong>gham’s population was aged 60 and older <strong>in</strong> 2010, compared to just 19% <strong>of</strong> thepopulation <strong>of</strong> <strong>Massachusetts</strong>, and 8% was aged 80 or older, compared to just 4% <strong>in</strong><strong>Massachusetts</strong>.16
Table 2: Percentage distribution <strong>of</strong> H<strong>in</strong>gham population by age group,2010 CensusAge group Number PercentageUnder age 18 6,032 27%Age 18-44 5,251 24%Age 45-59 5,139 23%Age 60-79 4,020 18%Age 80 and older 1,715 8%TOTAL 22,157 100%Source: U.S. Census 2010, Table DP-1, American FactF<strong>in</strong>der. www.census.govFigure 1: Age distribution <strong>in</strong> H<strong>in</strong>gham and comparison areas, 2010Hull31%21%3%Scituate26%19%5%H<strong>in</strong>gham23%18%8%Norwell25%18%5%CohassetAndoverWeymouthBra<strong>in</strong>tree25%26%24%22%17%15%16%17%5%4%5%6%% 45-59% 60-79% 80+Milton23%16%6%Rockland23%15%4%<strong>Massachusetts</strong>22%15%4%0% 10% 20% 30% 40% 50% 60%Source: U.S. Census Bureau, 2010 Census. Summary File 1, Table QT-P1.H<strong>in</strong>gham has experienced strong growth <strong>of</strong> its older population <strong>in</strong> recent decades. Between2000 and 2010, the number <strong>of</strong> H<strong>in</strong>gham residents aged 60 and over <strong>in</strong>creased from 3,700to 5,735 (an <strong>in</strong>crease <strong>of</strong> 55%; see Table 3). The correspond<strong>in</strong>g level <strong>of</strong> growth for<strong>Massachusetts</strong> was 16%. In contrast, the number <strong>of</strong> H<strong>in</strong>gham residents aged 45-59 rose17
Table 3. Population Growth between 2000 and 2010All ages Boomers, aged 45-59 Seniors, aged 60+Community Population2010 Population2000PercentagegrowthPopulation2010Population2000PercentagegrowthPopulation2010Population2000PercentagegrowthState <strong>of</strong><strong>Massachusetts</strong>6,547,629 6,349,097 3% 1,445,257 1,183,355 22% 1,273,271 1,096,567 16%H<strong>in</strong>gham 22,157 19,882 11% 5,139 4,575 12% 5,735 3,700 55%Norwell 10,506 9,765 8% 2,656 2,399 11% 2,374 1,651 44%Hull 10,293 11,050 -7% 3,142 2,623 20% 2,481 1,834 35%Andover 33,201 31,247 6% 8,675 7,149 21% 6,477 5,045 28%Scituate 18,133 17,863 2% 4,758 3,921 21% 4,334 3,597 20%Cohasset 7,542 7,261 4% 1,905 1,638 16% 1,688 1,411 20%Rockland 17,489 17,670 -1% 4,045 3,172 28% 3,408 2,958 15%Milton 27,003 26,062 4% 6,338 5,377 18% 5,743 5,144 12%Weymouth 53,743 53,988 -
from 4,575 to 5,139 (an <strong>in</strong>crease <strong>of</strong> 12%), a considerably lower rate than the 22% <strong>in</strong>crease for<strong>Massachusetts</strong>. Us<strong>in</strong>g surround<strong>in</strong>g communities as a comparison, it is evident that thepercentage growth for the population aged 60 and over was substantially greater <strong>in</strong> H<strong>in</strong>gham than<strong>in</strong> all <strong>of</strong> the comparison communities listed <strong>in</strong> Table 3. Some, but not all, <strong>of</strong> this growth was nodoubt a result <strong>of</strong> the buildup <strong>of</strong> L<strong>in</strong>den Ponds, which opened <strong>in</strong> 2004 and <strong>in</strong>cludes approximately1,200 seniors. Over the next ten years, the ag<strong>in</strong>g <strong>of</strong> the Boomer cohort will cont<strong>in</strong>ue to swell thesize <strong>of</strong> the 60+ population <strong>in</strong> H<strong>in</strong>gham and throughout the Commonwealth.Results from the 2010 Census highlight the racial homogeneity <strong>of</strong> H<strong>in</strong>gham relative to the stateas a whole. For all ages comb<strong>in</strong>ed, 95% <strong>of</strong> H<strong>in</strong>gham residents report their race as White, and donot report Hispanic ethnicity. In comparison, 76% <strong>of</strong> the Commonwealth residents report non-Hispanic and White backgrounds (see DP-1, U.S. Census 2010). In H<strong>in</strong>gham as well as <strong>in</strong><strong>Massachusetts</strong>, the majority <strong>of</strong> seniors are women (59% <strong>in</strong> H<strong>in</strong>gham and 57% <strong>in</strong> <strong>Massachusetts</strong>).This is largely due to the greater longevity <strong>of</strong> women than <strong>of</strong> men.The senior population represents a substantial presence <strong>in</strong> H<strong>in</strong>gham, with 46% <strong>of</strong> its nearly 8,500households <strong>in</strong>clud<strong>in</strong>g at least one person aged 60 and over (ACS, 2007-2011). Among allhouseholds <strong>in</strong> H<strong>in</strong>gham, 77% are owned or rented by a resident who is aged 45 or over (seeFigure 2). Rental units are slightly more commonly headed by someone under age 45, but with<strong>in</strong>owner-occupied hous<strong>in</strong>g 37% <strong>of</strong> the householders are aged 45-59, and 40% are aged 60 andover. (A “householder” is the person reported as the head <strong>of</strong> household, typically the person <strong>in</strong>whose name the home is owned or rented.) This suggests that issues relat<strong>in</strong>g to ag<strong>in</strong>g servicesand community amenities valued by older residents may be particularly salient to homeowners <strong>in</strong>H<strong>in</strong>gham. Homeownership is very common among H<strong>in</strong>gham residents, with 80% <strong>of</strong> all householdsliv<strong>in</strong>g <strong>in</strong> homes that they own or are purchas<strong>in</strong>g (see Figure 3). Nearly 9 out <strong>of</strong> 10 householdersaged 45-59 own a home, as do 74% <strong>of</strong> the householders aged 60 and over. Homeownership iscommonly reported even among seniors liv<strong>in</strong>g alone. More than half <strong>of</strong> residents aged 65 andover and who live alone own their homes. Many <strong>of</strong> these <strong>in</strong>dividuals—the majority <strong>of</strong> whom areolder women—may need help with home repairs and other supports <strong>in</strong> order to rema<strong>in</strong>comfortable and safe <strong>in</strong> their homes, as well as to protect their <strong>in</strong>vestments.19
Figure 2: Age distribution <strong>of</strong> householders by owner status, H<strong>in</strong>gham 2010All households23%33%43%Householder is younger than45Owner-occupied23%37%40%Householder is aged 45-59Householder is aged 60+Renters25%19%56%0% 20% 40% 60% 80% 100%Source: U.S. Census Bureau. 2010 Census, Summary File 1, Table H17.Figure 3: Percentage <strong>of</strong> householders who are homeowners by age, H<strong>in</strong>gham 2010One-person households aged 65+Householders aged 60+Householders aged 45-59All householders0% 10% 20% 30% 40% 50% 60% 70% 80% 90% 100%Source: U.S. Census Bureau. 2010 Census, Summary File 1, Tables H17 and H18.20
Although 33% <strong>of</strong> H<strong>in</strong>gham residents aged 65 and over 3 live alone (see Figure 4), more than halflive with a spouse and/or with others <strong>in</strong> their own homes. Only 6% live <strong>in</strong> someone else's home—most typically the home <strong>of</strong> a grown child and his or her family—and a similar share (about 5%) live<strong>in</strong> group quarters such as nurs<strong>in</strong>g homes.Figure 4: Liv<strong>in</strong>g arrangements <strong>of</strong> H<strong>in</strong>gham residents aged 65+, 20105%Lives alone56%33%6%Lives <strong>in</strong> someone else'shome or withnonrelativesFamily household heador spouseLiv<strong>in</strong>g <strong>in</strong> group quartersSource: U.S. Census Bureau. 2010 Census, Summary File 1, Table P34.Social and Economic Results from the American Community SurveyData from the American Community Survey (ACS) may be used to further describe the olderpopulation <strong>of</strong> H<strong>in</strong>gham. 4 Data presented <strong>in</strong> Figure 5 illustrate the comparative economicdisadvantage experienced by many seniors <strong>in</strong> H<strong>in</strong>gham. Median household <strong>in</strong>come ranges wellabove $100,000 annually for households headed by younger and middle-aged residents,reflect<strong>in</strong>g the general affluence <strong>of</strong> the community. However, the median household <strong>in</strong>come forresidents who are aged 65 and over is less than half that, at about $51,000. Seniors liv<strong>in</strong>g alonehave lower median <strong>in</strong>comes yet, at $38,750 for men and $33,125 for women liv<strong>in</strong>g alone. Theeconomic pr<strong>of</strong>ile <strong>of</strong> Seniors, relative to Boomers, is further illustrated <strong>in</strong> Figure 6, which showsthat one-fifth <strong>of</strong> senior households report under $25,000 <strong>in</strong> annual <strong>in</strong>come, compared with just4% <strong>of</strong> Boomer households. While a segment <strong>of</strong> the Senior population is quite affluent—21%report <strong>in</strong>comes <strong>of</strong> $100,000 or greater—this <strong>in</strong>come level is reported by more than half <strong>of</strong> theBoomer households. H<strong>in</strong>gham’s reputation as a well-educated community is reflected <strong>in</strong> theSenior population, 43% <strong>of</strong> whom has earned a bachelor’s, graduate, or pr<strong>of</strong>essional degree. 5More than one-third <strong>of</strong> seniors aged 65-74, and 10% <strong>of</strong> those aged 75 or more, are <strong>in</strong> the labor3 Most data on the senior population that is available for H<strong>in</strong>gham from the Census Bureau uses age 65 as thereference po<strong>in</strong>t rather than age 60, as is used <strong>in</strong> the rema<strong>in</strong><strong>in</strong>g sections <strong>of</strong> this report.4 For smaller communities such as H<strong>in</strong>gham, data from the American Community Survey are available only throughmulti-year files. Most <strong>of</strong> the data presented here are drawn from the 2007-2011 American Community Survey fiveyearfile, which is the most recent available. Data on disability are obta<strong>in</strong>ed from the 2009-2011 ACS three-year file,which is the most recent source for disability data.5 2007-2011 American Community Survey, Table B15001.21
force. 6 More than 6 out <strong>of</strong> 10 among H<strong>in</strong>gham’s men aged 65 and older are veterans (63%) 7 ;many <strong>of</strong> these men, and their wives, may be entitled to some benefits or programs as a result <strong>of</strong>their service.Figure 5: Median household <strong>in</strong>come <strong>in</strong> H<strong>in</strong>gham by age <strong>of</strong> householder (<strong>in</strong> 2011 dollars)$180,000$160,000$140,000$158,672$137,063$120,000$100,000$80,000$60,000$40,000$51,182$38,750 $33,125$20,000$0Householderage 25-44Householderage 45-64Householderage 65+Men age 65+liv<strong>in</strong>g aloneWomen age65+ liv<strong>in</strong>galoneSource: U.S. Census Bureau. 2007-2011 American Community Survey, Tables B19049 and B19215.Note: Includes only community households, not group quarters such as nurs<strong>in</strong>g homes.Figure 6: Household <strong>in</strong>come distribution <strong>in</strong> H<strong>in</strong>gham by age <strong>of</strong> householder (<strong>in</strong> 2011dollars)Age 65+21%28%30%21%Under $25,000$25,000-$49,999$50,000-$99,999Age 45-6410%25%61%$100,000 or more0% 20% 40% 60% 80% 100%Source: U.S. Census Bureau. 2007-2011 American Community Survey, Table B19037.Note: Includes only community households, not group quarters such as nurs<strong>in</strong>g homes.6 2007-2011 American Community Survey, Table B23004.7 2007-2011 American Community Survey, Table B21001.22
Many Seniors experience some level <strong>of</strong> disability that may impact their ability to function well and<strong>in</strong>dependently <strong>in</strong> the community. The American Community Survey <strong>in</strong>cludes a series <strong>of</strong> questionsabout disability. These questions are <strong>in</strong>tended to tap long-last<strong>in</strong>g conditions based <strong>in</strong> physical,mental, or emotional health conditions. 8 Figure 7 highlights the frequency with which seniorsreport some level <strong>of</strong> disability, and reveals that this varies substantially by age group. Six percent<strong>of</strong> the H<strong>in</strong>gham residents aged 65-74 report at least one type <strong>of</strong> disability <strong>in</strong> the ACS, as do morethan one-third <strong>of</strong> the residents aged 75 and over. Among the types <strong>of</strong> disability assessed, themost commonly named were ambulatory limitations (difficulty walk<strong>in</strong>g or climb<strong>in</strong>g stairs)mentioned by 12% <strong>of</strong> those aged 65 and over, and <strong>in</strong>dependent liv<strong>in</strong>g limitations (difficulty do<strong>in</strong>gerrands alone such as visit<strong>in</strong>g a doctor’s <strong>of</strong>fice or shopp<strong>in</strong>g), also reported by 11%. These rates <strong>of</strong>disability are lower than those suggested by the ACS for <strong>Massachusetts</strong> as a whole (22% for those65-74 and 47% for those 75+).Figure 7: Percentage report<strong>in</strong>g a disability by age group, H<strong>in</strong>ghamH<strong>in</strong>gham residents age 65-746%H<strong>in</strong>gham residents age 75+39%0% 5% 10% 15% 20% 25% 30% 35% 40% 45%Source: U.S. Census Bureau. 2009-2011 American Community Survey, Table B18108.About H<strong>in</strong>gham Department <strong>of</strong> Elder ServicesThe Department <strong>of</strong> Elder Services <strong>of</strong>fers a wide range <strong>of</strong> services and programs <strong>in</strong>tended to meetthe many different needs and <strong>in</strong>terests <strong>of</strong> H<strong>in</strong>gham’s older population. The Senior Center servesas the focal po<strong>in</strong>t for the delivery <strong>of</strong> services and programs. All programs and services are open toany H<strong>in</strong>gham resident 60 and older and where space permits, seniors from other communities arewelcome to participate. Programs <strong>of</strong>fered through H<strong>in</strong>gham Department <strong>of</strong> Elder Services <strong>in</strong>cludethe follow<strong>in</strong>g 9 :8 The questions asked <strong>in</strong> the American Community Survey are as follows: a. “Is this person deaf or does he/she haveserious difficulty hear<strong>in</strong>g? Is this person bl<strong>in</strong>d or does he/she have serious difficulty see<strong>in</strong>g even when wear<strong>in</strong>gglasses?” b. “Because <strong>of</strong> a physical, mental, or emotional condition, does this person have serious difficultyconcentrat<strong>in</strong>g, remember<strong>in</strong>g, or mak<strong>in</strong>g decisions? Does this person have serious difficulty walk<strong>in</strong>g or climb<strong>in</strong>g stairs?Does this person have difficulty dress<strong>in</strong>g or bath<strong>in</strong>g?” c. “Because <strong>of</strong> a physical, mental, or emotional condition, doesthis person have difficulty do<strong>in</strong>g errands alone such as visit<strong>in</strong>g a doctor’s <strong>of</strong>fice or shopp<strong>in</strong>g?”9 Content <strong>of</strong> this section is drawn from a document provided by H<strong>in</strong>gham Department <strong>of</strong> Elder Services.23
Health and Wellness: These programs consist <strong>of</strong> regularly scheduled fitness classes,health cl<strong>in</strong>ics, and a variety <strong>of</strong> health education programs scheduled throughout the year.Support groups for <strong>in</strong>dividuals liv<strong>in</strong>g with a variety <strong>of</strong> health conditions and for caregivers <strong>of</strong>Alzheimer’s and related dementias are also held.Transportation: Door-to-door transportation to medical appo<strong>in</strong>tments, shopp<strong>in</strong>g, necessaryerrands, hair appo<strong>in</strong>tments, social out<strong>in</strong>gs, and to the Senior Center, is available on a prearrangedschedule Mondays through Fridays.F<strong>in</strong>ancial Assistance/Benefits Programs/Pr<strong>of</strong>essional Services: Income tax preparation,help with complet<strong>in</strong>g fuel assistance applications, f<strong>in</strong>ancial assistance with utility bills anditems <strong>of</strong> necessity for those who are <strong>in</strong> need but do not meet the guidel<strong>in</strong>es for otherassistance programs, Property Tax Work-Off Program, and educational programs onf<strong>in</strong>ancial topics are <strong>of</strong>fered through the Senior Center.Nutrition/Meals Programs: Twice a week a Title III-C lunch is held at the Senior Center;home delivered meals are available 5 days a week based on eligibility. Monthly communitylunches provided by churches and organizations <strong>in</strong> H<strong>in</strong>gham, and a monthly Men’sBreakfast are also held at the Senior Center.Outreach Program: Information and referral, assessment <strong>of</strong> needs, assistance withcomplet<strong>in</strong>g benefit application forms, and advocacy are provided through the OutreachProgram.In-Home Support Services: M<strong>in</strong>or home repairs are provided to assist seniors withrema<strong>in</strong><strong>in</strong>g <strong>in</strong> their own homes.S.H.I.N.E. (Serv<strong>in</strong>g Health Information Needs <strong>of</strong> Elders): This program assists seniors withquestions and problems that they may have with their medical bills, changes <strong>in</strong> health carecoverage, and general educational programs about health plan options.Recreational and Cultural Programs: A variety <strong>of</strong> programs are <strong>of</strong>fered on a weekly,monthly, or on an as scheduled basis <strong>in</strong>clud<strong>in</strong>g a current events discussion group (WorldAffairs), quilt<strong>in</strong>g, knitt<strong>in</strong>g, oriental rug mak<strong>in</strong>g, draw<strong>in</strong>g classes, opera group, various boardand card games, O.P.A.L.S. S<strong>in</strong>g<strong>in</strong>g Group, and cultural trips.Community Education Programs: Various community education programs are scheduledthroughout the year <strong>in</strong>clud<strong>in</strong>g a Lifelong Learn<strong>in</strong>g Program and Wisdom Works, a jobsearch skills tra<strong>in</strong><strong>in</strong>g program.Volunteer Opportunities: Opportunities are provided to <strong>in</strong>dividuals <strong>in</strong> the community toutilize their talents, skills, and knowledge through the Senior Center’s Volunteer Program.Volunteer opportunities <strong>in</strong>clude teach<strong>in</strong>g classes, driv<strong>in</strong>g the vans for non-medicaltransportation, staff<strong>in</strong>g the Senior Center, serv<strong>in</strong>g as Council on <strong>Ag<strong>in</strong>g</strong> members,coord<strong>in</strong>at<strong>in</strong>g the monthly mail<strong>in</strong>g <strong>of</strong> the newsletter, and staff<strong>in</strong>g the nutrition program.Participation <strong>in</strong> Elder Services programs has rema<strong>in</strong>ed at high levels for the most recent threeyearperiod. Table 4 displays usage statistics, provided by the Department <strong>of</strong> Elder Services. Thenumber <strong>of</strong> seniors who have participated <strong>in</strong> Elder Services programs has been stable at 1,800-24
1,900 <strong>in</strong>dividuals each year for FY2010 through FY2012. The number <strong>of</strong> service units (discreteactivities) that these <strong>in</strong>dividuals participated <strong>in</strong> varied between 21,000 (<strong>in</strong> FY2011) and 25,619(<strong>in</strong> FY2012). The calculations displayed at the bottom <strong>of</strong> Table 4 <strong>in</strong>dicate a ratio <strong>of</strong> service unitsto senior participants between 12.0 and 13.5 for the three years shown. Tak<strong>in</strong>g a ratio <strong>of</strong>unduplicated participants to the estimated <strong>Town</strong> population aged 60+ suggests that roughly onethird<strong>of</strong> the Senior population <strong>of</strong> H<strong>in</strong>gham participated <strong>in</strong> Elder Services programs dur<strong>in</strong>g each <strong>of</strong>these three years.Additional statistics provided by Elder Services <strong>in</strong>dicate that about 70% <strong>of</strong> the Senior Centerparticipants are women. Accord<strong>in</strong>g to the 2010 Census, 59% <strong>of</strong> the population aged 60 and older<strong>in</strong> H<strong>in</strong>gham is female, suggest<strong>in</strong>g that women are disproportionately represented among SeniorCenter participants. Elder Services data also suggest that approximately 46% <strong>of</strong> Senior Centerparticipants are over the age <strong>of</strong> 75. The 2010 Census shows that 43% <strong>of</strong> the Senior population <strong>in</strong>H<strong>in</strong>gham is aged 75 and older, suggest<strong>in</strong>g that residents under and over age 75 are participat<strong>in</strong>g<strong>in</strong> the Senior Center at levels consistent with their numbers <strong>in</strong> the community.Table 4: Usage statistics, <strong>Town</strong> <strong>of</strong> H<strong>in</strong>gham Elder Services, 2010-2012FY2010 FY2011 FY2012 Change, 2010-2012Unduplicated seniorsparticipat<strong>in</strong>g1,828 1,780 1,892 +3.5%Units <strong>of</strong> service 23,475 21,335 25,619 +9.1%<strong>Town</strong> population aged60+5,297* 5,735** 5,735** +8.3%Ratio <strong>of</strong> service units tounduplicated seniorsparticipat<strong>in</strong>gEstimated percentage <strong>of</strong>population aged 60+participat<strong>in</strong>g12.8 12.0 13.534.5% 31.0% 33.0%Source: H<strong>in</strong>gham Department <strong>of</strong> Elder Services.*Based on <strong>Town</strong> census**Based on 2010 U.S. CensusFigure 8 shows units <strong>of</strong> service by program for the most recent year with complete data available,FY2012. The programs with the highest volume <strong>of</strong> participation are fitness and exercise25
programs, social activities, and transportation. The tax work-<strong>of</strong>f program also reflects a high level<strong>of</strong> participation. Participation levels are lower for the other program groups.Figure 8: Units <strong>of</strong> service by program, <strong>Town</strong> <strong>of</strong> H<strong>in</strong>gham Elder Services, FY 2012Source: H<strong>in</strong>gham Department <strong>of</strong> Elder ServicesResults from the H<strong>in</strong>gham Community Survey <strong>of</strong> Boomers and SeniorsThe community survey conducted <strong>in</strong> Fall 2012 gathered unique <strong>in</strong>formation not available throughexist<strong>in</strong>g data sources. As noted above, samples were drawn from the pool <strong>of</strong> H<strong>in</strong>gham residentsaged 45-59 (the Boomers) as well as from H<strong>in</strong>gham residents aged 60 and over (the Seniors).Consistent with the demographic characteristics <strong>of</strong> H<strong>in</strong>gham as a whole, very few <strong>of</strong> therespondents to the community survey were non-White or Hispanic. 10 All respondents were aged45 and over, and a majority (66%) was female. 11Commitment to H<strong>in</strong>ghamFitness/exerciseSocial activitiesTransportation (one-way trips)Tax work <strong>of</strong>fCommunity educationOutreachCongregate MealsCultural eventsGroup supportHealth screen<strong>in</strong>gTax assistance0 1000 2000 3000 4000 5000 6000 7000Boomer and Senior residents alike are highly committed to rema<strong>in</strong><strong>in</strong>g <strong>in</strong> H<strong>in</strong>gham as they growolder. As shown <strong>in</strong> Figure 9, 30% <strong>of</strong> Boomers have lived <strong>in</strong> H<strong>in</strong>gham for 25 years or more, as havetwo-thirds <strong>of</strong> Seniors. Detailed <strong>in</strong>spection <strong>of</strong> the data for respondents aged 80 and older showthat two segments <strong>of</strong> roughly equal size are <strong>in</strong>cluded‒those aged 80+ who do not live <strong>in</strong> L<strong>in</strong>denPonds or Allerton House, 68% <strong>of</strong> whom have resided <strong>in</strong> H<strong>in</strong>gham for 40 years or more, and those80+ who do live <strong>in</strong> one <strong>of</strong> these communities, 87% <strong>of</strong> whom have lived <strong>in</strong> H<strong>in</strong>gham for fewer than10 years (see Table 5). When asked how important it is for them to rema<strong>in</strong> liv<strong>in</strong>g <strong>in</strong> H<strong>in</strong>gham "aslong as possible," a sizable majority report feel<strong>in</strong>g that it is "extremely" or "very" important to do so(67% <strong>of</strong> Boomers and 82% <strong>of</strong> Seniors, <strong>in</strong>clud<strong>in</strong>g 95% <strong>of</strong> those age 80+; see Figure 10). This high10 For detailed tables summariz<strong>in</strong>g the results <strong>of</strong> the H<strong>in</strong>gham community survey, see Appendix B.11 Respondents to the community survey are somewhat more likely to be female than would be expected based onthe gender distribution <strong>in</strong> H<strong>in</strong>gham. In the community survey, 66% <strong>of</strong> the respondents are women; <strong>in</strong> the 2010Census <strong>of</strong> Population, 56% <strong>of</strong> the population aged 45 and over is female.26
level <strong>of</strong> commitment to ag<strong>in</strong>g <strong>in</strong> place provides a backdrop aga<strong>in</strong>st which the characteristics,activities, and challenges <strong>of</strong> residents may be <strong>in</strong>terpreted.Figure 9: Duration <strong>of</strong> residence <strong>in</strong> H<strong>in</strong>gham, Boomers and SeniorsSeniors34%29%37%Fewer than 25 years25-39 years40 years or moreBoomers70%13%17%0% 20% 40% 60% 80% 100%Source: <strong>Town</strong> <strong>of</strong> H<strong>in</strong>gham Department <strong>of</strong> Elder Services Survey <strong>of</strong> Residents Age 45 & Over, 2012Table 5: Detailed duration <strong>of</strong> residence <strong>in</strong> H<strong>in</strong>gham, seniors aged 80 and olderYears <strong>of</strong> residence <strong>in</strong>H<strong>in</strong>ghamAge 80+, not liv<strong>in</strong>g <strong>in</strong>L<strong>in</strong>den Ponds or AllertonHouseAge 80+, liv<strong>in</strong>g <strong>in</strong> L<strong>in</strong>denPonds or Allerton HouseFewer than 5 years 0% 36%5-9 years 4% 51%10-14 years 5% 0%15-24 years 13% 2%25-39 years 10% 3%40 years or more 68% 8%TOTAL 100% 100%Source: <strong>Town</strong> <strong>of</strong> H<strong>in</strong>gham Department <strong>of</strong> Elder Services Survey <strong>of</strong> Residents Age 45 & Over, 201227
Figure 10: Importance <strong>of</strong> rema<strong>in</strong><strong>in</strong>g <strong>in</strong> H<strong>in</strong>gham for as long as possible, by age groupSeniors aged 80+95%Seniors82%13%Extremely or very importantSomewhat importantNot very/not at all importantBoomers67%23%10%0% 20% 40% 60% 80% 100%Source: <strong>Town</strong> <strong>of</strong> H<strong>in</strong>gham Department <strong>of</strong> Elder Services Survey <strong>of</strong> Residents Age 45 & Over, 2012Social SupportAs discussed above, social support is important to the health and well-be<strong>in</strong>g for <strong>in</strong>dividuals <strong>of</strong> allages. Hav<strong>in</strong>g friends, family members, and neighbors who can be relied upon is especiallyimportant among people who are becom<strong>in</strong>g frail, and may make the difference betweenrema<strong>in</strong><strong>in</strong>g <strong>in</strong>dependent with<strong>in</strong> the community and mov<strong>in</strong>g <strong>in</strong>to a nurs<strong>in</strong>g home or other supportiveresidence. Community survey results suggest that most H<strong>in</strong>gham residents are actively engaged<strong>in</strong> social activities and enjoy good support from their social networks. Key <strong>in</strong>dicators <strong>of</strong> socialsupport <strong>in</strong>clude liv<strong>in</strong>g arrangements and presence <strong>of</strong> a spouse or partner. As shown <strong>in</strong> Figure 11,more than eight out <strong>of</strong> ten Boomers are married or liv<strong>in</strong>g with a partner, as are two-thirds <strong>of</strong>Seniors. As a result, relatively few Boomers—about 8%—live alone, while the rest live <strong>in</strong>households that <strong>in</strong>clude a spouse, children, and/or other relatives (Figure 12). Liv<strong>in</strong>g alone is farmore common among Seniors, with nearly 30% liv<strong>in</strong>g <strong>in</strong> one-person households. 12 The mostcommon liv<strong>in</strong>g situation for Seniors <strong>in</strong> H<strong>in</strong>gham is liv<strong>in</strong>g <strong>in</strong> a household <strong>in</strong>clud<strong>in</strong>g a spouse but noother residents, reported by 58% <strong>of</strong> Seniors.12 This statistic from the H<strong>in</strong>gham community survey refers to those who responded to the survey and were aged 60and over. Data from the American Community Survey, cited earlier, suggests that a somewhat larger share (33%) <strong>of</strong>those aged 65 and older lives alone. The difference between these two statistics is a reflection both <strong>of</strong> the higherlikelihood <strong>of</strong> liv<strong>in</strong>g alone among <strong>in</strong>dividuals with <strong>in</strong>creased age (here, those aged 65+ compared to those aged 60+),due especially to higher rates <strong>of</strong> widowhood, and to the different data sources used.28
Figure 11: Marital status among H<strong>in</strong>gham Boomers and SeniorsSeniorsBoomers66% 18% 9% 7%86%Married or partneredWidowedDivorced or separatedNever married0% 20% 40% 60% 80% 100%Source: <strong>Town</strong> <strong>of</strong> H<strong>in</strong>gham Department <strong>of</strong> Elder Services Survey <strong>of</strong> Residents Age 45 & Over, 2012Figure 12: Liv<strong>in</strong>g arrangements among Boomers & Seniors <strong>in</strong> H<strong>in</strong>ghamSeniors28%58%7%7%AloneSpouse onlySpouse & othersOthers no spouseBoomers8%29%55%8%0% 20% 40% 60% 80% 100%Source: <strong>Town</strong> <strong>of</strong> H<strong>in</strong>gham Department <strong>of</strong> Elder Services Survey <strong>of</strong> Residents Age 45 & Over, 2012Other <strong>in</strong>dicators <strong>of</strong> social support and engagement provide an equally positive view. About threequarters<strong>of</strong> both Boomers (71%) and Seniors (76%) report hav<strong>in</strong>g at least three friends or relativeson whom they could call for assistance, but 6% <strong>of</strong> Boomers and 3% <strong>of</strong> Seniors report that theyhave no such social supports (see Figure 13). More than half <strong>of</strong> Seniors report talk<strong>in</strong>g on the29
phone, email<strong>in</strong>g, or gett<strong>in</strong>g together with friends or relatives four or more days per week (Figure14), with 5% report<strong>in</strong>g participat<strong>in</strong>g <strong>in</strong> these social activities less than 1 day per week. Boomersare somewhat less likely to report high levels <strong>of</strong> communication and visit<strong>in</strong>g with friends andrelatives (12% <strong>of</strong> Boomers talk on the phone or get together with friends or relatives less than 1day per week, and 48% do so four or more days per week). This lower level <strong>of</strong> social activityamong Boomers may be due to their more extensive work obligations.Figure 13: Number <strong>of</strong> friends or relatives one could call for assistance,by age cohortSeniors21%76%NoneOne or twoThree or moreBoomers23%71%0% 20% 40% 60% 80% 100% 120%Source: <strong>Town</strong> <strong>of</strong> H<strong>in</strong>gham Department <strong>of</strong> Elder Services Survey <strong>of</strong> Residents Age 45 & Over, 2012Figure 14: Social activity, by age cohort(Frequency <strong>of</strong> talk<strong>in</strong>g on the phone, email<strong>in</strong>g, or gett<strong>in</strong>g together with friends or relatives)100%90%80%70%60%50%40%30%20%10%0%48%40%12%Boomers56%39%5%Seniors4-7 days/wk1-3 days/wkLess than 1 day/wkSource: <strong>Town</strong> <strong>of</strong> H<strong>in</strong>gham Department <strong>of</strong> Elder Services Survey <strong>of</strong> Residents Age 45 & Over, 201230
Health and Medical StatusMore than half <strong>of</strong> H<strong>in</strong>gham’s Boomers enjoy excellent health, as do nearly one-third <strong>of</strong> the Seniors(see Figure 15). When asked to rate their overall health on a four-po<strong>in</strong>t scale, rang<strong>in</strong>g from poorto excellent, 63% <strong>of</strong> the Boomers and 30% <strong>of</strong> the Seniors report "excellent" and an additional 35%<strong>of</strong> Boomers and 56% <strong>of</strong> Seniors respond "good." Although just 2% <strong>of</strong> Boomers report their healthas "fair" or "poor," a larger share (14%) <strong>of</strong> Seniors evaluate their health as less than good. Thispattern is consistent with an <strong>in</strong>creas<strong>in</strong>g risk <strong>of</strong> chronic and disabl<strong>in</strong>g conditions experienced by<strong>in</strong>dividuals <strong>in</strong> later life. Among those aged 80 and older, 18% report their health as fair or poor(see Appendix B). With respect to feel<strong>in</strong>g "sad, depressed, or 'down <strong>in</strong> the dumps'," Boomers andSeniors are quite similar (see Figure 16). Seventy percent <strong>of</strong> Boomers and 73% <strong>of</strong> Seniors reportthat they "never" or "rarely" feel depressed, while 4-6% <strong>of</strong> each group report feel<strong>in</strong>g this way"<strong>of</strong>ten" or "always."Figure 15: Self-rated health status, by age cohortSeniors30%56% 13%ExcellentGoodFairPoorBoomers63%35%0% 10% 20% 30% 40% 50% 60% 70% 80% 90% 100%Source: <strong>Town</strong> <strong>of</strong> H<strong>in</strong>gham Department <strong>of</strong> Elder Services Survey <strong>of</strong> Residents Age 45 & Over, 201231
Figure 16: Percentage report<strong>in</strong>g feel<strong>in</strong>g sad or depressed <strong>in</strong> the past monthSeniors73%23%4%Never or rarelySometimesOften or alwaysBoomers70%24%6%0% 20% 40% 60% 80% 100%Source: <strong>Town</strong> <strong>of</strong> H<strong>in</strong>gham Department <strong>of</strong> Elder Services Survey <strong>of</strong> Residents Age 45 & Over, 2012Patterns <strong>of</strong> medical service use reported <strong>in</strong> the survey suggest that nearly all respondents have aprimary care doctor whom they normally see with medical concerns (96% <strong>of</strong> each group respondaffirmatively). All but a small share <strong>of</strong> the respondents have visited a medical doctor or otherhealth care pr<strong>of</strong>essional at least once <strong>in</strong> the previous 12 months. Only 5% <strong>of</strong> Boomers and 1% <strong>of</strong>Seniors report no medical visits dur<strong>in</strong>g the previous year; 11% <strong>of</strong> Boomers and one-third <strong>of</strong> theSeniors report five or more visits (see Figure 17).Figure 17: Medical visits <strong>in</strong> the last 12 monthsSeniors33%33%33%Never1-2 times3-4 timesBoomers59%25%11%5 times or more0% 20% 40% 60% 80% 100%Source: <strong>Town</strong> <strong>of</strong> H<strong>in</strong>gham Department <strong>of</strong> Elder Services Survey <strong>of</strong> Residents Age 45 & Over, 2012Giv<strong>in</strong>g and Receiv<strong>in</strong>g CareConsistent with the good health shared by most respondents to the community survey, relativelyfew report needs for care. Three questions were asked about needs for help, focus<strong>in</strong>g on needs32
for assistance with household activities such as clean<strong>in</strong>g or yard work, with daily activities such astak<strong>in</strong>g medications, or with personal activities such as bath<strong>in</strong>g. Only 8% <strong>of</strong> the Boomers reportneed<strong>in</strong>g help with any <strong>of</strong> these activity clusters. A larger share <strong>of</strong> the Seniors—31%—reportneed<strong>in</strong>g help with one or more <strong>of</strong> these activities 13 (see Table 6). The most commonly reportedneed for assistance is with household activities. Among those who need support, most reportreceiv<strong>in</strong>g it (less than 1% report not receiv<strong>in</strong>g needed help). For those receiv<strong>in</strong>g help, relativelyfew rely on unpaid help only. Most Boomer and Senior recipients <strong>of</strong> assistance use paid help only(50% or more), or a comb<strong>in</strong>ation <strong>of</strong> paid and unpaid help.Table 6: Receiv<strong>in</strong>g assistance* at home, by age cohortHelp received Boomers Seniors Seniors aged 80+No help needed 92% 69% 51%Need help only forhousehold activitiesNeed help for daily orpersonal activities7% 27% 39%1% 4% 10%TOTAL 100% 100% 100%*Assistance with household activities (eg, clean<strong>in</strong>g or yard work); daily activities (eg, us<strong>in</strong>g the phone ortak<strong>in</strong>g medication); or personal activities (eg, bath<strong>in</strong>g).Source: <strong>Town</strong> <strong>of</strong> H<strong>in</strong>gham Department <strong>of</strong> Elder Services Survey <strong>of</strong> Residents Age 45 & Over, 2012Provid<strong>in</strong>g unpaid care or assistance to a disabled, ill, or elderly spouse, relative or friend isreported by 18% <strong>of</strong> the Boomers and 14% <strong>of</strong> the Seniors (Figure 18). Eight percent <strong>of</strong> Boomersand 4% <strong>of</strong> Seniors provide care for someone with dementia (reflect<strong>in</strong>g 44% <strong>of</strong> the Boomercaregivers, and 29% <strong>of</strong> the Senior caregivers). Participat<strong>in</strong>g <strong>in</strong> caregiv<strong>in</strong>g activities while meet<strong>in</strong>gother work and family responsibilities is described as "very" or "somewhat" difficult by 37% <strong>of</strong> theSenior caregivers, and 68% <strong>of</strong> the Boomer caregivers (see Figure 19).13 The rate <strong>of</strong> persons need<strong>in</strong>g help for daily or personal activities compares favorably to the American CommunitySurvey results for H<strong>in</strong>gham seniors aged 65+, which <strong>in</strong>dicate that 4% <strong>of</strong> those 65 and over have difficulty dress<strong>in</strong>g,bath<strong>in</strong>g, or gett<strong>in</strong>g around <strong>in</strong>side the home.33
Figure 18: Provid<strong>in</strong>g unpaid care to a disabled, ill, or elderly spouse,relative, or friend100%90%80%70%60%50%40%30%20%10%0%8% 4%10%10%82% 86%BoomersSeniorsCar<strong>in</strong>g for someone withdementiaCar<strong>in</strong>g for someone, nodementiaNot a caregiverSource: <strong>Town</strong> <strong>of</strong> H<strong>in</strong>gham Department <strong>of</strong> Elder Services Survey <strong>of</strong> Residents Age 45 & Over, 2012Figure 19: Difficulty experienced <strong>in</strong> provid<strong>in</strong>g care (caregivers only)Seniors37%36%27%Very or somewhat difficultNeither difficult nor easySomewhat or very easyBoomers68%17%15%0% 20% 40% 60% 80% 100%Source: <strong>Town</strong> <strong>of</strong> H<strong>in</strong>gham Department <strong>of</strong> Elder Services Survey <strong>of</strong> Residents Age 45 & Over, 2012Economic Security and Plann<strong>in</strong>g AheadConsistent with the results reported previously from the Census Bureau, respondents to thecommunity survey report relatively high levels <strong>of</strong> family <strong>in</strong>come, especially among Boomers (seeAppendix B). Yet experienc<strong>in</strong>g economic shortfalls <strong>in</strong> the previous year is not uncommon amongeither cohort. Sixteen percent <strong>of</strong> the Boomers and 9% <strong>of</strong> the Seniors report not hav<strong>in</strong>g enough34
Figure 21: Work status by age cohortSeniors74%13%13%Not employedEmployed part-timeEmployed full-timeBoomers25%14%61%0% 20% 40% 60% 80% 100% 120%Source: <strong>Town</strong> <strong>of</strong> H<strong>in</strong>gham Department <strong>of</strong> Elder Services Survey <strong>of</strong> Residents Age 45 & Over, 2012Note: Part-time employment is <strong>in</strong>dicated by work<strong>in</strong>g less than 30 hours per week.Figure 22: Plans for retirement among non-retired H<strong>in</strong>gham residents100%90%80%70%60%50%40%30%20%10%0%10% 11%19%11%6%12%46%26%19%34%4%Boomers Seniors aged 60-79I do not anticipate retir<strong>in</strong>gNot sureIn 10 or more yearsIn 5-10 yearsIn 3-5 yearsWith<strong>in</strong> 3 yearsSource: <strong>Town</strong> <strong>of</strong> H<strong>in</strong>gham Department <strong>of</strong> Elder Services Survey <strong>of</strong> Residents Age 45 & Over, 2012Respondents who are not yet retired were asked to gauge their level <strong>of</strong> agreement with thefollow<strong>in</strong>g statement: "I expect to have adequate resources to meet my f<strong>in</strong>ancial needs <strong>in</strong>retirement." Only 18% <strong>of</strong> the Boomers and 25% <strong>of</strong> the Seniors strongly agree with this statement,the rema<strong>in</strong><strong>in</strong>g respondents hav<strong>in</strong>g some uncerta<strong>in</strong>ty on this issue (Figure 23). Indeed, 20% <strong>of</strong> the36
Boomers and 13% <strong>of</strong> the Seniors either strongly or somewhat disagree with the statement. Whennon-retired Boomers and Seniors are asked if they had done any f<strong>in</strong>ancial plann<strong>in</strong>g for retirement,about one-third report hav<strong>in</strong>g done extensive f<strong>in</strong>ancial plann<strong>in</strong>g 15 (Figure 24). However, more thanhalf <strong>of</strong> each cohort reports that despite hav<strong>in</strong>g done some f<strong>in</strong>ancial plann<strong>in</strong>g, they need to domore. This distribution <strong>of</strong> responses was quite similar for non-retired Boomers and Seniors (seeAppendix B).Figure 23: Confidence <strong>in</strong> be<strong>in</strong>g able to meet f<strong>in</strong>ancial needs <strong>in</strong> retirement,non-retired Boomers and Seniors[“I expect to have adequate resources to meet my f<strong>in</strong>ancial needs <strong>in</strong> retirement”]100%90%80%70%60%50%40%30%20%10%0%10% 7%6%10%16%13%49%18%46%25%Boomers Seniors aged 60-79Strongly disagreeSomewhat disagreeNeither agree nor disagreeSomewhat agreeStrongly agreeSource: <strong>Town</strong> <strong>of</strong> H<strong>in</strong>gham Department <strong>of</strong> Elder Services Survey <strong>of</strong> Residents Age 45 & Over, 201215 In the questionnaire, f<strong>in</strong>ancial plann<strong>in</strong>g activities were def<strong>in</strong>ed as "consult<strong>in</strong>g a f<strong>in</strong>ancial or legal pr<strong>of</strong>essional,tak<strong>in</strong>g a sem<strong>in</strong>ar, or tak<strong>in</strong>g other steps to ensure you will have adequate <strong>in</strong>come when you retire."37
Figure 25: Type <strong>of</strong> residence, H<strong>in</strong>gham Boomers and SeniorsSeniors aged 80+42%45%13%Seniors68%16%16%S<strong>in</strong>gle family homeL<strong>in</strong>den Ponds or Allerton HouseOtherBoomers87%13%0% 20% 40% 60% 80% 100%Source: <strong>Town</strong> <strong>of</strong> H<strong>in</strong>gham Department <strong>of</strong> Elder Services Survey <strong>of</strong> Residents Age 45 & Over, 2012Figure 26: Needs for repairs or modifications to home <strong>in</strong> order to age <strong>in</strong> placeSeniors85%9%8%No changes neededRepairs needed, cannot affordthemBoomers81%13%6%Repairs needed, but can affordthem0% 20% 40% 60% 80% 100%Source: <strong>Town</strong> <strong>of</strong> H<strong>in</strong>gham Department <strong>of</strong> Elder Services Survey <strong>of</strong> Residents Age 45 & Over, 2012A large majority <strong>of</strong> H<strong>in</strong>gham respondents feel safe <strong>in</strong> their neighborhoods (Figure 27).Respondents were asked to <strong>in</strong>dicate their level <strong>of</strong> agreement with the follow<strong>in</strong>g statement: "This isa neighborhood where I feel safe." N<strong>in</strong>ety-five percent <strong>of</strong> the Boomers and 97% <strong>of</strong> the Seniorsreport that they "strongly" or "somewhat" agree with that statement. Only 1% <strong>of</strong> each cohort reportsomewhat or strongly disagree<strong>in</strong>g.39
Figure 27: “This is a neighborhood where I feel safe”100%90%80%14% 17%70%60%50%40%30%20%10%81% 80%Somewhat agreeStrongly agree0%BoomersSeniorsSource: <strong>Town</strong> <strong>of</strong> H<strong>in</strong>gham Department <strong>of</strong> Elder Services Survey <strong>of</strong> Residents Age 45 & Over, 2012TransportationAs noted above, transportation to services, social activities, and amenities is essential for quality<strong>of</strong> life and ag<strong>in</strong>g <strong>in</strong> place. The vast majority <strong>of</strong> the community survey respondents drive, anddriv<strong>in</strong>g themselves is the primary form <strong>of</strong> transportation used by most. More than 90% <strong>of</strong>respondents report driv<strong>in</strong>g, and the share who are drivers does not fall below 90% until age 80and above (see Figure 28). Other common forms <strong>of</strong> transportation <strong>in</strong>clude family, friends andneighbors, walk<strong>in</strong>g or rid<strong>in</strong>g a bike. About one-fifth used public transportation options with<strong>in</strong> theprevious 6 months (see Appendix B). Those who do not drive rely primarily on family, friends orneighbors for transportation, but 40% reported us<strong>in</strong>g a taxi and 26% used Elder Servicestransportation services.40
Figure 28: Percentage who are drivers, by age group100%90%80%70%60%50%40%45-49 50-54 55-59 60-64 65-69 70-74 75-79 80-84 85+Source: <strong>Town</strong> <strong>of</strong> H<strong>in</strong>gham Department <strong>of</strong> Elder Services Survey <strong>of</strong> Residents Age 45 & Over, 2012Respondents who drive were asked if they ever modify their driv<strong>in</strong>g behavior by avoid<strong>in</strong>g nightdriv<strong>in</strong>g, mak<strong>in</strong>g left-hand turns, driv<strong>in</strong>g <strong>in</strong> bad weather, expressway driv<strong>in</strong>g, or driv<strong>in</strong>g <strong>in</strong> unfamiliarareas or for long distances. Seventeen percent <strong>of</strong> the Boomers who drive report mak<strong>in</strong>g somemodifications, as do nearly half <strong>of</strong> the Seniors (see Figure 29). More than three-quarters <strong>of</strong>drivers aged 80 and older report modify<strong>in</strong>g their driv<strong>in</strong>g <strong>in</strong> some way. Most respondents—79% <strong>of</strong>Seniors and 59% <strong>of</strong> Boomers—are aware that the Department <strong>of</strong> Elder Services providestransportation services (see Appendix B), and about half <strong>of</strong> the drivers report that they would usethose services if they were unable to drive <strong>in</strong> the future. Indeed, a larger share <strong>of</strong> drivers reportthey would meet their transportation needs us<strong>in</strong>g the Department <strong>of</strong> Elder Services transportationthan say they would use The Ride, taxi service, or public transportation (see Figure 30). Thesefigures suggest high potential demand for transportation assistance through the Department <strong>of</strong>Elder Services as more seniors reduce or stop driv<strong>in</strong>g themselves.41
Figure 29: Percentage modify<strong>in</strong>g driv<strong>in</strong>g behavior, among Boomer and Seniordrivers <strong>in</strong> H<strong>in</strong>ghamSeniors aged 80+78%Seniors47%Boomers17%0% 10% 20% 30% 40% 50% 60% 70% 80% 90%Source: <strong>Town</strong> <strong>of</strong> H<strong>in</strong>gham Department <strong>of</strong> Elder Services Survey <strong>of</strong> Residents Age 45 & Over, 2012Note: modifications listed <strong>in</strong>clude avoid<strong>in</strong>g night driv<strong>in</strong>g, mak<strong>in</strong>g left-hand turns, driv<strong>in</strong>g <strong>in</strong> badweather, expressway driv<strong>in</strong>g, driv<strong>in</strong>g far distances or <strong>in</strong> unfamiliar areas.Figure 30: Strategies for meet<strong>in</strong>g transportation needs if could not drive (current driversonly) [“In the future, if you were no longer able to drive, how would you meet yourtransportation needs?]80%70%67%60%50%49%47%40%30%20%10%34% 33%29%0%Spouse orchildrenH<strong>in</strong>gham ElderServicesFriends orneighborsTaxiPublictransportationThe RideSource: <strong>Town</strong> <strong>of</strong> H<strong>in</strong>gham Department <strong>of</strong> Elder Services Survey <strong>of</strong> Residents Age 45 & Over, 201242
Elder Services ActivitiesThe Department <strong>of</strong> Elder Services <strong>of</strong>fers a wide range <strong>of</strong> services and programs <strong>in</strong>tended to meetthe many different needs and <strong>in</strong>terests <strong>of</strong> H<strong>in</strong>gham’s seniors aged 60 and over.Results from the community survey suggest that participation <strong>in</strong> the Department <strong>of</strong> Elder Servicesprograms reaches high levels especially among seniors <strong>in</strong> their 70s. As shown <strong>in</strong> Figure 31,participation rates are very low among respondents under age 60, but are substantially higheramong older age groups. Participation rates peak among those aged 75-79, near<strong>in</strong>g 50% for thatage group, and decl<strong>in</strong>es <strong>in</strong> participation rates are observed for respondents <strong>in</strong> their 80s. As notedabove, a sizable share <strong>of</strong> survey respondents aged 80 and older live <strong>in</strong> L<strong>in</strong>den Ponds or AllertonHouse, which have their own programm<strong>in</strong>g and services available for residents. Indeed, surveyresults suggest that participation rates rema<strong>in</strong> high at more than 50% for those aged 80 or more,among H<strong>in</strong>gham residents who do not live <strong>in</strong> one <strong>of</strong> those two hous<strong>in</strong>g developments (seeAppendix B).Figure 31: Percentage <strong>of</strong> survey respondents participat<strong>in</strong>g <strong>in</strong> H<strong>in</strong>gham Senior Centeractivities, by age group60%50%40%30%20%10%0%Age 45-49 50-54 55-59 60-64 65-69 70-74 75-79 80-84 85+Source: <strong>Town</strong> <strong>of</strong> H<strong>in</strong>gham Department <strong>of</strong> Elder Services Survey <strong>of</strong> Residents Age 45 & Over, 2012A sizable share <strong>of</strong> the respondents has limited knowledge about the Senior Center, especiallyamong younger age groups. When asked "How familiar are you with the H<strong>in</strong>gham Senior Center?"44% <strong>of</strong> the Seniors and 83% <strong>of</strong> the Boomers say that they know "very little" about H<strong>in</strong>gham SeniorCenter programm<strong>in</strong>g. Overall, 10% <strong>of</strong> the Boomers and 52% <strong>of</strong> the Seniors report either hav<strong>in</strong>gparticipated or know<strong>in</strong>g "quite a bit" about Senior Center programm<strong>in</strong>g (see Figure 32). As shown<strong>in</strong> Figure 33, residents <strong>of</strong> L<strong>in</strong>den Ponds and Allerton House typically report that they know “verylittle” about the Senior Center. Seniors liv<strong>in</strong>g elsewhere <strong>in</strong> the community are far less likely toreport know<strong>in</strong>g little about programm<strong>in</strong>g, with just 30-35% <strong>of</strong> those aged 70 and older <strong>of</strong>fer<strong>in</strong>gthis response. However, work<strong>in</strong>g to build greater awareness <strong>of</strong> Senior Center programs and43
services throughout the community may be helpful, especially among the Boomer and youngSenior populations who may benefit from the Senior Center with<strong>in</strong> the next several years.Figure 32: Knowledge <strong>of</strong> H<strong>in</strong>gham Senior Center, by age groupSeniors35% 17%44%Boomers83%ParticipatesHH member participatesKnows quite a bitKnows very little0% 20% 40% 60% 80% 100%Source: <strong>Town</strong> <strong>of</strong> H<strong>in</strong>gham Department <strong>of</strong> Elder Services Survey <strong>of</strong> Residents Age 45 & Over, 2012Figure 33: Percentage know<strong>in</strong>g “very little” about H<strong>in</strong>gham Senior Center100%90%80%70%60%50%40%30%20%10%0%Age45-49Age50-54Age55-59Age60-64Age65-69Age70-74Age75-79Age80+Other residents <strong>of</strong> H<strong>in</strong>ghamResidents <strong>of</strong> L<strong>in</strong>den Pondsor Allerton HouseSource: <strong>Town</strong> <strong>of</strong> H<strong>in</strong>gham Department <strong>of</strong> Elder Services Survey <strong>of</strong> Residents Age 45 & Over, 2012Respondents were asked to evaluate the importance <strong>of</strong> each <strong>of</strong> ten clusters <strong>of</strong> activities andservices currently provided through the H<strong>in</strong>gham Senior Center, rat<strong>in</strong>g each as "not veryimportant," "somewhat important," or "very important" (see Table 7). All program categoriesreceive support, with the strongest support be<strong>in</strong>g reported for fitness classes (71%), recreationaland cultural programs (71%), pr<strong>of</strong>essional services (67%), and health and wellness programs(65%). The strongest level <strong>of</strong> support across the board is reported by Boomers, very few <strong>of</strong> whom44
had participated <strong>in</strong> any Senior Center activities. This pattern suggests broad community supportfor the programs, <strong>in</strong>clud<strong>in</strong>g but not limited to participants.Table 7: Percent rat<strong>in</strong>g activities and services currently <strong>of</strong>fered by the H<strong>in</strong>gham Senior Center as“very important” or “somewhat important”Age 45-59 Age 60+ TotalFitness classes 82% 66% 71%Recreational and cultural programs, such as art classes, movies, andtripsPr<strong>of</strong>essional services, such as tax preparation, legal service, andhealth <strong>in</strong>surance counsel<strong>in</strong>g (SHINE)78% 68% 71%77% 63% 67%Health & wellness programs, such as blood pressure cl<strong>in</strong>ics,acupuncture, and reflexologyTransportation services to medical appo<strong>in</strong>tments, errands, or socialout<strong>in</strong>gs76% 61% 65%75% 58% 63%Volunteer opportunities at the Senior Center 70% 58% 61%Support services, such as help with home repairs and property taxwork-<strong>of</strong>f programsCommunity education or Life-Long Learn<strong>in</strong>g Programs, <strong>in</strong>clud<strong>in</strong>g jobskills tra<strong>in</strong><strong>in</strong>g programs (Wisdom Works)73% 57% 61%71% 54% 60%Support groups 71% 53% 59%Social and human services, such as fuel assistance, <strong>in</strong>formation andreferrals63% 48% 57%Meal programs, such as lunches at the Senior Center and Meals on 70% 46% 54%WheelsSource: <strong>Town</strong> <strong>of</strong> H<strong>in</strong>gham Department <strong>of</strong> Elder Services Survey <strong>of</strong> Residents Age 45 & Over, 2012Respondents were asked to identify other programs or services that the H<strong>in</strong>gham Senior Centercould <strong>of</strong>fer that would benefit them either currently or <strong>in</strong> the future. Relatively few respondentsmentioned any programm<strong>in</strong>g additions. Additions mentioned by more than 10 respondents arethe follow<strong>in</strong>g:help with f<strong>in</strong>ances, taxes, legal or <strong>in</strong>surance issuesadditional clubs and educational classeshelp f<strong>in</strong>d<strong>in</strong>g home assistance and assistance with yard work or jobs around the houseadditional exercise or fitness programsadditional socialization programs.45
Respondents were asked if they had experienced any problems when access<strong>in</strong>g Senior Centerprograms. Few respondents checked any <strong>of</strong> the listed problems. However, nearly one <strong>in</strong> fiveSeniors noted lack <strong>of</strong> park<strong>in</strong>g as a problem. The only other challenge mentioned by more than afew people is “I don’t know what is available,” mentioned by 8% <strong>of</strong> the Seniors.An additional survey question asked about other local senior programs, services, or activities <strong>in</strong>which respondents participate. Lead<strong>in</strong>g responses <strong>in</strong>cluded fitness activities, activities at L<strong>in</strong>denPonds, activities through religious congregations (<strong>in</strong>clud<strong>in</strong>g volunteer<strong>in</strong>g), and clubs or voluntaryassociations.Concerns for the FutureRespondents were asked "What are your greatest concerns about liv<strong>in</strong>g <strong>in</strong> H<strong>in</strong>gham as you growolder?" A range <strong>of</strong> responses were provided by respondents. Many <strong>of</strong> the concerns echo thethemes developed elsewhere <strong>in</strong> this report: the expense <strong>of</strong> stay<strong>in</strong>g <strong>in</strong> the community, the concernthat transportation options will be unavailable or <strong>in</strong>sufficient, and the desire to rema<strong>in</strong> active andengaged with social networks and community activities. Notably, the concerns expressedhighlight the <strong>in</strong>terrelationship <strong>of</strong> many themes—the connection between transportation andaccess to services, and between cost <strong>of</strong> liv<strong>in</strong>g and ability to ma<strong>in</strong>ta<strong>in</strong> one’s home adequately.Commonly mentioned concerns, along with a few quotes from the surveys, are outl<strong>in</strong>ed below.Taxes and other expenses. The most frequently mentioned concerns by far relate to theexpense <strong>of</strong> liv<strong>in</strong>g <strong>in</strong> H<strong>in</strong>gham, especially on a fixed <strong>in</strong>come. While some respondents specificallymention taxes or hous<strong>in</strong>g costs, others refer more broadly to the cost <strong>of</strong> liv<strong>in</strong>g relative to stagnant<strong>in</strong>comes. As examples:“The cost <strong>of</strong> liv<strong>in</strong>g here exceeds my <strong>in</strong>come. My daughter gives me money to make endsmeet.” (Female, age 90)“That I will be able to afford to stay where 6 generations <strong>of</strong> my family have lived.” (Female,age 75)“Property taxes and be<strong>in</strong>g able to afford to stay <strong>in</strong> H<strong>in</strong>gham.” (Male, age 79)“Hav<strong>in</strong>g the fiscal means to pay taxes and ma<strong>in</strong>ta<strong>in</strong> a reasonable lifestyle. Our childrencannot afford H<strong>in</strong>gham.” (Female, age 62)Transportation. Next to the expense <strong>of</strong> ag<strong>in</strong>g <strong>in</strong> place, transportation is mentioned mostfrequently. Concerns about no longer be<strong>in</strong>g able to drive, los<strong>in</strong>g the <strong>in</strong>dependence and ease <strong>of</strong>access to activities that driv<strong>in</strong>g <strong>of</strong>fers, and uncerta<strong>in</strong>ty about public transportation options areexpressed by many respondents. For example:“How will I get around for errands and social activities when I can no longer drive?”(Female, age 52)“Gett<strong>in</strong>g to the doctor and shop if my son wasn’t here.” ( Female, age 90)“Transportation: ma<strong>in</strong>ta<strong>in</strong><strong>in</strong>g relationships, and access<strong>in</strong>g health care.” (Male, age 48).46
“Gett<strong>in</strong>g to stores and other places that are mov<strong>in</strong>g farther away from H<strong>in</strong>gham Squareand Center.” (Female, age 54)Lonel<strong>in</strong>ess, social engagement, and isolation. Another set <strong>of</strong> concerns related toanticipated lonel<strong>in</strong>ess and isolation as family members and friends die or move away. Theseconcerns stem from an awareness <strong>of</strong> the potential for shr<strong>in</strong>k<strong>in</strong>g social networks with age,challenges with transportation, and other factors that may impact the ability to socialize andma<strong>in</strong>ta<strong>in</strong> relationships. For example,“(I am concerned about) isolation when I stop work<strong>in</strong>g, and safely liv<strong>in</strong>g alone.” (Female,age 62)“(I am concerned about) w<strong>in</strong>ter, and my ability to stay connected and social.” (Female,age 49)“Too far away from my children who live out <strong>of</strong> state.” (Female, age 86)“Someone to check on me” (Female, age 72)“That my spouse will die and leave me” (Male, age 82)Concerns about hous<strong>in</strong>g and ag<strong>in</strong>g <strong>in</strong> place. <strong>Ag<strong>in</strong>g</strong> <strong>in</strong> place and rema<strong>in</strong><strong>in</strong>g <strong>in</strong>dependentare mentioned as concerns. Many respondents look ahead to a time when they may struggle toma<strong>in</strong>ta<strong>in</strong> upkeep on their homes and yards. Should they become physically unable to providema<strong>in</strong>tenance themselves, they express concerns about be<strong>in</strong>g able to locate and pay for home andlawn services. F<strong>in</strong>d<strong>in</strong>g themselves “overhoused”—that is, liv<strong>in</strong>g <strong>in</strong> a home that is too large for theircurrent needs—is a concern. A number <strong>of</strong> respondents voice concern that opportunities <strong>in</strong>H<strong>in</strong>gham for downsiz<strong>in</strong>g are limited, or too expensive. For example,“Not be<strong>in</strong>g able to rema<strong>in</strong> <strong>in</strong> my own home and care for myself” (Female, age 75)“F<strong>in</strong>d<strong>in</strong>g a condom<strong>in</strong>ium that meets our needs when we decide to sell our s<strong>in</strong>gle familyhome” (Male, age 66)“My house is too big and too much work.” (Female, age 64)Other concerns related to ag<strong>in</strong>g <strong>in</strong> place <strong>in</strong> H<strong>in</strong>gham <strong>in</strong>cluded concerns about traffic andcongestion; access to services; concerns about crime and concerns about weather. As well, thevulnerability associated with potentially decl<strong>in</strong><strong>in</strong>g health and result<strong>in</strong>g needs for support werementioned by a number <strong>of</strong> respondents. For example,“Hav<strong>in</strong>g someone (maybe a pr<strong>of</strong>essional) who would recognize when I can no longerfunction on my own and get help. I have long term care <strong>in</strong>surance … but no one who couldget me <strong>in</strong>to a care facility and take care <strong>of</strong> the <strong>in</strong>surance and other details that I usually domyself.” (Female, age 64)“Gett<strong>in</strong>g m<strong>in</strong>d and body to the end at the same time.” (Female, age 85)The broad range <strong>of</strong> concerns <strong>in</strong>cludes issues that could occur <strong>in</strong> any sett<strong>in</strong>g and community, suchas decl<strong>in</strong><strong>in</strong>g health and loss <strong>of</strong> a spouse. Others, such as concerns about the adequacy <strong>of</strong>47
transportation options and the affordability <strong>of</strong> taxes, may be addressed at least to some extent bythoughtfully consider<strong>in</strong>g how the community may become more “senior friendly.” L<strong>in</strong>kages amongthemes are considerable: for example, affordability and transportation issues are related stronglyto concerns about access<strong>in</strong>g needed services and ma<strong>in</strong>ta<strong>in</strong><strong>in</strong>g social networks. Worries aboutwhether residents will be able to age <strong>in</strong> place relate to affordability <strong>of</strong> ma<strong>in</strong>ta<strong>in</strong><strong>in</strong>g their homes,and <strong>of</strong> f<strong>in</strong>d<strong>in</strong>g appropriate substitute hous<strong>in</strong>g <strong>in</strong> the area. The prom<strong>in</strong>ent mention <strong>of</strong> economicconcerns highlights the vulnerability that lower <strong>in</strong>comes promote, and the recognition that formany, later life br<strong>in</strong>gs fixed <strong>in</strong>comes and more limited resources.Results from the Focus GroupsTwo focus groups were held to assess the needs <strong>of</strong> seniors liv<strong>in</strong>g <strong>in</strong> H<strong>in</strong>gham as well as to reviewprelim<strong>in</strong>ary results from the demographic and survey analyses. The first group was composed <strong>of</strong>representatives from service providers and other community organizations. The second group wascomposed <strong>of</strong> community members aged 45 and over.Focus Group 1: Service Provider & Community Organization RepresentativesThe first focus group was comprised <strong>of</strong> representatives from a variety <strong>of</strong> community organizations<strong>in</strong>clud<strong>in</strong>g: visit<strong>in</strong>g nurse associations (VNA), the Hous<strong>in</strong>g Authority, <strong>Town</strong> Offices/Committees—Advisory Council, Community Plann<strong>in</strong>g, Recreation and Veterans’ Services—and a local church.Overall, the group described a collaborative and positive relationship between their organizationsand the Department <strong>of</strong> Elder Services.A number <strong>of</strong> transportation issues were noted by members <strong>of</strong> the group. Participants po<strong>in</strong>ted outthat people can become homebound quickly follow<strong>in</strong>g a decl<strong>in</strong>e <strong>in</strong> health (e.g. cognitive decl<strong>in</strong>e),because they become isolated and need support, but don’t get it partially due to transportationchallenges. This cycle <strong>of</strong> health, transportation challenges and isolation was echoed by others <strong>in</strong>the group. The schedul<strong>in</strong>g and distance <strong>of</strong> travel were identified as important aspects <strong>of</strong>transportation options that are challeng<strong>in</strong>g. For example, one participant mentioned that theDepartment <strong>of</strong> Elder Services does have vans but that they only travel locally. Many H<strong>in</strong>ghamresidents have medical appo<strong>in</strong>tments <strong>in</strong> Boston but have few options to get there. Volunteertransport is <strong>of</strong>ten not will<strong>in</strong>g to go to Boston. Schedul<strong>in</strong>g alternate transportation was alsomentioned as be<strong>in</strong>g challeng<strong>in</strong>g. The times available do not always match with the needs <strong>of</strong>elders, and schedul<strong>in</strong>g is <strong>of</strong>ten required weeks <strong>in</strong> advance <strong>of</strong> the appo<strong>in</strong>tment. One participantmentioned try<strong>in</strong>g to avoid hav<strong>in</strong>g seniors be<strong>in</strong>g driven to appo<strong>in</strong>tments by their peers or nonauthorized<strong>in</strong>dividuals because <strong>of</strong> the liability concerns, but reported that this sometimes occursanyway <strong>in</strong> emergency situations.Caregiv<strong>in</strong>g was also mentioned as an important issue. Participants reported that most peopledon’t even identify themselves as a “caregiver,” and that us<strong>in</strong>g this term without proper def<strong>in</strong>itionis part <strong>of</strong> the problem <strong>in</strong> provid<strong>in</strong>g support to caregivers. For example, a person may help hermother weekly with basic tasks yet not identify herself as be<strong>in</strong>g a “caregiver”—just a daughterfulfill<strong>in</strong>g her responsibilities. One participant suggested that there will never be enough support forcaregivers and that caregiver support should be a target for outreach. This same group memberruns an Alzheimer’s Disease (AD) caregiver group which <strong>in</strong>cludes many H<strong>in</strong>gham participants. Oneth<strong>in</strong>g she notices is that even though H<strong>in</strong>gham participants <strong>of</strong>ten have more f<strong>in</strong>ancial resourcesthan the average client, care for a loved one with AD is so costly that it dra<strong>in</strong>s family membersboth f<strong>in</strong>ancially and emotionally. Obta<strong>in</strong><strong>in</strong>g sufficient resources to get help for respite is difficult.Adult day health or private hire help is encouraged but people worry about the expense. Outreach48
to younger residents who could volunteer on behalf <strong>of</strong> seniors, perhaps residents who are homewhile their children are <strong>in</strong> school, may be helpful.Some specific hous<strong>in</strong>g issues were mentioned. The need for affordable hous<strong>in</strong>g is <strong>in</strong>creas<strong>in</strong>g: forexample, Thaxter Park has over 200 people on a wait<strong>in</strong>g list (not all <strong>of</strong> these <strong>in</strong>dividuals arecurrently liv<strong>in</strong>g <strong>in</strong> H<strong>in</strong>gham). One group member predicted that the hous<strong>in</strong>g issues will cont<strong>in</strong>ue tobe significant <strong>in</strong> the years to come, as ris<strong>in</strong>g medical and hous<strong>in</strong>g costs place <strong>in</strong>creased demandson seniors’ budgets. Another group member mentioned a number <strong>of</strong> issues that concern residents<strong>in</strong> Thaxter Park, <strong>in</strong>clud<strong>in</strong>g <strong>in</strong>sufficient walkways and isolation. Concerns about emergencytransportation for seniors liv<strong>in</strong>g <strong>in</strong> Hous<strong>in</strong>g Authority residences were also voiced.Increas<strong>in</strong>g awareness was cited as a key to improv<strong>in</strong>g elder well-be<strong>in</strong>g <strong>in</strong> H<strong>in</strong>gham. One groupmember expla<strong>in</strong>ed that once a Senior is connected to a resource, he or she may overcome fearand other obstacles to accept<strong>in</strong>g help. A broad fear <strong>of</strong> be<strong>in</strong>g put <strong>in</strong> a nurs<strong>in</strong>g home was discussedas a barrier to participat<strong>in</strong>g <strong>in</strong> Senior Center activities and us<strong>in</strong>g services. Middle-aged adults wereidentified as be<strong>in</strong>g a market to be targeted with educational material about the services availableto them as caregivers and for those older adults that they support. It was said by one groupmember that middle-aged residents are overwhelmed and can’t f<strong>in</strong>d out what’s available <strong>in</strong> thecommunity. Ideas for market<strong>in</strong>g were also discussed, <strong>in</strong>clud<strong>in</strong>g blogs, putt<strong>in</strong>g <strong>in</strong>formation <strong>in</strong> taxbills, or hir<strong>in</strong>g market<strong>in</strong>g consultants.Focus Group 2: Community MembersThe second focus group was composed <strong>of</strong> community members aged 45 and over. Most <strong>of</strong> these<strong>in</strong>dividuals had lived <strong>in</strong> H<strong>in</strong>gham for many years (25-50 years <strong>of</strong> residency). They describedH<strong>in</strong>gham as be<strong>in</strong>g a great place to live and a raise a family.The group was surprised by the number <strong>of</strong> survey participants who reported know<strong>in</strong>g “not much”about the Senior Center. Group members felt that the Senior Center gets a lot <strong>of</strong> publicity,particularly via word <strong>of</strong> mouth, and that the programs are widely known. Members <strong>of</strong> the groupenjoy the newsletter, feel that it <strong>in</strong>cludes a wealth <strong>of</strong> good <strong>in</strong>formation, and has widedissem<strong>in</strong>ation. The group shared ideas for expand<strong>in</strong>g awareness <strong>of</strong> the Senior Center and itsprograms, <strong>in</strong>clud<strong>in</strong>g supplement<strong>in</strong>g the familiar newsletter with use <strong>of</strong> electronic media. Severalparticipants suggested that the Senior Center create a Facebook page that would appeal to themany computer-literate Seniors as well as Boomers who use this technology. Participants alsoacknowledged that the stigma <strong>of</strong> seek<strong>in</strong>g out and us<strong>in</strong>g services target<strong>in</strong>g so-called “seniors” maykeep some residents from participat<strong>in</strong>g <strong>in</strong> or learn<strong>in</strong>g more about Senior Center programs thatthey might enjoy and benefit from.Transportation was cited by this group as a very important issue for older residents. Whileparticipants mentioned that the Senior Center does a good job <strong>of</strong>fer<strong>in</strong>g transportation, they alsonoted that it is limited <strong>in</strong> its capacity to serve the grow<strong>in</strong>g population need<strong>in</strong>g alternativetransportation. The group agreed that both a lack <strong>of</strong> flexibility and availability <strong>of</strong> transportation forolder adults <strong>in</strong> H<strong>in</strong>gham is an issue. They noted that more paid drivers are needed, becausevolunteer drivers can be used for social events and trips but are not capable <strong>of</strong> provid<strong>in</strong>g medicaltransportation.The group also cited high real estate taxes and other expenses—fuel for home heat<strong>in</strong>g, as anexample—as creat<strong>in</strong>g challenges for residents to stay <strong>in</strong> their homes comfortably. The number <strong>of</strong>H<strong>in</strong>gham residents who are characterized as be<strong>in</strong>g “house rich and cash poor” is <strong>in</strong>creas<strong>in</strong>g, <strong>in</strong>this group’s judgment. And although various forms <strong>of</strong> tax abatement are available, these49
mechanisms were described by the group as be<strong>in</strong>g good programs but not as well known as theycould be.The group agreed that H<strong>in</strong>gham is a very supportive community, with good neighborhoods, whichmay account for the low level <strong>of</strong> isolation reported <strong>in</strong> the community survey. Yet they agreed thateven the few that are identified as isolated should be <strong>of</strong> concern. A challenge for the SeniorCenter mov<strong>in</strong>g forward is expla<strong>in</strong><strong>in</strong>g to the larger community what the Senior Center <strong>of</strong>fers. Groupmembers noted that Senior Centers are sometimes seen as “fluff”—a service that is nice to have,but not required—and that it is important to make the case for the value <strong>of</strong> the Senior Center tothe community. The group speculated that be<strong>in</strong>g social and active is beneficial for mental healthand healthy ag<strong>in</strong>g—one example <strong>of</strong> how benefits <strong>of</strong> the Senior Center could be highlighted.Results from the Key Informant InterviewsOne-on-one <strong>in</strong>terviews were conducted with members <strong>of</strong> six <strong>Town</strong> <strong>of</strong>fices and organizations: Mr.Ted Alexiades, the <strong>Town</strong> Adm<strong>in</strong>istrator; Mr. Bruce Rabuffo from the Board <strong>of</strong> Selectmen; ChiefPera<strong>in</strong>o and Deputy Chief Olsson from the Police Department; Chief Duff from the FireDepartment; Ms. Kathy Crowley, Public Health Nurse; and Ms. Susan Kiernan, from the H<strong>in</strong>ghamInterfaith Food Pantry. Each <strong>of</strong> these <strong>in</strong>dividuals generously shared their time and <strong>in</strong>sights withthe researcher dur<strong>in</strong>g <strong>in</strong>terviews that lasted an hour or more.The purpose <strong>of</strong> conduct<strong>in</strong>g these <strong>in</strong>terviews was to ga<strong>in</strong> additional perspective on the impact <strong>of</strong>the ag<strong>in</strong>g <strong>of</strong> H<strong>in</strong>gham’s population on the community as a whole and to learn about how thecommunity is respond<strong>in</strong>g to the shift<strong>in</strong>g age composition. Additional goals were to obta<strong>in</strong> <strong>in</strong>put onhow other organizations <strong>in</strong> H<strong>in</strong>gham perceive the role played by the Department <strong>of</strong> Elder Services,and to identify any opportunities for the <strong>Town</strong> to improve its efforts to meet the needs <strong>of</strong> Seniors<strong>in</strong> the community. Table 8 outl<strong>in</strong>es some <strong>of</strong> the unique ways <strong>in</strong> which the ag<strong>in</strong>g <strong>of</strong> the populationimpacts each organization, as described by the <strong>in</strong>formant. The summarization <strong>in</strong> this table isgenerated by the researcher based on the <strong>in</strong>terview and is not a verbatim quote from the<strong>in</strong>formant. Each town <strong>of</strong>ficial describes ways <strong>in</strong> which the ag<strong>in</strong>g <strong>of</strong> H<strong>in</strong>gham’s population hasimpacted his or her <strong>of</strong>fice, the <strong>Town</strong>, and/or the work that they do. The impact <strong>of</strong> thedemographic shifts <strong>in</strong> H<strong>in</strong>gham has been realized by <strong>Town</strong> organizations <strong>in</strong> somewhat uniqueways.Several cross-cutt<strong>in</strong>g themes are drawn from the <strong>in</strong>terviews. A summary <strong>of</strong> these themes follows:Economic challenges and transportation barriers are key issues fac<strong>in</strong>g H<strong>in</strong>gham’s Seniors.Two key issues fac<strong>in</strong>g Seniors <strong>in</strong> H<strong>in</strong>gham were highlighted by the key <strong>in</strong>formants: economicconcerns and transportation. These issues echo results from the community survey. Economicchallenges for seniors occur on two levels: at the macro level, broad economic challenges havethreatened the well-be<strong>in</strong>g <strong>of</strong> some seniors liv<strong>in</strong>g on fixed <strong>in</strong>comes, while changes to Medicare andthe health care delivery system have resulted <strong>in</strong> greater difficulty pay<strong>in</strong>g for medical expenses. Atthe community level, the home values <strong>in</strong> H<strong>in</strong>gham and associated property tax expenses placef<strong>in</strong>ancial pressure on those with fixed <strong>in</strong>comes as well. Transportation was also noted as an issuefor seniors <strong>in</strong> H<strong>in</strong>gham. Few viable alternatives to self-driv<strong>in</strong>g exist <strong>in</strong> H<strong>in</strong>gham, and the availableoptions can be expensive. The <strong>in</strong>ability to f<strong>in</strong>d or afford transportation prevents some seniors fromaccess<strong>in</strong>g needed services (such as com<strong>in</strong>g to the Food Pantry), participat<strong>in</strong>g <strong>in</strong> the community50
Table 8: Summary <strong>of</strong> ways <strong>in</strong> which H<strong>in</strong>gham’s ag<strong>in</strong>g population shapes the <strong>Town</strong> and<strong>Town</strong> <strong>of</strong>fices<strong>Town</strong> <strong>of</strong>fice or organization Summarization: How the ag<strong>in</strong>g <strong>of</strong> H<strong>in</strong>gham’s population has impactedthis <strong>of</strong>fice and the <strong>Town</strong><strong>Town</strong> Adm<strong>in</strong>istratorBoard <strong>of</strong> SelectmenPolice DepartmentFire Department<strong>Town</strong> NurseInterfaith Food PantryThe ag<strong>in</strong>g <strong>of</strong> the community impacts many town issues and <strong>of</strong>fices, notjust senior services. The ag<strong>in</strong>g <strong>of</strong> the population is ideally taken <strong>in</strong>toconsideration as a matter <strong>of</strong> course <strong>in</strong> <strong>Town</strong> decision-mak<strong>in</strong>g. Forexample, does a grow<strong>in</strong>g senior population have implications for thedesign <strong>of</strong> valued <strong>Town</strong> amenities? Seniors are resources who playcritical volunteer roles and contribute extensively to town leadership.The ag<strong>in</strong>g <strong>of</strong> H<strong>in</strong>gham’s population has broad implications for the<strong>Town</strong>. Respond<strong>in</strong>g to this issue, and provid<strong>in</strong>g needed services, mustbe considered with<strong>in</strong> the context <strong>of</strong> how to ma<strong>in</strong>ta<strong>in</strong> H<strong>in</strong>gham as acommunity that is strong and economically viable mov<strong>in</strong>g forward.Thoughtful consideration <strong>of</strong> how best to meet needs, and openness toa broad range <strong>of</strong> strategies, is important.The Police Department has experienced an <strong>in</strong>crease <strong>in</strong> service callsassociated with the ag<strong>in</strong>g population. Some <strong>of</strong> this is l<strong>in</strong>ked to largenew hous<strong>in</strong>g developments <strong>in</strong> the community, but much <strong>of</strong> the<strong>in</strong>crease occurs broadly throughout the community. Examples <strong>of</strong>issues on the upsw<strong>in</strong>g <strong>in</strong>clude scams target<strong>in</strong>g seniors; driv<strong>in</strong>gconcerns <strong>in</strong>volv<strong>in</strong>g seniors; and issues result<strong>in</strong>g from the isolation <strong>of</strong>some seniors, especially those liv<strong>in</strong>g alone without children <strong>in</strong> thearea.EMS calls have <strong>in</strong>creased considerably. Some <strong>in</strong>crease <strong>in</strong> callsrelat<strong>in</strong>g to older people fall<strong>in</strong>g is also noted.Increased demands on public health nurs<strong>in</strong>g are observed. Servicesgeared toward seniors, such as specialized flu cl<strong>in</strong>ics, as well asprograms <strong>of</strong>fered <strong>in</strong> collaboration with the Senior Center, are noted.Additional issues observed are mental health issues and limitationsamong some seniors that threaten their ability to stay home safely.An <strong>in</strong>crease <strong>in</strong> use <strong>of</strong> the Food Pantry is noted across the board. Olderpeople represent a sizable share <strong>of</strong> their clientele, but the relativeshare <strong>of</strong> their clients who are older has rema<strong>in</strong>ed stable.(such as tak<strong>in</strong>g advantage <strong>of</strong> socialization opportunities at the Senior Center), or obta<strong>in</strong><strong>in</strong>gneeded medical care. As a result, transportation barriers can lead to a cascade <strong>of</strong> difficulties forseniors, <strong>in</strong>clud<strong>in</strong>g social isolation, food <strong>in</strong>security, and poor management <strong>of</strong> health conditions. Inone <strong>in</strong>terview, the town <strong>of</strong>ficial describes an example: an older community member needed dentalcare for a pa<strong>in</strong>ful tooth. She was unable to drive herself; her daughter had to work and could nottake her to the dentist; and a taxi was out <strong>of</strong> reach for her f<strong>in</strong>ancially. With no affordable51
alternatives for transportation, this woman had to schedule her dental work for a time when herdaughter could drive her, and struggled through another week <strong>in</strong> pa<strong>in</strong>.<strong>Town</strong> <strong>of</strong>fices and organizations work effectively together to support the older population.Without exception, each <strong>in</strong>terviewed <strong>Town</strong> <strong>of</strong>ficial described strong and effective work<strong>in</strong>grelationships with the Department <strong>of</strong> Elder Services staff. The <strong>in</strong>formants discussed relationshipswith specific <strong>in</strong>dividuals <strong>in</strong> Elder Services, and described specific examples <strong>in</strong> which their <strong>of</strong>ficeshad worked well together. Communicat<strong>in</strong>g across <strong>of</strong>fices to address residents’ concerns appearsto be the norm <strong>in</strong> H<strong>in</strong>gham; many <strong>of</strong> the <strong>in</strong>terview subjects ascribe this to the community culture,which values strong community participation and support. The <strong>Town</strong> Adm<strong>in</strong>istrator highlights thiscross-<strong>of</strong>fice collaboration as a valued goal, and describes ways he has supported this (e.g.,<strong>in</strong>vit<strong>in</strong>g staff from several different <strong>Town</strong> <strong>of</strong>fices to serve together on committees). Severalexamples <strong>of</strong> the value <strong>of</strong> this communication and awareness were <strong>of</strong>fered <strong>in</strong> conversation. Forexample, members <strong>of</strong> the Police Department described the popular Citizens Police Academyprogram they <strong>of</strong>fer. Many <strong>of</strong> the participants <strong>in</strong> this program are seniors, and Senior Center spaceis used for some <strong>of</strong> the events. As another example, the Fire Chief described his positiveexperience with the property tax work-<strong>of</strong>f program, which is adm<strong>in</strong>istered by Elder Services. TheFire Department has saved money and benefitted from the experience and skills <strong>of</strong> the supportthey have obta<strong>in</strong>ed through that program.The Department <strong>of</strong> Elder Services is well known and work<strong>in</strong>g effectively, but faces somechallenges. Each <strong>of</strong> the <strong>in</strong>formants reported favorably on the performance <strong>of</strong> the Department <strong>of</strong>Elder Services with<strong>in</strong> the community. From these <strong>in</strong>dividuals’ perspectives, Elder Services plays avalued leadership role <strong>in</strong> address<strong>in</strong>g the issues and concerns <strong>of</strong> seniors <strong>in</strong> the community. Several<strong>of</strong>ficials specifically mentioned the multifaceted role played by the Department <strong>of</strong> Elder Services,cit<strong>in</strong>g both the social service aspect <strong>of</strong> its mission (e.g., provid<strong>in</strong>g <strong>in</strong>formation and referral;provid<strong>in</strong>g transportation services) as well as the broad activity and programmatic aspects (e.g.,<strong>of</strong>fer<strong>in</strong>g fitness and educational programs designed for seniors). Some specific challenges for theDepartment <strong>of</strong> Elder Services were cited. One <strong>in</strong>formant suggested that <strong>in</strong>adequate space andpark<strong>in</strong>g formed obstacles for expansion <strong>of</strong> Elder Services’ programm<strong>in</strong>g. Staff<strong>in</strong>g shortfalls,especially around transportation services, were also mentioned as challenges.H<strong>in</strong>gham has a strong commitment to valu<strong>in</strong>g and support<strong>in</strong>g Seniors <strong>in</strong> the community.Many <strong>of</strong> the <strong>in</strong>dividuals <strong>in</strong>terviewed have been work<strong>in</strong>g and liv<strong>in</strong>g <strong>in</strong> H<strong>in</strong>gham for many years. Thecore values <strong>of</strong> volunteerism, neighborl<strong>in</strong>ess, and collective support for community members arestrong among these <strong>in</strong>dividuals and the organizations they represent. They highlight theimportance <strong>of</strong> facilitat<strong>in</strong>g opportunities for residents <strong>of</strong> all ages to be <strong>in</strong>volved <strong>in</strong> communitydecision-mak<strong>in</strong>g as a key step <strong>in</strong> ensur<strong>in</strong>g that residents’ needs are met. Despite theirunanimous commitment to seniors ag<strong>in</strong>g <strong>in</strong> H<strong>in</strong>gham, these <strong>in</strong>formants <strong>of</strong>fered no commonunderstand<strong>in</strong>g about how best to generate and ma<strong>in</strong>ta<strong>in</strong> H<strong>in</strong>gham as a community that effectivelysupports an expand<strong>in</strong>g Senior population. Some <strong>Town</strong> <strong>of</strong>fices anticipate grow<strong>in</strong>g demands forservices that may stra<strong>in</strong> available resources. Others suggest that new ways <strong>of</strong> deliver<strong>in</strong>gnecessary services may need to be devised. Balanc<strong>in</strong>g demands for services among different<strong>Town</strong> constituencies, while adher<strong>in</strong>g to H<strong>in</strong>gham’s core values and ma<strong>in</strong>ta<strong>in</strong><strong>in</strong>g a strong f<strong>in</strong>ancialfoot<strong>in</strong>g for the <strong>Town</strong>, may require thoughtful decision-mak<strong>in</strong>g and be<strong>in</strong>g open to explor<strong>in</strong>g newways <strong>of</strong> provid<strong>in</strong>g services to the community. Learn<strong>in</strong>g more about the evolv<strong>in</strong>g composition <strong>of</strong>the Senior population is an important step <strong>in</strong> this process.52
V. Summary and RecommendationsH<strong>in</strong>gham has experienced substantial growth <strong>in</strong> its older population over the last ten years. Thesizable segment <strong>of</strong> the population currently <strong>in</strong> the "Boomer" years signals a cont<strong>in</strong>ued ag<strong>in</strong>g <strong>of</strong> thepopulation <strong>in</strong> the com<strong>in</strong>g decade. As revealed by the community survey conducted for H<strong>in</strong>ghamElder Services, Boomers and Seniors <strong>in</strong> H<strong>in</strong>gham report a strong commitment to ag<strong>in</strong>g <strong>in</strong> place.This is good news—but how will the <strong>Town</strong> respond?The research presented <strong>in</strong> this report suggests that H<strong>in</strong>gham <strong>of</strong>fers many advantages for ag<strong>in</strong>g <strong>in</strong>place. A large share <strong>of</strong> the Senior and Boomer population is committed to stay<strong>in</strong>g <strong>in</strong> thecommunity, and has <strong>in</strong> place the resources and supports necessary to do so. Yet segments <strong>of</strong> theolder population experience health challenges, gaps <strong>in</strong> social networks, or affordability concernsthat threaten their ability to stay. Older residents who are economically secure and physicallyactive at the present time are keenly aware that the com<strong>in</strong>g years may br<strong>in</strong>g economic shortfallsor mobility losses that would make it difficult to rema<strong>in</strong> <strong>in</strong> H<strong>in</strong>gham, given its high cost <strong>of</strong> liv<strong>in</strong>gand limited transportation options.H<strong>in</strong>gham Elder Services provides a range <strong>of</strong> services and programs that provide support toseniors, and a large share <strong>of</strong> older H<strong>in</strong>gham residents participate <strong>in</strong> the Senior Center. Many <strong>of</strong>the oldest residents (aged 80+) live <strong>in</strong> communities that <strong>of</strong>fer transportation and services (e.g.,L<strong>in</strong>den Ponds) and as a result, do not rely heavily on the Senior Center. Yet high levels <strong>of</strong>participation are reported by other residents, especially those aged 70 and older. Based on theexpected growth <strong>in</strong> the senior population <strong>in</strong> H<strong>in</strong>gham, these participation rates are likely to result<strong>in</strong> expanded demands on H<strong>in</strong>gham Elder Services <strong>in</strong> the near future. Current space and park<strong>in</strong>gavailability, already deemed <strong>in</strong>adequate by some respondents <strong>in</strong> this study, may be stretched wellbeyond their limits.In develop<strong>in</strong>g new programs, or expand<strong>in</strong>g exist<strong>in</strong>g ones, H<strong>in</strong>gham Elder Services may wish toconsider the relatively sizable share <strong>of</strong> the community survey respondents who report hav<strong>in</strong>gcaregiv<strong>in</strong>g responsibilities. One way <strong>in</strong> which H<strong>in</strong>gham Elder Services can support the seniorpopulation is by serv<strong>in</strong>g as a resource for caregivers, <strong>in</strong>clud<strong>in</strong>g those who are not yet aged 60.These <strong>in</strong>dividuals may benefit from receiv<strong>in</strong>g <strong>in</strong>formation about supplemental care support, suchas adult day care and respite care. Other services that may warrant expansion <strong>in</strong>clude a registryfor bus<strong>in</strong>esses and other organizations that will provide home and yard ma<strong>in</strong>tenance for seniorson a volunteer or low-fee basis. Expanded options for senior transportation, <strong>in</strong>clud<strong>in</strong>g bothmedical and non-medical transportation with<strong>in</strong> H<strong>in</strong>gham as well as to Boston, are frequently citedneeds <strong>in</strong> our data collection. Because many residents, especially those under age 60, are not well<strong>in</strong>formed about <strong>Town</strong>-provided services and programs, H<strong>in</strong>gham Elder Services may wish to seekadditional opportunities to make younger residents aware <strong>of</strong> its programs, possibly <strong>in</strong>clud<strong>in</strong>gsupplement<strong>in</strong>g its current newsletter and other advertis<strong>in</strong>g strategies with outreach through socialmedia.The implications <strong>of</strong> an ag<strong>in</strong>g population span far beyond the scope <strong>of</strong> H<strong>in</strong>gham Elder Services.Virtually all aspects <strong>of</strong> community life will be affected by cont<strong>in</strong>ued growth <strong>of</strong> the seniorpopulation, <strong>in</strong>clud<strong>in</strong>g hous<strong>in</strong>g, bus<strong>in</strong>esses, and recreation as well as other <strong>Town</strong> <strong>of</strong>fices. H<strong>in</strong>ghamseniors benefit from a positive culture <strong>of</strong> cross-department communication, with the result thatmany <strong>Town</strong> <strong>of</strong>fices <strong>in</strong>corporate recognition <strong>of</strong> the grow<strong>in</strong>g Senior population <strong>in</strong> their plann<strong>in</strong>g, andwork together to make H<strong>in</strong>gham “senior friendly.” Moreover, community leaders and residentsidentify seniors as a positive resource for the town, consistent with the high value attached to53
volunteerism <strong>in</strong> H<strong>in</strong>gham. Strengthen<strong>in</strong>g opportunities for seniors to participate <strong>in</strong> the community,through the Senior Center as well as through other organizations, may be beneficial.More broadly, the community <strong>of</strong> H<strong>in</strong>gham may wish to consider a number <strong>of</strong> ways <strong>in</strong> which thetown can respond to its ag<strong>in</strong>g demographic pr<strong>of</strong>ile. The ris<strong>in</strong>g cost <strong>of</strong> liv<strong>in</strong>g, concerns aboutobta<strong>in</strong><strong>in</strong>g and ma<strong>in</strong>ta<strong>in</strong><strong>in</strong>g appropriate hous<strong>in</strong>g, and concerns about transportation are key issuesfor older residents. Additional strategies for ma<strong>in</strong>ta<strong>in</strong><strong>in</strong>g affordability for town residents on fixed<strong>in</strong>come may be explored, <strong>in</strong>clud<strong>in</strong>g thoughtful development <strong>of</strong> affordable hous<strong>in</strong>g. As anotherexample, the <strong>Town</strong> may wish to consider expansion <strong>of</strong> its property tax work-<strong>of</strong>f program.Promot<strong>in</strong>g the wider availability <strong>of</strong> public transportation options as well as Senior Centertransportation services could ease many residents’ concerns about ag<strong>in</strong>g <strong>in</strong> place.VI.ReferencesAARP (2005). Beyond 50.05 A Report to the Nation on Livable Communities: Creat<strong>in</strong>gEnvironments for Successful <strong>Ag<strong>in</strong>g</strong>. Wash<strong>in</strong>gton DC: AARP Public Policy Institute. Available onl<strong>in</strong>e:http://assets.aarp.org/rgcenter/il/beyond_50_communities.pdfNelson, Brittne M. and Terri Guengerich. (2009). Go<strong>in</strong>g from Good to Great: A LivableCommunities Survey <strong>in</strong> Westchester County, New York. Wash<strong>in</strong>gton DC: AARP.Nol<strong>in</strong>, JoAnn, Sharon T. Wilburn, Kenneth T. Wilburn, and Dax Weaver (2006). Health and socialservice needs <strong>of</strong> older adults: Implement<strong>in</strong>g a community-based needs assessment.” Evaluationand Program Plann<strong>in</strong>g, 29, 217-226.Pardasani, M and P Thompson (2012). Senior centers: Innovative and emerg<strong>in</strong>g models. Journal<strong>of</strong> Applied Gerontology, 31, 52-77.Salomon, Nancy (2010). Hous<strong>in</strong>g Solutions to Support <strong>Ag<strong>in</strong>g</strong> <strong>in</strong> Place. AARP Fact Sheet 172,AARP Public Policy Institute. Wash<strong>in</strong>gton DC: AARP.V<strong>in</strong>cent, Grayson K. and Victoria A. Velk<strong>of</strong>f (2010). The Next Four Decades: The Older Population<strong>in</strong> the United States: 2010 to 2050. Current Population Reports, P25-1138. Wash<strong>in</strong>gton DC: U.S.Census Bureau.54
VII.Appendices55
Appendix A: Community SurveyTOWN OF HINGHAM ELDER SERVICESSURVEY OF RESIDENTS AGE 45 & OVERThe town <strong>of</strong> H<strong>in</strong>gham Elder Services would like to learn more about its residents and isask<strong>in</strong>g for your help. By answer<strong>in</strong>g some questions about yourself, your experienceliv<strong>in</strong>g <strong>in</strong> H<strong>in</strong>gham, and your future plans, you are mak<strong>in</strong>g your voice heard. We are<strong>in</strong>terested <strong>in</strong> your honest answers. Please answer all <strong>of</strong> the questions as thoroughly aspossible. All <strong>of</strong> your responses will be kept confidential. Thank you very much. Weappreciate your help.Section A. Current & Future Hous<strong>in</strong>g1. Which best describes your current place <strong>of</strong> residence? (Check one)Condom<strong>in</strong>ium or town houseS<strong>in</strong>gle family homeTwo/three family homeApartment complex, <strong>in</strong>clud<strong>in</strong>g subsidized apartment hous<strong>in</strong>gL<strong>in</strong>den Ponds or Allerton HouseOther: _________________________________2. Do you and/or your spouse own the residence you live <strong>in</strong>?Yes No3. Who do you live with? (Check all that apply)I live aloneWith a spouse/partnerWith my child(ren)With my parent(s)With another relativeWith someone else (<strong>in</strong>clud<strong>in</strong>g housemates)4. Does your current residence need major repairs, modifications, or changes toimprove your ability to live <strong>in</strong> it over the next 5 years?NoYes If yes: Can you afford to make these changes?YesNo56
Section B. Social Activities & Relationships5. About how many friends or relatives do you have whom you could call on forassistance if you needed it?NoneOne or TwoThree or more6. How <strong>of</strong>ten do you talk on the phone, email, or get together with friends or relatives?NeverLess than one day per week1-3 days per week4-7 days per weekSection C. Caregiv<strong>in</strong>g7. Do you provide unpaid care or assistance to a disabled, ill, or elderly spouse,relative, or friend?Yes No If no, please skip to question #10.8. Has the person you provide unpaid care for been diagnosed with dementia or anyother k<strong>in</strong>d <strong>of</strong> memory impairment?Yes No N/A Miss<strong>in</strong>g9. How difficult is it for you to care for this person and meet your other responsibilitieswith family and/or work?Very difficultSomewhat difficultNeither difficult nor easySomewhat easyVery easySection D. Health10. How would you rate your overall health at this time?ExcellentGoodFairPoor11. Do you have a primary care doctor whom you normally see when you have medicalconcerns?Yes No57
12. Do you require help with household activities? For example: do<strong>in</strong>g rout<strong>in</strong>ehousehold chores like clean<strong>in</strong>g or yard work.Yes No13. Do you require help with daily activities? For example: us<strong>in</strong>g the telephone orprepar<strong>in</strong>g your meals, food shopp<strong>in</strong>g, tak<strong>in</strong>g medication, or keep<strong>in</strong>g track <strong>of</strong> bills.Yes No14. Do you require help with personal activities? For example: us<strong>in</strong>g the toilet, tak<strong>in</strong>g abath or shower, or gett<strong>in</strong>g dressed.Yes No15. Referr<strong>in</strong>g to any <strong>of</strong> the activities <strong>in</strong> questions 12 - 14 for which you answered“Yes”: Who helps you with these activities? (Check all that apply)N/A, I don't require any helpI pay someone to help meA friend or neighbor helps meA family member helps meSomeone else helps me (please specify):_________________________I need help but have no one to assist me16. Over the last month, how <strong>of</strong>ten did you feel sad, depressed, or “down <strong>in</strong> thedumps?” (Check one)NeverRarelySometimesOftenAlways17. How many times did you visit a medical doctor or other health care pr<strong>of</strong>essional forany reason, <strong>in</strong> the last 12 months?0 times1 – 2 times3 –4 times5 or more times58
Section E. H<strong>in</strong>gham Elder Services18. The follow<strong>in</strong>g are activities and services currently <strong>of</strong>fered by the H<strong>in</strong>gham ElderServices. Please evaluate the importance <strong>of</strong> each, where “1” is “not very important”and “3” is “very important”. Please circle your response.Activities/Services59not veryimportantsomewhatimportantveryimportantTransportation services to medicalappo<strong>in</strong>tments, errands, or social out<strong>in</strong>gs1 2 3Meal programs, such as lunches at the SeniorCenter and Meals on Wheels1 2 3Support groups 1 2 3Volunteer opportunities at the Senior Center 1 2 3Health and wellness programs, such as bloodpressure cl<strong>in</strong>ics, acupuncture, and reflexology1 2 3Fitness classes 1 2 3Support services, such as help with homerepairs and property tax work-<strong>of</strong>f programs1 2 3Community education or Life-Long Learn<strong>in</strong>gPrograms, <strong>in</strong>clud<strong>in</strong>g job skills tra<strong>in</strong><strong>in</strong>g1 2 3programs (Wisdom Works)Recreational and cultural programs, such as artclasses, movies, and trips1 2 3Pr<strong>of</strong>essional services, such as tax preparation,legal service, and health <strong>in</strong>surance counsel<strong>in</strong>g(SHINE)1 2 319. Th<strong>in</strong>k<strong>in</strong>g <strong>of</strong> your current or future needs, what other programs or services could theH<strong>in</strong>gham Senior Center <strong>of</strong>fer that you th<strong>in</strong>k would benefit you?____________________________________________________________20. Outside <strong>of</strong> the H<strong>in</strong>gham Senior Center, what other local senior programs, servicesor activities do you participate <strong>in</strong>?____________________________________________________________21. How familiar are you with the H<strong>in</strong>gham Senior Center? (Check all that apply)I have participated <strong>in</strong> Senior Center activitiesSomeone else <strong>in</strong> my household has participated <strong>in</strong> Senior Center activitiesI know quite a bit about H<strong>in</strong>gham Senior Center programm<strong>in</strong>g.I know very little about H<strong>in</strong>gham Senior Center programm<strong>in</strong>g.
22. Below is a list <strong>of</strong> problems one could encounter when access<strong>in</strong>g Senior Centerprograms. Which <strong>of</strong> the follow<strong>in</strong>g, if any, have you experienced? (Check all thatapply)Lack <strong>of</strong> transportationLack <strong>of</strong> adequate facilitiesI don’t know what is availableI don’t know how to access theservices or programsInconvenient location <strong>of</strong> theSenior CenterSection F. Community & Neighborhood23. How many years have you lived <strong>in</strong> H<strong>in</strong>gham?:______________24. Do you live <strong>in</strong> H<strong>in</strong>gham year-around?Yes NoLack <strong>of</strong> park<strong>in</strong>gProblem with staffHours <strong>of</strong> Senior Center are<strong>in</strong>convenientN/A, I have not encountered anydifficultiesOther:___________________25. How important is it to you to rema<strong>in</strong> liv<strong>in</strong>g <strong>in</strong> H<strong>in</strong>gham as long as possible?Extremely importantVery importantSomewhat importantNot very importantNot at all important26. Please <strong>in</strong>dicate your level <strong>of</strong> agreement with the follow<strong>in</strong>g statement about yourneighborhood: "This is a neighborhood where I feel safe."Strongly agreeSomewhat agreeNeither agree nor disagreeSomewhat disagreeStrongly disagree27. What are your greatest concerns about liv<strong>in</strong>g <strong>in</strong> H<strong>in</strong>gham as you growolder?_______________________________________________________Section G. Transportation28. The H<strong>in</strong>gham Elder Services provides transportation services <strong>in</strong>clud<strong>in</strong>g medicalrides and local shuttle service. Prior to this survey, were you aware <strong>of</strong> these services?Yes No60
29. Do you drive?No If no, please skip to question #31Yes If yes: In the future, if you were no longer able to drive, how would youmeet your transportation needs? (Check all that apply)My spouse or child(ren) would drive meFriends or neighbors would drive meThe RidePublic transportationH<strong>in</strong>gham Elder Services transportation servicesTaxiOther (please specify):______________________________30. Do you ever modify your driv<strong>in</strong>g by engag<strong>in</strong>g <strong>in</strong> any <strong>of</strong> the follow<strong>in</strong>g behaviors?(Check all that apply)N/A, I don't regulate my driv<strong>in</strong>g at allI avoid driv<strong>in</strong>g at nightI avoid mak<strong>in</strong>g left-hand turnsI avoid driv<strong>in</strong>g <strong>in</strong> bad weatherI avoid expressway driv<strong>in</strong>gI avoid driv<strong>in</strong>g far distances or <strong>in</strong> unfamiliar areasOther changes to driv<strong>in</strong>g behaviors (please specify): _________________31. Below is a list <strong>of</strong> possible difficulties one might face when travel<strong>in</strong>g. Which haveyou experienced when travel<strong>in</strong>g locally, if any? (Check all that apply)N/A, I have experienced no difficultiesElder Services transportation is unavailable or <strong>in</strong>convenientPublic transportation is <strong>in</strong>convenientThere is no one I can depend on for helpPhysical or other limitationsNo door-to-door assistanceOther: ____________________________________________________32. In the past 6 months, when you have traveled outside <strong>of</strong> your house what means <strong>of</strong>transportation have you used? (Check all that apply)FamilyElder Services transportation servicesTaxiWalk<strong>in</strong>g on foot/Rid<strong>in</strong>g a bikePublic transportationOther (pleaseFriends or neighborsspecify):_______________Driv<strong>in</strong>g my own privateautomobile61
Section H. Current & Future Retirement Plans33. Are you retired?No Yes If yes, go to question #37.34. When do you plan to retire?With<strong>in</strong> the next 3 yearsIn 3-5 yearsIn 5-10 YearsIn 10 or more yearsNot SureI do not anticipate ever retir<strong>in</strong>g35. Have you done any f<strong>in</strong>ancial plann<strong>in</strong>g for your retirement? F<strong>in</strong>ancial plann<strong>in</strong>gactivities <strong>in</strong>clude consult<strong>in</strong>g a f<strong>in</strong>ancial or legal pr<strong>of</strong>essional, tak<strong>in</strong>g a sem<strong>in</strong>ar, ortak<strong>in</strong>g other steps to ensure you will have adequate <strong>in</strong>come when you retire.Yes, I have done extensive f<strong>in</strong>ancial plann<strong>in</strong>g for retirementYes, I have done some f<strong>in</strong>ancial plann<strong>in</strong>g but I need to do moreNo, I have not done any f<strong>in</strong>ancial plann<strong>in</strong>g for my retirement36. Please <strong>in</strong>dicate your level <strong>of</strong> agreement with the follow<strong>in</strong>g statement: "I expect tohave adequate resources to meet my f<strong>in</strong>ancial needs <strong>in</strong> retirement."Strongly agreeSomewhat agreeNeither agree nor disagreeSomewhat disagreeStrongly disagree37. Are you (check one)?Male Female38. How old are you? _________Section I. Demographic Information39. Are you?White/CaucasianBlack/African AmericanAsianOther (please specify):_______________40. Do you consider yourself to be Hispanic/Lat<strong>in</strong>o?Yes No62
41. What is your marital status?MarriedWidowedDivorced/SeparatedNever marriedLiv<strong>in</strong>g with a partner as though married42. What is the highest level <strong>of</strong> education you completed?Less than a high school degreeHigh school diploma or GEDSome collegeFour year college degreePost-graduate degree43. Are you currently employed <strong>in</strong> your own bus<strong>in</strong>ess, or at a job that pays you a wageor salary?No Yes How many hours per week do you work?___________44. What was your total family <strong>in</strong>come from all sources before taxes last year?Less than $25,000$25,000-$49,999$50,000-$74,999$75,000-$99,999$100,000-$149,999$150,000 or more45. Were there any times <strong>in</strong> the past 12 months when you did not have enough moneyto (check all that apply)?Buy foodPay for medical needs (such as dental care, eyeglasses, hear<strong>in</strong>g aids, or a prescription)Pay rent, mortgage, or real estate taxesPay for car repairs or home repairsPay utility bills (such as oil, electricity, or telephone)N/A, I did not lack money for any <strong>of</strong> the above needsOther:_____________________If you are will<strong>in</strong>g to be contacted by phone should we need additional <strong>in</strong>formation,OR if you would like more <strong>in</strong>formation about the <strong>Town</strong> <strong>of</strong> H<strong>in</strong>gham ElderServices, please <strong>in</strong>clude your name and phone number here:___________________Thank you for your participation. We appreciate your time and support.63
Appendix B: Detailed tables from the H<strong>in</strong>gham community surveyPercentage distributions are reproduced below for variables <strong>in</strong>cluded <strong>in</strong> the H<strong>in</strong>ghamcommunity survey. Percentages are provided separately for Boomers (age 45-59)and Seniors (age 60+), and subsetted for two age groups with<strong>in</strong> the Senior population(those 60-79 and those 80+). Readers are cautioned aga<strong>in</strong>st draw<strong>in</strong>g strongconclusions based on differences between small age groups.Q1. Residence typeAll agesBoomersSeniorsAge 45-59Age 60+ Age 60-79 Age 80+S<strong>in</strong>gle family home 74% 87% 68% 79% 42%L<strong>in</strong>den Ponds or AllertonHouse11% 0% 16% 4% 45%Other (Condom<strong>in</strong>ium, townhouse, multi-family home orapartment complex)15% 13% 16% 17% 13%TOTAL 100% 100% 100% 100% 100%Number <strong>of</strong> respondents 747* 231 488 344 144*Includes some <strong>in</strong>dividuals who did not provide an age.64
Q2. Do you and/or your spouse own the residence you live <strong>in</strong>?All agesBoomersSeniorsAge 45-59Age 60+ Age 60-79 Age 80+Respondent or spouse ownshome87% 93% 84% 92% 64%Respondent or spouse doesnot own home13% 7% 16% 8% 36%TOTAL 100% 100% 100% 100% 100%Number <strong>of</strong> respondents 733* 228 477 340 137*Includes some <strong>in</strong>dividuals who did not provide an age.65
Q3. Who do you live with? (Check all that apply)All agesBoomersSeniorsAge 45-59Age 60+ Age 60-79 Age 80+Respondent lives alone 22% 8% 28% 22% 44%Respondent lives withspouse only49% 29% 58% 64% 43%Respondent lives withspouse plus others22% 55% 7% 9% 2%Respondent lives with othersbut no spouse7% 8% 7% 5% 11%TOTAL 100% 100% 100% 100% 100%Number <strong>of</strong> respondents 742* 230 484 342 142*Includes some <strong>in</strong>dividuals who did not provide an age.66
Q4. Does your current residence need major repairs, modifications, or changes to improve yourability to live <strong>in</strong> it over the next 5 years? [If yes]: Can you afford to make these changes?All agesBoomersSeniorsAge 45-59Age 60+ Age 60-79 Age 80+Home does not need repairor changes84% 80% 85% 84% 89%Home needs repair orchanges but respondentcannot afford them10% 14% 8% 8% 8%Home needs repair orchanges and respondent canafford them6% 6% 7% 8% 3%TOTAL 100% 100% 100% 100% 100%Number <strong>of</strong> respondents 733* 228 479 337 142*Includes some <strong>in</strong>dividuals who did not provide an age.67
Q5. About how many friends or relatives do you have who you could call on for assistance if youneeded it?All agesBoomersSeniorsAge 45-59Age 60+ Age 60-79 Age 80+None 4% 6% 3% 4% 1%One or two 22% 23% 21% 19% 27%Three or more 74% 71% 76% 77% 72%TOTAL 100% 100% 100% 100% 100%Number <strong>of</strong> respondents 734* 228 479 341 138*Includes some <strong>in</strong>dividuals who did not provide an age.68
Q6. How <strong>of</strong>ten do you talk on the phone, email or get together with friends or relatives?All agesBoomersSeniorsAge 45-59Age 60+ Age 60-79 Age 80+Less than one day per week 7% 12% 5% 7% 2%One to three days per week 39% 40% 39% 36% 45%Four to seven days per week 54% 48% 56% 57% 53%TOTAL 100% 100% 100% 100% 100%Number <strong>of</strong> respondents 738* 229 482 343 139*Includes some <strong>in</strong>dividuals who did not provide an age.69
Q7. Do you provide unpaid care or assistance to a disabled, ill, or elderly spouse, relative, or friend?Q8. (If yes to Q7): Has the person you provide unpaid care for been diagnosed with dementia or anyother k<strong>in</strong>d <strong>of</strong> memory impairment?All agesBoomersSeniorsAge 45-59Age 60+ Age 60-79 Age 80+Not a caregiver 85% 82% 86% 85% 88%Provide care for someonewho does not have dementia10% 10% 10% 11% 7%Provide care for someonewith dementia5% 8% 4% 4% 5%TOTAL 100% 100% 100% 100% 100%Number <strong>of</strong> respondents 722* 228 467 331 136*Includes some <strong>in</strong>dividuals who did not provide an age.70
Q9. (If yes to Q7): How difficult would you say it is for you to care for this person and meet your otherresponsibilities with family and/or work? (caregivers only)All agesBoomersSeniorsAge 45-59Age 60+ Age 60-79 Age 80+Very difficult 8% 7% 9% 10% 6%Somewhat difficult 41% 61% 28% 28% 29%Neither difficult nor easy 29% 17% 36% 34% 41%Somewhat easy 12% 12% 12% 12% 12%Very easy 10% 3% 15% 16% 12%TOTAL 100% 100% 100% 100% 100%Number <strong>of</strong> respondents 111* 41 67 50 17*Includes some <strong>in</strong>dividuals who did not provide an age.71
Q10: How would you rate your overall health at this time?All agesBoomersSeniorsAge 45-59Age 60+ Age 60-79 Age 80+Excellent 41% 63% 30% 37% 16%Good 49% 35% 56% 51% 66%Fair 9% 1% 13% 11% 17%Poor 1% 1% 1% 1% 1%TOTAL 100% 100% 100% 100% 100%Number <strong>of</strong> respondents 717* 217 473 335 138*Includes some <strong>in</strong>dividuals who did not provide an age.72
Q11. Do you have a primary care doctor whom you normally see when you have medicalconcerns?All agesBoomersSeniorsAge 45-59Age 60+ Age 60-79 Age 80+Yes 96% 96% 96% 95% 99%No 4% 4% 4% 5% 1%TOTAL 100% 100% 100% 100% 100%Number <strong>of</strong> respondents 722* 219 476 337 139*Includes some <strong>in</strong>dividuals who did not provide an age.73
Q12-14. Do you require help with household activities (for example, do<strong>in</strong>g rout<strong>in</strong>e household choreslike clean<strong>in</strong>g or yard work); with daily activities (for example, us<strong>in</strong>g the telephone or prepar<strong>in</strong>g yourmeals, food shopp<strong>in</strong>g, tak<strong>in</strong>g medication, or keep<strong>in</strong>g track <strong>of</strong> bills); or with personal activities (forexample, us<strong>in</strong>g the toilet, tak<strong>in</strong>g a bath or shower, or gett<strong>in</strong>g dressed)?All agesBoomersSeniorsAge 45-59Age 60+ Age 60-79 Age 80+No help needed with any <strong>of</strong>these77% 92% 69% 77% 51%Need help only for householdactivities20% 7% 27% 22% 39%Need help for daily orpersonal activities3% 1% 4% 1% 10%TOTAL 100% 100% 100% 100% 100%Number <strong>of</strong> respondents 739* 229 483 343 140*Includes some <strong>in</strong>dividuals who did not provide an age.74
Q15: Referr<strong>in</strong>g to any <strong>of</strong> the activities <strong>in</strong> questions 12-14 for which you answered “Yes”: Who helpsyou with these activities? [Check all that apply. Options <strong>in</strong>clude: I pay someone to help me; A friendor neighbor helps me; A family member helps me; Someone else helps me.]Tabulated only for thoseAll agesBoomersSeniorsreport<strong>in</strong>g that they need andreceive helpAge 45-59Age 60+ Age 60-79 Age 80+Paid help only 56% 50% 56% 63% 47%Paid and unpaid help 16% 17% 17% 12% 22%Unpaid help only 28% 33% 27% 25% 31%TOTAL 100% 100% 100% 100% 100%Number <strong>of</strong> respondents 148* 18 127 68 59*Includes some <strong>in</strong>dividuals who did not provide an age. A very small number <strong>of</strong> respondents (N=2)report need<strong>in</strong>g help, but not receiv<strong>in</strong>g it.75
Q16. Over the last month, how <strong>of</strong>ten did you feel sad, depressed, or “down <strong>in</strong> the dumps”?All agesBoomersSeniorsAge 45-59Age 60+ Age 60-79 Age 80+Never 31% 28% 32% 33% 30%Rarely 41% 42% 41% 42% 38%Sometimes 23% 24% 23% 21% 29%Often 4% 5% 4% 4% 3%Always 1% 1%
Q17. How many times did you visit a medical doctor or other health care pr<strong>of</strong>essional, for anyreason, <strong>in</strong> the last 12 months?All agesBoomersSeniorsAge 45-59Age 60+ Age 60-79 Age 80+Never 2% 5% 1% 1% 1%One or two times 41% 59% 33% 35% 27%Three or four times 31% 25% 33% 35% 29%Five or more times 26% 11% 33% 29% 43%TOTAL 100% 100% 100% 100% 100%Number <strong>of</strong> respondents 738* 229 482 343 139*Includes some <strong>in</strong>dividuals who did not provide an age.77
Q18. The follow<strong>in</strong>g are activities and services currently <strong>of</strong>fered by the H<strong>in</strong>gham Elder Services.Please evaluate the importance <strong>of</strong> each, where “1” is “not very important” and “3” is “veryimportant.”Percentage rat<strong>in</strong>g senior center services and programs as“somewhat” or “very” importantAll ages* Age 45-59 Age 60+Transportation services to medical appo<strong>in</strong>tments, errands, orsocial out<strong>in</strong>gs63% 75% 58%Meals programs, such as lunches at the Senior Center andMeals on Wheels54% 70% 46%Support groups 59% 71% 53%Volunteer opportunities at the Senior Center 61% 70% 58%Health and wellness programs, such as blood pressurecl<strong>in</strong>ics, acupuncture, and reflexology65% 76% 61%Fitness classes 71% 82% 66%Support services, such as help with home repairs andproperty tax work-<strong>of</strong>f programs61% 73% 57%Community education or Life-Long Learn<strong>in</strong>g Programs,<strong>in</strong>clud<strong>in</strong>g job skills tra<strong>in</strong><strong>in</strong>g programs (Wisdom Works)60% 71% 54%Recreational and cultural programs, such as art classes,movies, and trips71% 78% 68%Pr<strong>of</strong>essional services, such as tax preparation, legal service,and health <strong>in</strong>surance counsel<strong>in</strong>g (SHINE)67% 77% 63%*Includes some <strong>in</strong>dividuals who did not provide an age.78
Q19. Th<strong>in</strong>k<strong>in</strong>g <strong>of</strong> your current or future needs, what other programs or services could the H<strong>in</strong>ghamSenior Center <strong>of</strong>fer that you th<strong>in</strong>k would benefit you?Write-<strong>in</strong> responseTimes mentionedSatisfied with current <strong>of</strong>fer<strong>in</strong>gs/cannot th<strong>in</strong>k <strong>of</strong> any 20F<strong>in</strong>ancial help, tax credits, hous<strong>in</strong>g assistance, help with medical expenses 14Education programs, Life Long learn<strong>in</strong>g, speakers, book club 13Help f<strong>in</strong>d<strong>in</strong>g home assistance, yard work, snow removal, odd jobs 11Exercise, fitness, sports, dance classes 10Socializ<strong>in</strong>g 10Computer classes/assistance 9Too soon to tell/don’t need right now 9More transportation services 7Legal help, f<strong>in</strong>ancial plann<strong>in</strong>g, tax prep 5Even<strong>in</strong>g hours 5None-use L<strong>in</strong>den Ponds 4Charlie Cards 4Intergenerational programs, opportunities for service exchange 4Cook<strong>in</strong>g classes, food plann<strong>in</strong>g, food assistance 4Health care—eg flu shots 4Volunteer opportunities 4More trips 3Programs related to Alzheimers and memory loss, respite 3Outdoor programs and activities 3Men’s programs and activities 2Pet assistance 2*List <strong>in</strong>cludes only those issues mentioned by two or more respondents. Some respondents wrote <strong>in</strong>more than one program or service.79
Q20. Outside <strong>of</strong> the H<strong>in</strong>gham Senior Center, what other local senior programs, services or activitiesdo you participate <strong>in</strong>?Programs mentionedTimes mentionedL<strong>in</strong>den Ponds or Allerton House 33Fitness/gym 29Church activities, <strong>in</strong>clud<strong>in</strong>g church volunteer<strong>in</strong>g 27Clubs and voluntary associations 18Work and/or car<strong>in</strong>g for children or others 10Volunteer work 8Classes, OLLI 5Library 5Veterans groups 3Weymouth Senior Center 2*List <strong>in</strong>cludes only those mentioned by two or more respondents. Some respondents wrote <strong>in</strong> morethan one program or service.80
Q21: How familiar are you with the H<strong>in</strong>gham Senior Center?All agesBoomersSeniorsAge 45-59Age 60+ Age 60-79 Age 80+Respondent has participated <strong>in</strong> SeniorCenter activities25% 4% 35% 33% 40%Respondent has not participated, butanother household member hasparticipated <strong>in</strong> Senior Center activities5% 7% 4% 4% 3%Respondent has not participated, andknows quite a bit about H<strong>in</strong>ghamSenior Center programm<strong>in</strong>g13% 6% 17% 19% 12%Respondent has not participated, andknows very little about H<strong>in</strong>ghamSenior Center programm<strong>in</strong>g57% 83% 44% 44% 45%TOTAL 100% 100% 100% 100% 100%Number <strong>of</strong> respondents 724* 228 471 333 138*Includes some <strong>in</strong>dividuals who did not provide an age.81
Q21: Expanded content: How familiar are you with the H<strong>in</strong>gham Senior Center?Age 80+, resident <strong>of</strong> L<strong>in</strong>den Pondsor Allerton HouseAge 80+, not a resident <strong>of</strong> L<strong>in</strong>denPonds or Allerton HouseRespondent has participated <strong>in</strong>Senior Center activities15% 60%Respondent has not participated,but another household memberhas participated <strong>in</strong> Senior Centeractivities2% 4%Respondent has not participated,and knows quite a bit aboutH<strong>in</strong>gham Senior Centerprogramm<strong>in</strong>g10% 13%Respondent has not participated,and knows very little aboutH<strong>in</strong>gham Senior Centerprogramm<strong>in</strong>g73% 24%TOTAL 100% 100%Number <strong>of</strong> respondents 59 7982
Q22: Below is a list <strong>of</strong> problems one could encounter when access<strong>in</strong>g Senior Center programs.Which <strong>of</strong> the follow<strong>in</strong>g, if any, have you experienced? (Check all that apply)Percentage report<strong>in</strong>g hav<strong>in</strong>g experienced these problems All ages Age 60+Lack <strong>of</strong> transportation 3% 4%Lack <strong>of</strong> adequate facilities 1% 1%I don’t know what is available 10% 8%I don’t know how to access the services or programs 5% 5%Inconvenient location <strong>of</strong> the Senior Center
Q23: How many years have you lived <strong>in</strong> H<strong>in</strong>gham?All agesBoomersSeniorsAge 45-59Age 60+ Age 60-79 Age 80+Fewer than 25 years 45% 70% 34% 27% 52%25 to 39 years 24% 13% 29% 38% 7%40 years or more 31% 17% 37% 35% 41%TOTAL 100% 100% 100% 100% 100%Number <strong>of</strong> respondents 739* 228 484 341 143*Includes some <strong>in</strong>dividuals who did not provide an age.84
Expanded <strong>in</strong>formation on years lived <strong>in</strong> H<strong>in</strong>gham, for aged 80+, by residence <strong>in</strong> L<strong>in</strong>den PondsAge 80+ not liv<strong>in</strong>g <strong>in</strong> L<strong>in</strong>denPondsAge 80+ liv<strong>in</strong>g <strong>in</strong> L<strong>in</strong>den PondsFewer than 5 years 0% 36%5 to 9 years 4% 51%10 to 14 years 5% 0%15 to 24 years 13% 2%25 to 39 years 10% 3%40 years or more 68% 8%TOTAL 100% 100%Number <strong>of</strong> respondents 79 6485
Q24: Do you live <strong>in</strong> H<strong>in</strong>gham year-around?All agesBoomersSeniorsAge 45-59Age 60+ Age 60-79 Age 80+No 5% 2% 6% 7% 3%Yes 95% 98% 94% 93% 97%TOTAL 100% 100% 100% 100% 100%Number <strong>of</strong> respondents 746* 231 488 343 145*Includes some <strong>in</strong>dividuals who did not provide an age.86
Q25. How important is it to you to rema<strong>in</strong> liv<strong>in</strong>g <strong>in</strong> H<strong>in</strong>gham as long as possible?All agesBoomersSeniorsAge 45-59Age 60+ Age 60-79 Age 80+Extremely important 48% 37% 53% 48% 62%Very important 29% 30% 29% 28% 33%Somewhat important 16% 23% 13% 17% 4%Not very important 4% 7% 3% 4% 0%Not at all important 3% 3% 2% 3% 1%TOTAL 100% 100% 100% 100% 100%Number <strong>of</strong> respondents 742* 231 484 342 142*Includes some <strong>in</strong>dividuals who did not provide an age.87
Q26. Please <strong>in</strong>dicate your level <strong>of</strong> agreement with the follow<strong>in</strong>g statement about your neighborhood:“This is a neighborhood where I feel safe.”All agesBoomersSeniorsAge 45-59Age 60+ Age 60-79 Age 80+Strongly agree 80% 81% 80% 79% 82%Somewhat agree 16% 14% 17% 18% 15%Neither agree nor disagree 3% 4% 3% 3% 2%Somewhat disagree 1% 1%
Q27. What are your greatest concerns about liv<strong>in</strong>g <strong>in</strong> H<strong>in</strong>gham as you grow older?Issue mentionedNumber <strong>of</strong>timesmentionedAffordability, cost <strong>of</strong> liv<strong>in</strong>g, taxes 330Transportation 62Ability to stay <strong>in</strong> home, ma<strong>in</strong>ta<strong>in</strong> home, live on own, suitability <strong>of</strong> home to age <strong>in</strong>place, challenges <strong>of</strong> downsiz<strong>in</strong>gLonel<strong>in</strong>ess, isolation, social engagement (<strong>in</strong>clud<strong>in</strong>g: family far away; <strong>in</strong>ability toparticipate as get older; friends/spouse die <strong>of</strong>f)5247Traffic, congestion, overbuild<strong>in</strong>g 26Access to and quality <strong>of</strong> services (medical + other services) 18Ma<strong>in</strong>ta<strong>in</strong><strong>in</strong>g good health 17Crime 12W<strong>in</strong>ter, weather 789
Q29. H<strong>in</strong>gham Elder Services provides transportation services <strong>in</strong>clud<strong>in</strong>g medical rides and localshuttle service. Prior to this survey, were you aware <strong>of</strong> these services?All agesBoomersSeniorsAge 45-59Age 60+ Age 60-79 Age 80+No 28% 41% 21% 18% 30%Yes 72% 59% 79% 82% 70%TOTAL 100% 100% 100% 100% 100%Number <strong>of</strong> respondents 742* 229 486 343 143*Includes some <strong>in</strong>dividuals who did not provide an age.90
Q29: [Asked <strong>of</strong> respondents who drive]: In the future, if you were no longer able to drive, how wouldyou meet your transportation needs? (Check all that apply)All agesBoomersSeniorsPercent mark<strong>in</strong>g yesAge 45-59Age 60+ Age 60-79 Age 80+My spouse or child(ren) would drive me 67% 69% 66% 68% 62%Friends or neighbors would drive me 47% 52% 45% 48% 36%The Ride 29% 23% 33% 32% 36%Public transportation 33% 37% 32% 36% 18%H<strong>in</strong>gham Elder Services transportationservices49% 44% 53% 58% 37%Taxi 34% 25% 40% 43% 30%*Asked only <strong>of</strong> those who drive. For the sample as a whole, only 43 respondents state that they donot drive.Q29 write-<strong>in</strong>: Other means <strong>of</strong> transport if drivers were unable to drive <strong>in</strong> the futureMeans <strong>of</strong> transportation write-<strong>in</strong>Number <strong>of</strong> responsesL<strong>in</strong>den Ponds transportation 29Bike, walk 17Don’t know 14Hire someone, other public transport 13Would move 691
Q30. [Asked <strong>of</strong> respondents who drive]: Do you ever modify your driv<strong>in</strong>g by engag<strong>in</strong>g <strong>in</strong> any <strong>of</strong> thefollow<strong>in</strong>g behaviors? [Listed modifications <strong>in</strong>clude: I avoid driv<strong>in</strong>g at night; I avoid mak<strong>in</strong>g left-handturns; I avoid driv<strong>in</strong>g <strong>in</strong> bad weather; I avoid expressway driv<strong>in</strong>g; I avoid driv<strong>in</strong>g far distances or <strong>in</strong>unfamiliar areas; I make other changes to driv<strong>in</strong>g behaviors (specified)].All agesBoomersSeniorsAge 45-59Age 60+ Age 60-79 Age 80+Yes, some modification(s) listed 36% 17% 47% 37% 78%No, I don’t regulate my driv<strong>in</strong>g at all 64% 83% 53% 63% 22%TOTAL 100% 100% 100% 100% 100%Number <strong>of</strong> respondents 683 224 440 331 109*Asked only <strong>of</strong> current drivers. More than one modification can be listed.Other modifications to driv<strong>in</strong>g mentioned, current drivers only: Us<strong>in</strong>g more awareness,concentration; avoid<strong>in</strong>g turns, us<strong>in</strong>g back-roads, stay<strong>in</strong>g on ma<strong>in</strong> streets; driv<strong>in</strong>g more slowly;driv<strong>in</strong>g with spouse; do not drive very far; avoid bad neighborhoods; dr<strong>in</strong>k<strong>in</strong>g less; ma<strong>in</strong>ta<strong>in</strong><strong>in</strong>gautomobile92
Q31: Below is a list <strong>of</strong> possible difficulties one might face when travel<strong>in</strong>g. Which have youexperienced when travel<strong>in</strong>g locally, if any? (Check all that apply)% mark<strong>in</strong>g yes* Non-drivers Drivers AgeDriversDrivers AgeDrivers Age45-59Age 60+60-7980+Elder Services transportation isunavailable or <strong>in</strong>convenient12% 1% 1% 1% 2%Public transportation is <strong>in</strong>convenient 12% 7% 10% 11% 9%There is no one I can depend on forhelp7% 1% 3% 3% 3%Physical or other limitations 16% 1% 4% 4% 6%No door-to-door assistance 5% 2% 1% 1% 2%Number <strong>of</strong> respondents 43 224 440 331 109*More than one difficulty could be marked. Non-drivers are not split out by age due to the smallnumber <strong>of</strong> respondents who are not drivers.Other difficulties reported: Confidence <strong>in</strong> driv<strong>in</strong>g on highways; I just do the best I can; lowvision; no names on streets; weather; weekend tra<strong>in</strong> and boat service cancelled!; noboats/tra<strong>in</strong>s on weekends, clos<strong>in</strong>g <strong>of</strong> Qu<strong>in</strong>cy Center T garage; tra<strong>in</strong> & boat93
Q32: In the past 6 months, when you have traveled outside <strong>of</strong> your house what means <strong>of</strong>transportation have you used? (Check all that apply)% mark<strong>in</strong>g yes* Non-drivers Drivers AgeDriversDrivers AgeDrivers Age45-59Age 60+60-7980+Family 77% 23% 34% 33% 39%Taxi 40% 9% 9% 8% 12%Public transportation 21% 22% 21% 24% 11%Friends or neighbors 42% 16% 20% 19% 23%Driv<strong>in</strong>g my own private automobile 12% 95% 97% 98% 95%Elder Services transportation services 26% 0% 1% 1% 3%Walk<strong>in</strong>g on food/rid<strong>in</strong>g a bike 23% 46% 31% 34% 20%Number <strong>of</strong> respondents 43 224 440 331 109*More than one means <strong>of</strong> transportation could be marked. Non-drivers are not split out by age dueto the small number <strong>of</strong> respondents who are not drivers.94
Q32 write-<strong>in</strong>: other means <strong>of</strong> transportation used <strong>in</strong> past 6 months (reported by 2 or more)Other means <strong>of</strong> transportation reportedNumber <strong>of</strong> responsesAllerton House, L<strong>in</strong>den Ponds 12Medical transportation; the Ride 10Boat, tra<strong>in</strong>, MBTA 5Airplane 3Limo service, taxi 3Shared rides 2Motorcycle, scooter 295
Q33. Are you retired?All agesBoomersSeniorsAge 45-59Age 60+ Age 60-79 Age 80+No 46% 94% 23% 31% 3%Yes 54% 6% 77% 69% 97%TOTAL 100% 100% 100% 100% 100%Number <strong>of</strong> respondents 738* 230 487 343 144*Includes some <strong>in</strong>dividuals who did not provide an age.96
Q34. [Asked <strong>of</strong> those who are not retired]: When do you plan to retire?All ages Age 45-59 Age 60-79With<strong>in</strong> the next 3 years 12% 2% 34%In 3-5 years 11% 4% 26%In 5-10 years 18% 19% 12%In 10 or more years 32% 46% 6%Not sure 17% 19% 11%I do not anticipate ever retir<strong>in</strong>g 10% 10% 11%TOTAL 100% 100% 100%Number <strong>of</strong> respondents 319* 209 98*Includes some <strong>in</strong>dividuals who did not provide an age. Only 5 <strong>in</strong>dividuals aged 80+ werenot retired; figures not shown.97
Q35. [Asked <strong>of</strong> those who are not retired]: Have you done any f<strong>in</strong>ancial plann<strong>in</strong>g for your retirement?F<strong>in</strong>ancial plann<strong>in</strong>g activities <strong>in</strong>clude consult<strong>in</strong>g a f<strong>in</strong>ancial or legal pr<strong>of</strong>essional, tak<strong>in</strong>g a sem<strong>in</strong>ar, ortak<strong>in</strong>g other steps to ensure you will have adequate <strong>in</strong>come when you retire.All ages Age 45-59 Age 60-79Yes, I have done extensive f<strong>in</strong>ancial plann<strong>in</strong>gfor retirement35% 36% 31%Yes, I have done some f<strong>in</strong>ancial plann<strong>in</strong>g butI need to do more54% 53% 58%No, I have not done any f<strong>in</strong>ancial plann<strong>in</strong>g formy retirement11% 11% 11%TOTAL 100% 100% 100%Number <strong>of</strong> respondents 323* 210 100*Includes some <strong>in</strong>dividuals who did not provide an age. Only 5 <strong>in</strong>dividuals aged 80+ werenot retired; figures not shown.98
Q36. [Asked <strong>of</strong> those who are not retired]: Please <strong>in</strong>dicate your level <strong>of</strong> agreement with the follow<strong>in</strong>gstatement: “I expect to have adequate resources to meet my f<strong>in</strong>ancial needs <strong>in</strong> retirement.”All ages Age 45-59 Age 60-79Strongly agree 21% 18% 25%Somewhat agree 48% 49% 46%Neither agree nor disagree 13% 13% 16%Somewhat disagree 9% 10% 6%Strongly disagree 9% 10% 7%TOTAL 100% 100% 100%Number <strong>of</strong> respondents 321* 208 100*Includes some <strong>in</strong>dividuals who did not provide an age. Only 5 <strong>in</strong>dividuals aged 80+ werenot retired; figures not shown.99
Q37. Gender: Are you (check one)?All agesBoomersSeniorsAge 45-59Age 60+ Age 60-79 Age 80+Male 34% 36% 33% 35% 27%Female 66% 64% 67% 65% 73%TOTAL 100% 100% 100% 100% 100%Number <strong>of</strong> respondents 739* 230 489 344 145*Includes some <strong>in</strong>dividuals who did not provide an age.100
Q38. Age: How old are you?All agesAge 45-49 9%Age 50-54 11%Age 55-59 12%Age 60-64 13%Age 65-69 15%Age 70-74 11%Age 75-79 9%Age 80-84 12%Age 85 and older 8%TOTAL 100%Number <strong>of</strong> respondents 720101
Q39. Race: Are you ?Q40. Do you consider yourself to be Hispanic/Lat<strong>in</strong>o?All agesWhite/Caucasian 99%Black/African American
Q41. What is your marital status?All agesBoomersSeniorsAge 45-59Age 60+ Age 60-79 Age 80+Married or liv<strong>in</strong>g with a partner asthough married73% 86% 66% 74% 48%Widowed 13%
Q42. What is the highest level <strong>of</strong> education you completed?All agesBoomersSeniorsAge 45-59Age 60+ Age 60-79 Age 80+Less than a high school degree 1% 0% 1% 1% 3%High school diploma or GED 10% 5% 13% 8% 23%Some college 25% 19% 29% 27% 34%Four year college degree 30% 37% 26% 28% 22%Post-graduate degree 34% 39% 31% 36% 18%TOTAL 100% 100% 100% 100% 100%Number <strong>of</strong> respondents 748* 231 489 344 145*Includes some <strong>in</strong>dividuals who did not provide an age.104
Q43. Are you currently employed <strong>in</strong> your own bus<strong>in</strong>ess, or at a job that pays you a wage or salary? [Ifyes, respondent was asked to report the number <strong>of</strong> hours worked per week]All agesBoomersSeniorsAge 45-59Age 60+ Age 60-79 Age 80+Not employed 59% 25% 74% 65% 96%Employed part-time (less than 30hours per week)13% 14% 13% 16% 4%Employed full-time (30 hours or moreper week)28% 61% 13% 19% 0%TOTAL 100% 100% 100% 100% 100%Number <strong>of</strong> respondents 720* 219 475 334 141*Includes some <strong>in</strong>dividuals who did not provide an age.105
Q44. What was your total family <strong>in</strong>come from all sources before taxes last year?All agesBoomersSeniorsAge 45-59Age 60+ Age 60-79 Age 80+Less than $25,000 8% 4% 10% 8% 14%$25,000-$49,999 15% 6% 20% 17% 27%$50,000-$74,999 16% 11% 18% 16% 21%$75,000-$99,999 11% 10% 12% 14% 9%$100,000-$149,999 15% 18% 13% 15% 8%$150,000 or more 23% 43% 14% 18% 4%No response 12% 8% 13% 12% 17%TOTAL 100% 100% 100% 100% 100%Number <strong>of</strong> respondents 749 231 489 344 145*Includes some <strong>in</strong>dividuals who did not provide an age.106
Q45. Were there any times <strong>in</strong> the past 12 months when you did not have enough money to (check allthat apply)?% mark<strong>in</strong>g yes All ages* BoomersAge 45-59SeniorsAge 60+ Age 60-79 Age 80+Buy food 3% 4% 2% 3% 0%Pay for medical needs (such as dentalcare, eyeglasses, hear<strong>in</strong>g aids, or aprescription)6% 7% 5% 6% 4%Pay rent, mortgage, or real estatetaxes5% 7% 3% 3% 3%Pay for car repairs or home repairs 6% 11% 4% 5% 3%Pay utility bills (such as oil, electricity,or telephone)4% 5% 3% 4% 3%Other listed 2% 3% 2% 2% 2%One or more listed 11% 16% 9% 10% 8%*Includes some <strong>in</strong>dividuals who did not provide an age.Other needs (write-<strong>in</strong>): activities & enterta<strong>in</strong>ment; sav<strong>in</strong>gs; general f<strong>in</strong>ancial caution; creditcard or other debt107
The Gerontology Institute is located with<strong>in</strong> the John W. McCormack Graduate School <strong>of</strong> Policyand Global Studies at the University <strong>of</strong> <strong>Massachusetts</strong> Boston. The McCormack GraduateSchool was founded <strong>in</strong> 2003 to create a dynamic academic and research center <strong>in</strong> policystudies. The school has built upon the foundation <strong>of</strong> its predecessor, the McCormack Institute,established <strong>in</strong> 1983 and named <strong>in</strong> honor <strong>of</strong> U.S. House <strong>of</strong> Representatives Speaker John W.McCormack. For more <strong>in</strong>formation visit the McCormack Graduate School website:www.mccormack.umb.edu.About The Gerontology InstituteThe Gerontology Institute addresses social and economic issues associated with populationag<strong>in</strong>g. The Institute conducts research, analyzes policy issues and engages <strong>in</strong> publiceducation. It also encourages the participation <strong>of</strong> older people <strong>in</strong> ag<strong>in</strong>g services and policydevelopment. In its work with local, state, national and <strong>in</strong>ternational organizations, theInstitute has five priorities: 1) productive ag<strong>in</strong>g, that is, opportunities for older people to playuseful social roles; 2) health care for the elderly; 3) long-term care for the elderly; 4) economicsecurity for older adults; and 5) social and demographic research on ag<strong>in</strong>g. The Institute paysparticular attention to the special needs <strong>of</strong> low-<strong>in</strong>come and m<strong>in</strong>ority elderly.The Gerontology Institute was created <strong>in</strong> 1984 by the <strong>Massachusetts</strong> Legislature. In 2003, theGerontology Institute became a found<strong>in</strong>g member <strong>of</strong> the John W. McCormack Graduate School<strong>of</strong> Policy and Global Studies at the University <strong>of</strong> <strong>Massachusetts</strong> Boston. The Center for Socialand Demographic Research <strong>in</strong> <strong>Ag<strong>in</strong>g</strong> was established as a research unit with<strong>in</strong> the GerontologyInstitute <strong>in</strong> 2012. Its work focuses on economic security <strong>in</strong> later life, well-be<strong>in</strong>g and quality<strong>of</strong> life, community supports for seniors, and demography and diversity <strong>in</strong> ag<strong>in</strong>g. For more<strong>in</strong>formation visit the Gerontology Institute website:www.gerontology<strong>in</strong>stitute.umb.edu.
TOWN OF HINGHAMDEPARTMENT OF ELDER SERVICES224 Central StreetH<strong>in</strong>gham, MA 02043Phone 781.741.1458UNIVERSITY OF MASSACHUSETTS BOSTONGERONTOLOGY INSTITUTE100 Morrissey BoulevardBoston, MA 02125-3393Phone 617.287.7300www.umb.edu/gerontology<strong>in</strong>stitute