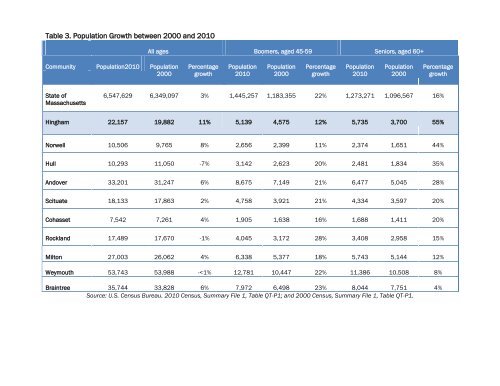
Table 3. Population Growth between 2000 and 2010All ages Boomers, aged 45-59 Seniors, aged 60+Community Population2010 Population2000PercentagegrowthPopulation2010Population2000PercentagegrowthPopulation2010Population2000PercentagegrowthState <strong>of</strong><strong>Massachusetts</strong>6,547,629 6,349,097 3% 1,445,257 1,183,355 22% 1,273,271 1,096,567 16%H<strong>in</strong>gham 22,157 19,882 11% 5,139 4,575 12% 5,735 3,700 55%Norwell 10,506 9,765 8% 2,656 2,399 11% 2,374 1,651 44%Hull 10,293 11,050 -7% 3,142 2,623 20% 2,481 1,834 35%Andover 33,201 31,247 6% 8,675 7,149 21% 6,477 5,045 28%Scituate 18,133 17,863 2% 4,758 3,921 21% 4,334 3,597 20%Cohasset 7,542 7,261 4% 1,905 1,638 16% 1,688 1,411 20%Rockland 17,489 17,670 -1% 4,045 3,172 28% 3,408 2,958 15%Milton 27,003 26,062 4% 6,338 5,377 18% 5,743 5,144 12%Weymouth 53,743 53,988 -
from 4,575 to 5,139 (an <strong>in</strong>crease <strong>of</strong> 12%), a considerably lower rate than the 22% <strong>in</strong>crease for<strong>Massachusetts</strong>. Us<strong>in</strong>g surround<strong>in</strong>g communities as a comparison, it is evident that thepercentage growth for the population aged 60 and over was substantially greater <strong>in</strong> H<strong>in</strong>gham than<strong>in</strong> all <strong>of</strong> the comparison communities listed <strong>in</strong> Table 3. Some, but not all, <strong>of</strong> this growth was nodoubt a result <strong>of</strong> the buildup <strong>of</strong> L<strong>in</strong>den Ponds, which opened <strong>in</strong> 2004 and <strong>in</strong>cludes approximately1,200 seniors. Over the next ten years, the ag<strong>in</strong>g <strong>of</strong> the Boomer cohort will cont<strong>in</strong>ue to swell thesize <strong>of</strong> the 60+ population <strong>in</strong> H<strong>in</strong>gham and throughout the Commonwealth.Results from the 2010 Census highlight the racial homogeneity <strong>of</strong> H<strong>in</strong>gham relative to the stateas a whole. For all ages comb<strong>in</strong>ed, 95% <strong>of</strong> H<strong>in</strong>gham residents report their race as White, and donot report Hispanic ethnicity. In comparison, 76% <strong>of</strong> the Commonwealth residents report non-Hispanic and White backgrounds (see DP-1, U.S. Census 2010). In H<strong>in</strong>gham as well as <strong>in</strong><strong>Massachusetts</strong>, the majority <strong>of</strong> seniors are women (59% <strong>in</strong> H<strong>in</strong>gham and 57% <strong>in</strong> <strong>Massachusetts</strong>).This is largely due to the greater longevity <strong>of</strong> women than <strong>of</strong> men.The senior population represents a substantial presence <strong>in</strong> H<strong>in</strong>gham, with 46% <strong>of</strong> its nearly 8,500households <strong>in</strong>clud<strong>in</strong>g at least one person aged 60 and over (ACS, 2007-2011). Among allhouseholds <strong>in</strong> H<strong>in</strong>gham, 77% are owned or rented by a resident who is aged 45 or over (seeFigure 2). Rental units are slightly more commonly headed by someone under age 45, but with<strong>in</strong>owner-occupied hous<strong>in</strong>g 37% <strong>of</strong> the householders are aged 45-59, and 40% are aged 60 andover. (A “householder” is the person reported as the head <strong>of</strong> household, typically the person <strong>in</strong>whose name the home is owned or rented.) This suggests that issues relat<strong>in</strong>g to ag<strong>in</strong>g servicesand community amenities valued by older residents may be particularly salient to homeowners <strong>in</strong>H<strong>in</strong>gham. Homeownership is very common among H<strong>in</strong>gham residents, with 80% <strong>of</strong> all householdsliv<strong>in</strong>g <strong>in</strong> homes that they own or are purchas<strong>in</strong>g (see Figure 3). Nearly 9 out <strong>of</strong> 10 householdersaged 45-59 own a home, as do 74% <strong>of</strong> the householders aged 60 and over. Homeownership iscommonly reported even among seniors liv<strong>in</strong>g alone. More than half <strong>of</strong> residents aged 65 andover and who live alone own their homes. Many <strong>of</strong> these <strong>in</strong>dividuals—the majority <strong>of</strong> whom areolder women—may need help with home repairs and other supports <strong>in</strong> order to rema<strong>in</strong>comfortable and safe <strong>in</strong> their homes, as well as to protect their <strong>in</strong>vestments.19