minoan lines shipping sa annual report 2003
minoan lines shipping sa annual report 2003
minoan lines shipping sa annual report 2003

You also want an ePaper? Increase the reach of your titles
YUMPU automatically turns print PDFs into web optimized ePapers that Google loves.
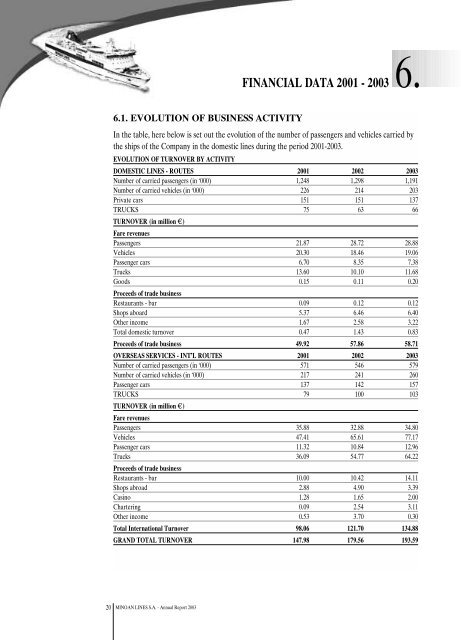
FINANCIAL DATA 2001 - <strong>2003</strong>6.6.1. EVOLUTION OF BUSINESS ACTIVITYIn the table, here below is set out the evolution of the number of passengers and vehicles carried bythe ships of the Company in the domestic <strong>lines</strong> during the period 2001-<strong>2003</strong>.EVOLUTION OF TURNOVER BY ACTIVITYDOMESTIC LINES - ROUTES 2001 2002 <strong>2003</strong>Number of carried passengers (in ‘000) 1,248 1,298 1,191Number of carried vehicles (in ‘000) 226 214 203Private cars 151 151 137TRUCKS 75 63 66TURNOVER (in million €)Fare revenuesPassengers 21.87 28.72 28.88Vehicles 20.30 18.46 19.06Passenger cars 6.70 8.35 7.38Trucks 13.60 10.10 11.68Goods 0.15 0.11 0.20Proceeds of trade businessRestaurants - bar 0.09 0.12 0.12Shops aboard 5.37 6.46 6.40Other income 1.67 2.58 3.22Total domestic turnover 0.47 1.43 0.83Proceeds of trade business 49.92 57.8658.71OVERSEAS SERVICES - INT’L ROUTES 2001 2002 <strong>2003</strong>Number of carried passengers (in ‘000) 571 546 579Number of carried vehicles (in ‘000) 217 241 260Passenger cars 137 142 157TRUCKS 79 100 103TURNOVER (in million €)Fare revenuesPassengers 35.88 32.88 34.80Vehicles 47.41 65.61 77.17Passenger cars 11.32 10.84 12.96Trucks 36.09 54.77 64.22Proceeds of trade businessRestaurants - bar 10.00 10.42 14.11Shops abroad 2.88 4.90 3.39Casino 1.28 1.65 2.00Chartering 0.09 2.54 3.11Other income 0.53 3.70 0.30Total International Turnover 98.06121.70 134.88GRAND TOTAL TURNOVER 147.98 179.56193.5920MINOAN LINES S.A. - Annual Report <strong>2003</strong>