minoan lines shipping sa annual report 2003
minoan lines shipping sa annual report 2003
minoan lines shipping sa annual report 2003

You also want an ePaper? Increase the reach of your titles
YUMPU automatically turns print PDFs into web optimized ePapers that Google loves.
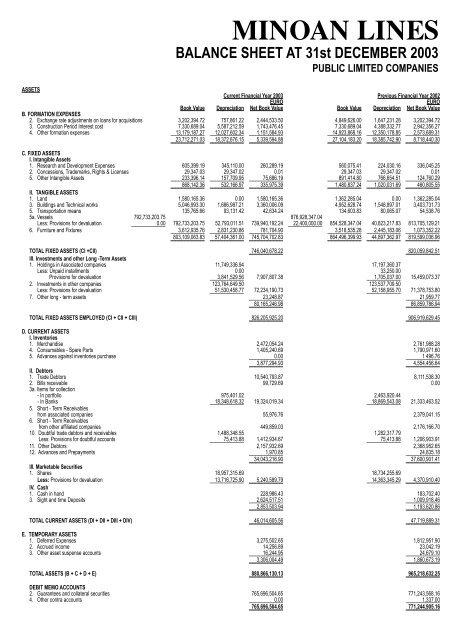
ASSETSMINOAN LINESBALANCE SHEET AT 31st DECEMBER <strong>2003</strong>PUBLIC LIMITED COMPANIESCurrent Financial Year <strong>2003</strong> Previous Financial Year 2002EUROEUROBook Value Depreciation Net Book Value Book Value Depreciation Net Book ValueB. FORMATION EXPENSES2. Exchange rate adjustments on loans for acquisitions 3,202,394.72 757,861.22 2,444,533.50 4,849,626.00 1,647,231.28 3,202,394.723. Construction Period Interest cost 7,330,689.04 5,587,212.59 1,743,476.45 7,330,689.04 4,388,332.77 2,942,356.274. Other formation expenses 13,179,187.27 12,027,602.34 1,151,584.93 14,923,868.16 12,350,178.85 2,573,689.31--------------------------------------------- --------------------------------------------- --------------------------------------------- --------------------------------------------- --------------------------------------------- ---------------------------------------------23,712,271.03 18,372,676.15 5,339,594.88 27,104,183.20 18,385,742.90 8,718,440.30--------------------------------------------- --------------------------------------------- --------------------------------------------- --------------------------------------------- --------------------------------------------- ------------------------------------------------------------------------------------------ --------------------------------------------- --------------------------------------------- --------------------------------------------- --------------------------------------------- ---------------------------------------------C. FIXED ASSETSI. Intangible Assets1. Research and Development Expenses 605,399.19 345,110.00 260,289.19 560,075.41 224,030.16 336,045.252. Concessions, Trademarks, Rights & Licenses 29,347.03 29,347.02 0.01 29,347.03 29,347.02 0.015. Other Intangible Assets 233,396.14 157,709.95 75,686.19 891,414.80 766,654.51 124,760.29--------------------------------------------- --------------------------------------------- --------------------------------------------- --------------------------------------------- --------------------------------------------- ---------------------------------------------868,142.36 532,166.97 335,975.39 1,480,837.24 1,020,031.69 460,805.55--------------------------------------------- --------------------------------------------- --------------------------------------------- --------------------------------------------- --------------------------------------------- ------------------------------------------------------------------------------------------ --------------------------------------------- --------------------------------------------- --------------------------------------------- --------------------------------------------- ---------------------------------------------ΙΙ. TANGIBLE ASSETS1. Land 1,580,165.36 0.00 1,580,165.36 1,362,285.04 0.00 1,362,285.043. Buildings and Technical works 5,046,993.30 1,686,987.21 3,360,006.09 4,952,628.74 1,548,897.01 3,403,731.735. Transportation means 135,765.66 93,131.42 42,634.24 134,603.83 80,065.07 54,538.765a. Vessels 792,733,203.75 876,928,347.04Less: Provisions for devaluation 0.00 792,733,203.75 52,793,011.51 739,940,192.24 22,400,000.00 854,528,347.04 40,823,217.83 813,705,129.21--------------------------------------------- ---------------------------------------------6. Furniture and Fixtures 3,612,935.76 2,831,230.86 781,704.90 3,518,535.28 2,445,183.06 1,073,352.22--------------------------------------------- --------------------------------------------- --------------------------------------------- --------------------------------------------- --------------------------------------------- ---------------------------------------------803,109,063.83 57,404,361.00 745,704,702.83 864,496,399.93 44,897,362.97 819,599,036.96--------------------------------------------- --------------------------------------------- --------------------------------------------- --------------------------------------------- --------------------------------------------- ------------------------------------------------------------------------------------------ --------------------------------------------- --------------------------------------------- --------------------------------------------- --------------------------------------------- ---------------------------------------------TOTAL FIXED ASSETS (CI +CII) 746,040,678.22 820,059,842.51--------------------------------------------- ---------------------------------------------ΙΙΙ. Investments and other Long -Term Assets1. Holdings in Associated companies 11,749,336.94 17,197,360.37Less: Unpaid installments 0.00 33,250.00Provisions for devaluation 3,841,529.567,907,807.38 1,705,037.00 15,459,073.37--------------------------------------------- ---------------------------------------------2. Investments in other companies 123,764,649.50 123,537,709.50Less: Provisions for devaluation 51,530,458.77 72,234,190.73 52,158,955.70 71,378,753.80--------------------------------------------- ---------------------------------------------7. Other long - term assets 23,248.87 21,959.77--------------------------------------------- ---------------------------------------------80,165,246.98 86,859,786.94--------------------------------------------- ------------------------------------------------------------------------------------------ ---------------------------------------------TOTAL FIXED ASSETS EMPLOYED (CI + CII + CIII) 826,205,925.20 906,919,629.45--------------------------------------------- ------------------------------------------------------------------------------------------ ---------------------------------------------D. CURRENT ASSETSΙ. Inventories1. Merchandise 2,472,054.24 2,761,988.284. Consumables - Spare Parts 1,405,240.69 1,790,971.605. Advances against inventories purchase 0.00 1 496.76--------------------------------------------- ---------------------------------------------3,877,294.93 4,554,456.64--------------------------------------------- ------------------------------------------------------------------------------------------ ---------------------------------------------ΙΙ. Debtors1. Trade Debtors 10,540,793.87 8,111,538.302. Bills receivable 99,729.69 0.003a. Items for collection- In portfolio 975,401.02 2,463,920.44- In Banks --------------------------------------------- 18,348,618.32 19,324,019.34 ---------------------------------------------18,869,543.08 21,333,463.525. Short - Term Receivablesfrom associated companies 55,976.76 2,379,041.156. Short - Term Receivablesfrom other affiliated companies 449,859.03 2,176,166.7010. Doubtful trade debtors and receivables 1,488,348.55 1,282,317.79Less: Provisions for doubtful accounts 75,413.88 1,412,934.67 75,413.88 1,206,903.91--------------------------------------------- ---------------------------------------------11. Other Debtors 2,157,932.69 2,368,952.6512. Advances and Prepayments 1,970.85 24,835.18--------------------------------------------- ---------------------------------------------34,043,216.90 37,600,901.41--------------------------------------------- ------------------------------------------------------------------------------------------ ---------------------------------------------ΙΙΙ. Marketable Securities1. Shares 18,957,315.69 18,734,255.69Less: Provisions for devaluation 13,716,725.90 5,240,589.79 14,363,345.29 4,370,910.40--------------------------------------------- --------------------------------------------- --------------------------------------------- ---------------------------------------------ΙV. Cash1. Cash in hand 228,986.43 183,702.403. Sight and time Deposits 2,624,517.51 1,009,918.46--------------------------------------------- ---------------------------------------------2,853,503.94 1,193,620.86--------------------------------------------- ------------------------------------------------------------------------------------------ ---------------------------------------------TOTAL CURRENT ASSETS (DI + DII + DIII + DIV) 46,014,605.56 47,719,889.31--------------------------------------------- ------------------------------------------------------------------------------------------ ---------------------------------------------Ε. TEMPORARY ASSETS1. Deferred Expenses 3,275,502.65 1,812,951.902. Accrued income 14,256.89 23,042.193. Other asset suspense accounts 16,244.95 24,679.10--------------------------------------------- ---------------------------------------------3,306,004.49 1,860,673.19--------------------------------------------- ------------------------------------------------------------------------------------------ ---------------------------------------------TOTAL ASSETS (B + C + D + E) 880,866,130.13 965,218,632.25--------------------------------------------- ------------------------------------------------------------------------------------------ ---------------------------------------------DEBIT MEMO ACCOUNTS2. Guarantees and collateral securities 765,696,504.65 771,243,568.164. Other contra accounts 0.00 1,337.00--------------------------------------------- ---------------------------------------------765,696,504.65 771,244,905.16--------------------------------------------- ------------------------------------------------------------------------------------------ ---------------------------------------------