ASSETSMINOAN LINES SHIPPING S.A.SIXTH CONSOLIDATED BALANCE SHEETPUBLIC LIMITED COMPANIESCurrent Financial Year <strong>2003</strong> Previous Financial Year 2002EUROEUROBook Value Depreciation Net Book Value Book Value Depreciation Net Book ValueB. FORMATION EXPENSES1. Start - up costs 43,236.36 35,380.53 7,855.83 43,236.36 26,947.06 16,289.302. Exchange rate adjustments on loans for acquisitions 3,202,394.72 757,861.22 2,444,533.50 5,525,373.82 2,322,979.10 3,202,394.723. Construction Period Interest cost 7,330,689.04 5,587,212.59 1,743,476.45 7,330,689.04 4,388,332.77 2,942,356.274. Other formation expenses 13,230,262.98 12,061,559.16 1,168,703.82 15,223,338.92 12,622,369.48 2,600,969.44--------------------------------------------- --------------------------------------------- --------------------------------------------- --------------------------------------------- --------------------------------------------- ---------------------------------------------C. FIXED ASSETS23,806,583.10 18,442,013.50 5,364,569.60 28,122,638.14 19,360,628.41 8,762,009.73--------------------------------------------- --------------------------------------------- --------------------------------------------- --------------------------------------------- --------------------------------------------- ------------------------------------------------------------------------------------------ --------------------------------------------- --------------------------------------------- --------------------------------------------- --------------------------------------------- ---------------------------------------------I. Intangible Assets1. Research and Development expenses 605,399.19 345,110.00 260,289.19 560,075.41 224,030.16 336,045.252. Concessions Trademarks, Rights & Licenses 29,347.03 29,347.02 0.01 29,347.03 29,347.02 0.015. Other Intangible Assets 233,396.14 157,709.95 75,686.19 891,414.80 766,654.51 124,760.29--------------------------------------------- --------------------------------------------- --------------------------------------------- --------------------------------------------- --------------------------------------------- ---------------------------------------------868,142.36 532,166.97 335,975.39 1,480,837.24 1,020,031.69 460,805.55--------------------------------------------- --------------------------------------------- --------------------------------------------- --------------------------------------------- --------------------------------------------- ------------------------------------------------------------------------------------------ --------------------------------------------- --------------------------------------------- --------------------------------------------- --------------------------------------------- ---------------------------------------------ΙΙ. Tangible Assets1. Land 4,173,358.84 0.00 4,173,358.84 3,955,478.52 0.00 3,955,478.523. Buildings and technical work 5,863,053.65 2,503,047.51 3,360,006.14 5,778,295.82 2,374,564.04 3,403,731.785. Transportation means 138,101.66 94,007.42 44,094.24 136,939.83 80,357.07 56,582.765a. Vessels 792,733,203.75 876,928,347.04Less: Provisions for devaluation 0.00 792,733,203.75 52,793,011.51 739,940,192.24 22,400,000.00 854,528,347.04 40,823,217.83 813,705,129.21--------------------------------------------- ---------------------------------------------6. Furniture and Fixtures --------------------------------------------- 3,655,031.78 --------------------------------------------- 2,862,733.45 --------------------------------------------- 792,298.33 --------------------------------------------- 3,552,911.41 --------------------------------------------- 2,467,137.39 ---------------------------------------------1,085,774.02806,562,749.68 58,252,799.89 748,309,949.79 867,951,972.62 45,745,276.33 822,206,696.29--------------------------------------------- --------------------------------------------- --------------------------------------------- --------------------------------------------- --------------------------------------------- ---------------------------------------------TOTAL FIXED ASSETS (CI + CII) 748,645,925.18 822,667,501.84--------------------------------------------- ---------------------------------------------ΙΙΙ. Investments and other Long - Term Assets1a. Holdings in Associated companies 73,180,210.60 70,772,252.542. Investments in other companies 25,314.38 25,314.38 0.00Less: Provisions for devaluation 14,846.61 10,467.77 0.00 25,314.38--------------------------------------------- ---------------------------------------------7. Other Long - Term Assets 28,780.65 27,780.00--------------------------------------------- ---------------------------------------------73,219,459.02 70,825,346.92--------------------------------------------- ------------------------------------------------------------------------------------------ ---------------------------------------------TOTAL FIXED ASSETS EMPLOYED (CI + CII + CIII) 821,865,384.20 893,492,848.76--------------------------------------------- ------------------------------------------------------------------------------------------ ---------------------------------------------D. CURRENT ASSETSΙ. Inventories1. Merchandise 2,472,054.24 2,761,988.284. Consumables - Spare Parts 1,405,240.69 1,790,971.605. Advances against inventories purchase 0.00 1,496.76--------------------------------------------- ---------------------------------------------3,877,294.93 4,554,456.64--------------------------------------------- ------------------------------------------------------------------------------------------ ---------------------------------------------ΙΙ. Debtors1. Trade Debtors 10,425,440.68 6,972,359.422. Bills receivable 99,729.69 0.003a. Items for collection- In portfolio 1,027,416.88 2,470,461.07- In Banks 18,348,618.32 19,376,035.20 18,869,543.08 21,340,004.15--------------------------------------------- ---------------------------------------------6. Short - Term Receivables from associated companies 449,859.03 2,176,166.7010. Doubtful trade debtors and receivables 1,488,348.55 1,282,317.79Less: Provisions for doubtful accounts 75,413.88 1,412,934.67 75,413.88 1,206,903.91--------------------------------------------- ---------------------------------------------11. Other Debtors 2,864,956.28 10,552,408.7512. Advances and prepayments 1,970.85 24,835.18--------------------------------------------- ---------------------------------------------34,630,926.40 42,272,678.11--------------------------------------------- ------------------------------------------------------------------------------------------ ---------------------------------------------ΙΙΙ. Marketable Securities1. Shares 23,810,529.88 18,734,255.69Less: Provisions for devaluation 18,569,940.09 5,240,589.79 14,363,345.29 4,370,910.40--------------------------------------------- --------------------------------------------- --------------------------------------------- ------------------------------------------------------------------------------------------ ---------------------------------------------ΙV. Cash1. Cash in hand 230,937.87 186,947.543. Sight and time Deposits 2,739,339.81 1,292,239.36--------------------------------------------- ---------------------------------------------2 970 277.68 1 479 186.90--------------------------------------------- ------------------------------------------------------------------------------------------ ---------------------------------------------TOTAL CURRENT ASSETS (DI+ DII+ DIII+ DIV) 46,719,088.80 52,677,232.05--------------------------------------------- ------------------------------------------------------------------------------------------ ---------------------------------------------Ε. TEMPORARY ASSETS1. Deferred Expenses 3,296,522.04 1,820,497.212. Accrued income 36,928.25 35,869.763. Other asset suspense accounts 16,244.95 24,679.10--------------------------------------------- ---------------------------------------------3,349,695.24 1,881,046.07--------------------------------------------- ------------------------------------------------------------------------------------------ ---------------------------------------------TOTAL ASSETS (B + C + D + E) 877,298,737.84 956,813,136.61--------------------------------------------- ------------------------------------------------------------------------------------------ ---------------------------------------------DEBIT MEMO ACCOUNTS1. Third parties assets 0.00 12,286.132. Guarantees and collateral securities 770,349,562.56 776,100,033.584. Other contra accounts 0.00 1,337.00--------------------------------------------- ---------------------------------------------770,349,562.56 776,113,656.71--------------------------------------------- ------------------------------------------------------------------------------------------ ---------------------------------------------
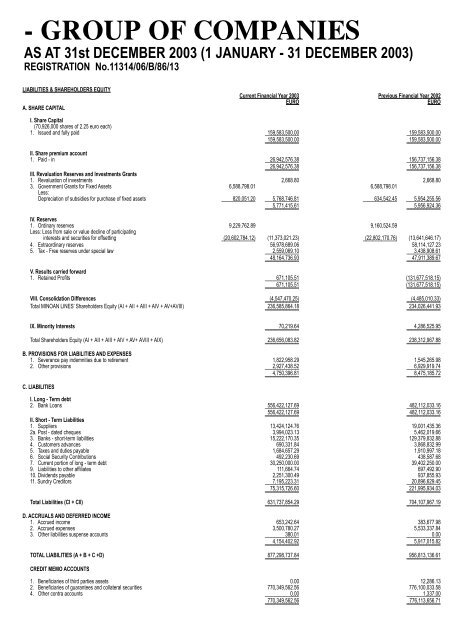
- GROUP OF COMPANIESAS AT 31st DECEMBER <strong>2003</strong> (1 JANUARY - 31 DECEMBER <strong>2003</strong>)REGISTRATION No.11314/06/Β/86/13LIABILITIES & SHAREHOLDERS EQUITYΑ. SHARE CAPITALCurrent Financial Year <strong>2003</strong> Previous Financial Year 2002EUROEUROΙ. Share Capital(70,926,000 shares of 2.25 euro each)1. Issued and fully paid 159,583,500.00 159,583,500.00--------------------------------------------- ---------------------------------------------159,583,500.00 159,583,500.00--------------------------------------------- ------------------------------------------------------------------------------------------ ---------------------------------------------ΙΙ. Share premium account1. Paid - in --------------------------------------------- 26,942,576.38 ---------------------------------------------156,737,156.3826,942,576.38 156,737,156.38--------------------------------------------- ------------------------------------------------------------------------------------------ ---------------------------------------------ΙΙΙ. Revaluation Reserves and Investments Grants1. Revaluation of investments 2,668.80 2,668.803. Government Grants for Fixed Assets 6,588,798.01 6,588,798.01Less:Depreciation of subsidies for purchase of fixed assets 820,051.20 5,768,746.81 634,542.45 5,954,255.56--------------------------------------------- --------------------------------------------- --------------------------------------------- ---------------------------------------------5,771,415.61 5,956,924.36--------------------------------------------- ------------------------------------------------------------------------------------------ ---------------------------------------------IV. Reserves1. Ordinary reserves 9,229,762.89 9,160,524.59Less: Loss from <strong>sa</strong>le or value decline of participatinginterests and securities for offsetting (20,602,784.12) (11,373,021.23) (22,802,170.76) (13,641,646.17)--------------------------------------------- ---------------------------------------------4. Extraordinary reserves 56,978,689.06 58,114,127.235. Tax - Free reserves under special law 2,559,069.10 3,438,908.61--------------------------------------------- ---------------------------------------------48,164,736.93 47,911,389.67--------------------------------------------- ------------------------------------------------------------------------------------------ ---------------------------------------------V. Results carried forward1. Retained Profits --------------------------------------------- 671,105.51 (131,677,518.15)---------------------------------------------671,105.51 (131,677,518.15)--------------------------------------------- ---------------------------------------------VIII. Consolidation Differences (4,547,470.25) (4,485,010.33)--------------------------------------------- ---------------------------------------------Total MINOAN LINES’ Shareholders Equity (ΑΙ + ΑΙΙ + ΑΙΙΙ + AIV + AV+ΑVIII) 236,585,864.18 234,026,441.93--------------------------------------------- ---------------------------------------------IX. Minority Interests 70,219.64 4,286,525.95--------------------------------------------- ------------------------------------------------------------------------------------------ ---------------------------------------------Total Shareholders Equity (ΑΙ + ΑΙΙ + ΑΙΙΙ + AIV + AV+ ΑVIII + AIX) 236,656,083.82 238,312,967.88--------------------------------------------- ------------------------------------------------------------------------------------------ ---------------------------------------------Β. PROVISIONS FOR LIABILITIES AND EXPENSES1. Severance pay indemnities due to retirement 1,822,958.29 1,545,265.982. Other provisions 2,927,438.52 6,929,919.74--------------------------------------------- ---------------------------------------------C. LIABILITIES4,750,396.81 8,475,185.72--------------------------------------------- ------------------------------------------------------------------------------------------ ---------------------------------------------I. Long - Term debt2. Bank Loans --------------------------------------------- 556,422,127.69 ---------------------------------------------482,112,033.16556,422,127.69 482,112,033.16--------------------------------------------- ------------------------------------------------------------------------------------------ ---------------------------------------------ΙΙ. Short - Term Liabilities1. Suppliers 13,424,124.7619,001,435.362a. Post - dated cheques 3,994,023.13 5,462,019.663. Banks - short-term liabilities 15,222,170.35 129,379,832.884. Customers advances 690,331.84 3,868,832.995. Taxes and duties payable 1,684,657.29 1,910,997.186. Social Security Contributions 492,230.69 438,587.687. Current portion of long - term debt 30,250,000.00 39,402,250.009. Liabilities to other affiliates 111,664.74 697,492.9010. Dividends payable 2,251,300.49 937,855.9311. Sundry Creditors 7,195,223.31 20,896,629.45--------------------------------------------- ---------------------------------------------75,315,726.60 221,995,934.03--------------------------------------------- ------------------------------------------------------------------------------------------ ---------------------------------------------Total Liabilities (CI + CII) 631,737,854.29 704,107,967.19--------------------------------------------- ------------------------------------------------------------------------------------------ ---------------------------------------------D. ACCRUALS AND DEFERRED INCOME1. Accrued income 653,242.64 383,677.982. Accrued expenses 3,500,780.27 5,533,337.843. Other liabilities suspense accounts 380.01 0.00--------------------------------------------- ---------------------------------------------4,154,402.92 5,917,015.82--------------------------------------------- ------------------------------------------------------------------------------------------ ---------------------------------------------TOTAL LIABILITIES (A + B + C +D) 877,298,737.84 956,813,136.61--------------------------------------------- ------------------------------------------------------------------------------------------ ---------------------------------------------CREDIT MEMO ACCOUNTS1. Beneficiaries of third parties assets 0.00 12,286.132. Beneficiaries of guarantees and collateral securities 770,349,562.56 776,100,033.584. Other contra accounts 0.00 1,337.00--------------------------------------------- ---------------------------------------------770,349,562.56 776,113,656.71--------------------------------------------- ------------------------------------------------------------------------------------------ ---------------------------------------------