chapter twelve tables, charts, and graphs - SurgicalCriticalCare.net
chapter twelve tables, charts, and graphs - SurgicalCriticalCare.net
chapter twelve tables, charts, and graphs - SurgicalCriticalCare.net

You also want an ePaper? Increase the reach of your titles
YUMPU automatically turns print PDFs into web optimized ePapers that Google loves.
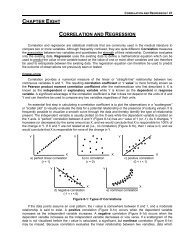
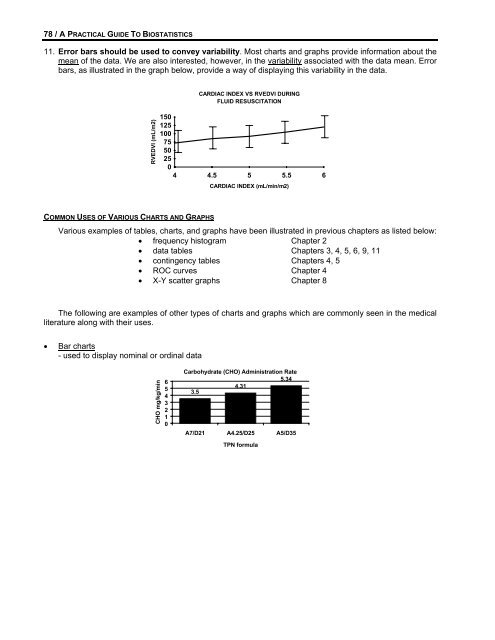
78 / A PRACTICAL GUIDE TO BIOSTATISTICS11. Error bars should be used to convey variability. Most <strong>charts</strong> <strong>and</strong> <strong>graphs</strong> provide information about themean of the data. We are also interested, however, in the variability associated with the data mean. Errorbars, as illustrated in the graph below, provide a way of displaying this variability in the data.CARDIAC INDEX VS RVEDVI DURINGFLUID RESUSCITATIONRVEDVI (mL/m2)15012510075502504 4.5 5 5.5 6CARDIAC INDEX (mL/min/m2)COMMON USES OF VARIOUS CHARTS AND GRAPHSVarious examples of <strong>tables</strong>, <strong>charts</strong>, <strong>and</strong> <strong>graphs</strong> have been illustrated in previous <strong>chapter</strong>s as listed below:• frequency histogram Chapter 2• data <strong>tables</strong> Chapters 3, 4, 5, 6, 9, 11• contingency <strong>tables</strong> Chapters 4, 5• ROC curves Chapter 4• X-Y scatter <strong>graphs</strong> Chapter 8The following are examples of other types of <strong>charts</strong> <strong>and</strong> <strong>graphs</strong> which are commonly seen in the medicalliterature along with their uses.• Bar <strong>charts</strong>- used to display nominal or ordinal dataCHO mg/kg/min6543210Carbohydrate (CHO) Administration Rate5.344.313.5A7/D21 A4.25/D25 A5/D35TPN formula