chapter twelve tables, charts, and graphs - SurgicalCriticalCare.net
chapter twelve tables, charts, and graphs - SurgicalCriticalCare.net
chapter twelve tables, charts, and graphs - SurgicalCriticalCare.net

You also want an ePaper? Increase the reach of your titles
YUMPU automatically turns print PDFs into web optimized ePapers that Google loves.
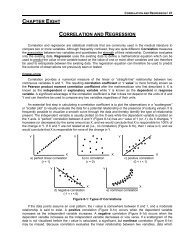
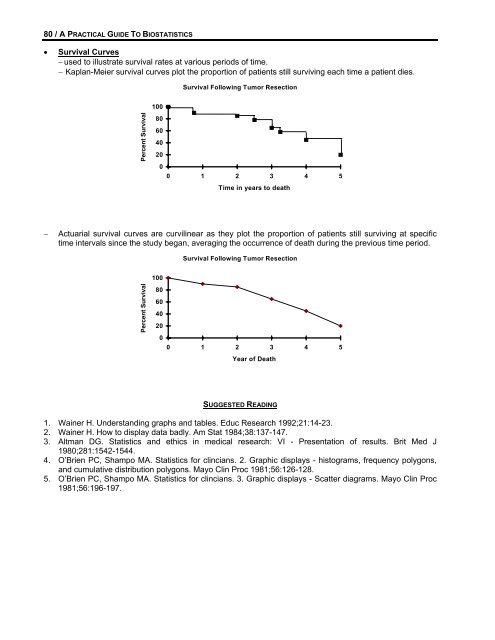
80 / A PRACTICAL GUIDE TO BIOSTATISTICS• Survival Curves− used to illustrate survival rates at various periods of time.− Kaplan-Meier survival curves plot the proportion of patients still surviving each time a patient dies.Survival Following Tumor Resection100Percent Survival8060402000 1 2 3 4 5Time in years to death−Actuarial survival curves are curvilinear as they plot the proportion of patients still surviving at specifictime intervals since the study began, averaging the occurrence of death during the previous time period.Survival Following Tumor ResectionPercent Survival1008060402000 1 2 3 4 5Year of DeathSUGGESTED READING1. Wainer H. Underst<strong>and</strong>ing <strong>graphs</strong> <strong>and</strong> <strong>tables</strong>. Educ Research 1992;21:14-23.2. Wainer H. How to display data badly. Am Stat 1984;38:137-147.3. Altman DG. Statistics <strong>and</strong> ethics in medical research: VI - Presentation of results. Brit Med J1980;281:1542-1544.4. O’Brien PC, Shampo MA. Statistics for clincians. 2. Graphic displays - histograms, frequency polygons,<strong>and</strong> cumulative distribution polygons. Mayo Clin Proc 1981;56:126-128.5. O’Brien PC, Shampo MA. Statistics for clincians. 3. Graphic displays - Scatter diagrams. Mayo Clin Proc1981;56:196-197.