Rabbit control in the Parwan Valley and its value for catchment
Rabbit control in the Parwan Valley and its value for catchment
Rabbit control in the Parwan Valley and its value for catchment

Create successful ePaper yourself
Turn your PDF publications into a flip-book with our unique Google optimized e-Paper software.
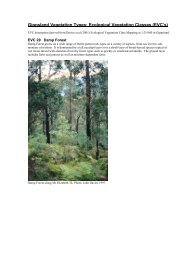
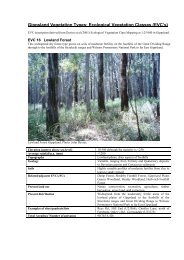
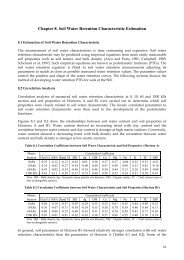
Plate 1 - Photograph taken <strong>in</strong> autumn 1989 illustrat<strong>in</strong>g effects of rabbit exclusion. Full details are given <strong>in</strong> <strong>the</strong> text.3.4 <strong>Rabbit</strong> number surveys <strong>in</strong> <strong>the</strong> <strong>Parwan</strong><strong>Valley</strong><strong>Rabbit</strong> numbers <strong>in</strong> <strong>the</strong> <strong>Parwan</strong> <strong>Valley</strong> have beensurveyed by <strong>the</strong> Department (D. McPhan l ,unpublished data). Thirteen surveys were made <strong>in</strong>different seasons from 1985 to 1989. The data from<strong>the</strong>se rabbit surveys have been used to f<strong>in</strong>d where <strong>the</strong>rabb<strong>its</strong> are located on <strong>the</strong> l<strong>and</strong>scape, <strong>and</strong> <strong>the</strong>irdensity.Surveys were made <strong>in</strong> <strong>the</strong> early even<strong>in</strong>g, start<strong>in</strong>gafter dusk. <strong>Rabbit</strong> numbers were observed byspotlight from a vehicle driv<strong>in</strong>g slowly along a 9 kmtransect <strong>in</strong> <strong>the</strong> <strong>Parwan</strong> valley. Estimated range of <strong>the</strong>spotlight is 50 metres. The location of <strong>the</strong> transect isshown <strong>in</strong> figure 3. <strong>Rabbit</strong>s were counted on bothsides of <strong>the</strong> vehicle path. Counts were recorded at 0.5km <strong>in</strong>tervals from a stationary vehicle. The meannumber of rabb<strong>its</strong> along <strong>the</strong> transect over <strong>the</strong> period1985 to 1989 is shown <strong>in</strong> figure 4. To illustrate <strong>the</strong>extreme situation, results are also shown of <strong>the</strong>survey on 18 January 1988, when rabbit numberswere high. <strong>Rabbit</strong> numbers tend to be higher nearpreferred habitat or where it is difficult to poison,e.g., at <strong>the</strong> foot of steep slopes.<strong>Valley</strong>. Results are shown <strong>in</strong> table 4.3.5 Measurements of biomassTwo sets of plots were studied to quantify <strong>the</strong>changes <strong>in</strong> vegetation follow<strong>in</strong>g rabbit exclusion. Thefirst set was <strong>in</strong> pastured l<strong>and</strong> of <strong>the</strong> ma<strong>in</strong> <strong>catchment</strong>;<strong>the</strong> second on <strong>the</strong> ridge of <strong>the</strong> White Elephant Hill.The site <strong>in</strong> <strong>the</strong> pasture had a north-west aspect <strong>and</strong>was near rabbit activity. Grasses present are mostlyDanthonia species. The site on <strong>the</strong> ridge had littlerabbit activity s<strong>in</strong>ce 1986. Grasses are Danthoniaspecies, with a small amount of Poa labillardieri.The method was <strong>the</strong> same at both sites. An area of 1m 2 was harvested from <strong>the</strong> exclusion plot <strong>and</strong> from<strong>the</strong> adjacent area. Material was dried at 45°C <strong>for</strong> 4hours <strong>and</strong> weighed to determ<strong>in</strong>e biomass. Results aregiven <strong>in</strong> table 5. Because <strong>the</strong> vegetation is mostlynative grasses <strong>and</strong> mosses, <strong>the</strong> overall ground coverhas been subdivided to show <strong>the</strong>ir relativecontributions. These <strong>value</strong>s are <strong>in</strong>cluded <strong>in</strong> table 5.Science Officer, Department of Conservation <strong>and</strong>Natural Resources, Bacchus Marsh Numbers arelower where ma<strong>in</strong>tenance is done <strong>and</strong> conditions areharsher, e.g., near <strong>the</strong> road with <strong>the</strong> rabbit prooffence. Survey po<strong>in</strong>ts 15 to 18 give <strong>the</strong> closestapproximation to <strong>the</strong> l<strong>and</strong>scape with<strong>in</strong> <strong>the</strong>experimental area.<strong>Rabbit</strong> numbers have been averaged along <strong>the</strong> surveytransect <strong>for</strong> a given l<strong>and</strong> use classification, as def<strong>in</strong>ed<strong>in</strong> Hexter et al. (1956). Results are shown <strong>in</strong> table 3.Simple arithmetic <strong>the</strong>n gives <strong>the</strong> expected density ofrabb<strong>its</strong> <strong>for</strong> that l<strong>and</strong> use class throughout <strong>the</strong> <strong>Parwan</strong>