Rabbit control in the Parwan Valley and its value for catchment
Rabbit control in the Parwan Valley and its value for catchment
Rabbit control in the Parwan Valley and its value for catchment

You also want an ePaper? Increase the reach of your titles
YUMPU automatically turns print PDFs into web optimized ePapers that Google loves.
RABBIT CONTROL IN THE PARWAN VALLEY ANDITS VALUE FOR CATCHMENT MANAGEMENTSeptember 1995CENTRE FOR LAND PROTECTION RESEARCHTechnical Report No. 26Richard Hartl<strong>and</strong> <strong>and</strong> Michael PapworthISBN No. 0 7306 6107 5ISSN No. 1038-216XL<strong>and</strong> <strong>and</strong> Catchment Protection Branch, Department ofConservation & Natural Resources
Hartl<strong>and</strong>, Richard, 1944 –<strong>Rabbit</strong> <strong>control</strong> <strong>in</strong> <strong>the</strong> <strong>Parwan</strong> <strong>Valley</strong> <strong>and</strong> <strong>its</strong> <strong>value</strong> <strong>for</strong> <strong>catchment</strong> management.Bibliography.ISBN 0 7306 6107 5.1. <strong>Rabbit</strong>s - Control - Victoria - <strong>Parwan</strong> Creek <strong>Valley</strong>. 2. Watershed management Control - Victoria - <strong>Parwan</strong> Creek <strong>Valley</strong>. I. Papworth,M.P. II. Victoria. L<strong>and</strong> Protection Branch. III. Centre <strong>for</strong> L<strong>and</strong> Protection Research. IV. Title. (Series : Technical report (Centre <strong>for</strong> L<strong>and</strong>Protection Research (Vic.)) ; no. 26 ).632.69322
CONTENTSABSTRACT...................................................................................................................................... 51. INTRODUCTION ........................................................................................................................ 52. DESCRIPTION OF THE SITE .................................................................................................... 52.1 Location .................................................................................................................................. 52.2 Instrumentation ....................................................................................................................... 52.2 L<strong>and</strong>scape ............................................................................................................................... 72.3 Soils ........................................................................................................................................ 73.1 Reclamation at Western end of White Elephant Hills ............................................................ 73.2 The fenc<strong>in</strong>g plan ..................................................................................................................... 83.3 The development of targetted poison<strong>in</strong>g ................................................................................ 83.4 <strong>Rabbit</strong> number surveys <strong>in</strong> <strong>the</strong> <strong>Parwan</strong> <strong>Valley</strong>....................................................................... 103.5 Measurements of biomass..................................................................................................... 104. RABBIT EXCLUSION AND HYDROLOGY .......................................................................... 134.1 Estimation of surface run-off from <strong>the</strong> north face of <strong>the</strong> White Elephant Hill..................... 134.2 Water balance model ............................................................................................................ 144.3 Results............................................................................................................................. 155. FINANCIAL ANALYSIS ...................................................................................................... 155.1 Costs................................................................................................................................ 155.1.1 Personnel time................................................................................................................ 155.1.2 Cost of poisoned carrots ............................................................................................... 165.1.3 Cost of new fences......................................................................................................... 165.1.4 Cost <strong>for</strong> repair of exist<strong>in</strong>g fences kg bags...................................................................... 165.1.5 Summary of costs........................................................................................................... 175.2 Benef<strong>its</strong> ................................................................................................................................. 176. DISCUSSION............................................................................................................................. 186.1 The success of <strong>the</strong> rabbit <strong>control</strong> strategy............................................................................. 186.2 The relationship of rabb<strong>its</strong> <strong>and</strong> run-off, <strong>and</strong> possible mechanisms ...................................... 196.3 Future management recommendations ................................................................................. 197. CONCLUSIONS ........................................................................................................................ 208. ACKNOWLEDGEMENTS........................................................................................................ 209. REFERENCES ........................................................................................................................... 20List of PlatesPlate 1 - Photograph taken <strong>in</strong> autumn 1989 illustrat<strong>in</strong>g effects of rabbit exclusion. Full details aregiven <strong>in</strong> <strong>the</strong> text............................................................................................................................... 10List of FiguresFigure 1. Location of study site show<strong>in</strong>g relationship of experimental area <strong>and</strong> White ElephantReserve.............................................................................................................................................. 6Figure 2. White Elephant Reserve show<strong>in</strong>g poison trails................................................................. 9Figure 3. Location of transect <strong>in</strong> <strong>Parwan</strong> <strong>Valley</strong> <strong>for</strong> rabbit surveys, <strong>and</strong> survey po<strong>in</strong>ts................. 11Figure 4. Results of rabbit surveys, 1985 to 1989 .......................................................................... 12Figure 5. Water Balance Model. Difference between Observed <strong>and</strong> Predicted Values (mm) ....... 12Figure 6 Mean monthly differences between observed run-off <strong>and</strong> <strong>value</strong>s predicted from waterbalance model ................................................................................................................................. 16
List of TablesTable 1. Some characteristics of <strong>the</strong> <strong>Parwan</strong> sub<strong>catchment</strong>s............................................................ 7Table 2. Application rates of poisoned carrots on sites of rabbit activity ........................................ 8Table 3. Mean rabbit numbers observed on homogeneous l<strong>and</strong>scape............................................ 13Table 4. Mean rabbit density <strong>for</strong> surveyed l<strong>and</strong> class <strong>in</strong> <strong>Parwan</strong> <strong>Valley</strong>........................................ 13Table 5. Characteristics of biomass at given sites .......................................................................... 13Table 6. Components of l<strong>and</strong>scape of <strong>the</strong> vegetated area on <strong>the</strong> lower slopes <strong>in</strong> 1978.................. 14Table 7. Empirical model parameters ............................................................................................. 15Table 8 Costs <strong>for</strong> supply of poisoned carrots ................................................................................. 16Table 9 Costs of fenc<strong>in</strong>g ................................................................................................................. 17Table 10 Summary of costs ............................................................................................................ 17
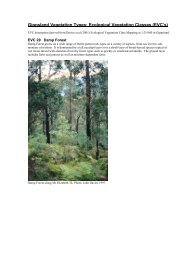
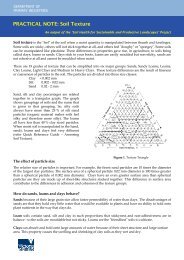
RABBIT CONTROL IN THE PARWAN VALLEY ANDITS VALUE FOR CATCHMENT MANAGEMENTSeptember 1995R. HARTLAND AND M.P. PAPWORTHCentre <strong>for</strong> L<strong>and</strong> Protection Research, Department of Conservation & NaturalResources, 5/250 Victoria Pde, East Melbourne. Vic. 3002ABSTRACTThe highly eroded slopes of <strong>the</strong> White Elephant Hills provide ideal harbour <strong>for</strong> a rabbit population which can disperse readily <strong>in</strong>to<strong>the</strong> surround<strong>in</strong>g farml<strong>and</strong>s. The nature of <strong>the</strong> terra<strong>in</strong> makes eradicat<strong>in</strong>g rabb<strong>its</strong> from <strong>the</strong>se sites extremely difficult. <strong>Rabbit</strong>s areimplicated <strong>in</strong> <strong>the</strong> major soil erosion problems of <strong>the</strong> area. <strong>Rabbit</strong> numbers fell to very low levels dur<strong>in</strong>g <strong>the</strong> 1982-83 drought, <strong>and</strong><strong>the</strong> opportunity was taken to <strong>in</strong>tensify rabbit <strong>control</strong> measures. It was recognized that <strong>the</strong> problem would be much more difficult toaddress when rabbit numbers were high.Ma<strong>in</strong>tenance of very low rabbit numbers has been achieved by fenc<strong>in</strong>g off small areas <strong>and</strong> <strong>the</strong>n targeted poison<strong>in</strong>g at sites of rabbitactivity. Consequently, <strong>the</strong>re has been a dramatic <strong>in</strong>crease <strong>in</strong> <strong>the</strong> regeneration of trees, shrubs <strong>and</strong> grasses, <strong>and</strong> particularly <strong>in</strong> <strong>the</strong>survival of tree <strong>and</strong> shrub seedl<strong>in</strong>gs over much of <strong>the</strong> White Elephant Reserve. Experimental equipment already <strong>in</strong> place hasidentified a 20% decrease <strong>in</strong> average annual surface run-off, attributed to <strong>the</strong> greater biomass with <strong>in</strong>creased <strong>in</strong>filtration <strong>and</strong>evapotranspiration.This <strong>in</strong>crease <strong>in</strong> pasture production corresponds <strong>in</strong> general terms to an improvement <strong>in</strong> <strong>the</strong> gross marg<strong>in</strong> of approximately 1DSE/ha. The implications of rabbit <strong>control</strong> <strong>for</strong> <strong>catchment</strong> management both <strong>in</strong> <strong>the</strong> <strong>Parwan</strong> valley <strong>and</strong> more generally are exam<strong>in</strong>ed.1. INTRODUCTIONSome fifty years ago, <strong>in</strong>terest <strong>in</strong> <strong>the</strong> <strong>Parwan</strong> valley was <strong>in</strong>itiated bytwo processes, erosion <strong>and</strong> sediment transport. It was recorded thatMelton reservoir was rapidly los<strong>in</strong>g <strong>its</strong> water capacity as it filledwith sediment. The high sedimentation rate was <strong>the</strong> result ofexcessive soil erosion, predom<strong>in</strong>antly from <strong>the</strong> <strong>Parwan</strong> <strong>Valley</strong>.The <strong>Parwan</strong> Creek <strong>catchment</strong> occupies only 17% of <strong>the</strong> total<strong>catchment</strong> area above Melton reservoir.The <strong>Parwan</strong> experimental area was established <strong>in</strong> 1953 by <strong>the</strong> SoilConservation Authority. It is located with<strong>in</strong> <strong>the</strong> White ElephantReserve, now owned by <strong>the</strong> Victorian government (figure 1).The objectives <strong>in</strong> establish<strong>in</strong>g <strong>the</strong> project were to ga<strong>in</strong> a greaterunderst<strong>and</strong><strong>in</strong>g of <strong>the</strong> hydrological processes operat<strong>in</strong>g <strong>in</strong> an eroded<strong>catchment</strong>, to determ<strong>in</strong>e <strong>the</strong> relationship between ra<strong>in</strong>fall <strong>and</strong> runoff,<strong>and</strong> to evaluate <strong>the</strong> effects of remedial l<strong>and</strong> use <strong>and</strong> pastoralpractices.While certa<strong>in</strong> management factors have been deliberatelymanipulated, rabbit <strong>in</strong>festation has varied across <strong>the</strong> experimental<strong>catchment</strong>s. The length of record enables some assessments to bemade of <strong>the</strong>se changes.2. DESCRIPTION OF THE SITE2.1 LocationThe White Elephant Reserve covers some 300 ha, <strong>and</strong> islocated about 16 km south-west of Bacchus Marsh, 53 kmwest of Melbourne, Victoria (figure 1). The <strong>Parwan</strong>experimental area covers 94.5 ha <strong>and</strong> is located with<strong>in</strong> <strong>the</strong>Reserve. Coord<strong>in</strong>ates of <strong>the</strong> area are latitude 37°41' south,longitude 144°20' east. There are seven referencesub<strong>catchment</strong>s with<strong>in</strong> <strong>the</strong> area. The orientation of <strong>the</strong>sub<strong>catchment</strong>s is shown <strong>in</strong> figure 1, <strong>and</strong> somecharacteristics are given <strong>in</strong> table 1.2.2 InstrumentationClimate data is collected at a meteorology station locatedwith<strong>in</strong> <strong>the</strong> area (figure 1). There is a cont<strong>in</strong>ual record of <strong>the</strong>key climatic factors (ra<strong>in</strong>fall amount <strong>and</strong> <strong>in</strong>tensity, w<strong>in</strong>dspeed <strong>and</strong> direction, temperature <strong>and</strong> humidity <strong>and</strong> panevaporation). Surface run-off from <strong>the</strong> six smallsub<strong>catchment</strong>s is recorded through a 300mm H-type flumeconnected to a still<strong>in</strong>g chamber. Surface run-off from <strong>the</strong>ma<strong>in</strong> channel is estimated by a 120° broad-crested weir <strong>and</strong>float recorder. In 1978, a sharp-crested weir was <strong>in</strong>stalled.Water level is recorded on L & S type A35 recorders. Amore detailed description of <strong>the</strong> <strong>in</strong>strumentation is given <strong>in</strong>Wu (1980) <strong>and</strong> Wu et al. (1986). The average annualra<strong>in</strong>fall is approximately 530 mm, while average annualevaporation is 1540 mm, a deficit <strong>in</strong> <strong>the</strong> annual waterbalance of 1010 mm.
Figure 1. Location of study site show<strong>in</strong>g relationship of experimental area <strong>and</strong> White Elephant Reserve
Table 1. Some characteristics of <strong>the</strong> <strong>Parwan</strong> sub<strong>catchment</strong>sNumber 1 2 3 4 5 6 7aspect north north north south south south northarea (ha) 1.5 1.5 1.5 1.6 1.6 1.6 80.9l<strong>and</strong> cover woodl<strong>and</strong> permanentpasturenative pasture woodl<strong>and</strong> permanentpasturenative pasture see Table 62.2 L<strong>and</strong>scapeThe l<strong>and</strong>scape of <strong>the</strong> experimental area has twodom<strong>in</strong>ant features; <strong>the</strong> north face of <strong>the</strong> WhiteElephant Hill (27 ha), which has slopes of 20° to 30°,<strong>and</strong> <strong>the</strong> lower slopes (54 ha) which are relatively flat(5° to 10°').The development of <strong>the</strong> Rowsley fault l<strong>in</strong>e hasremoved any stable base po<strong>in</strong>t <strong>in</strong> <strong>the</strong> stream system.Consequently, <strong>the</strong> <strong>Parwan</strong> Creek cont<strong>in</strong>ues to downcut, disturb<strong>in</strong>g <strong>the</strong> side slopes of <strong>the</strong> <strong>Parwan</strong> <strong>Valley</strong>.The comb<strong>in</strong>ation of a geomorphic <strong>in</strong>stability, basaltcapp<strong>in</strong>g <strong>and</strong> highly unstable substrate has resulted <strong>in</strong>a range of l<strong>and</strong> degradation problems, <strong>in</strong>clud<strong>in</strong>g gullyerosion, sheet erosion <strong>and</strong> mass movement.2.3 SoilsThe soils of <strong>the</strong> experimental area are of Mioceneorig<strong>in</strong>. The surface soil horizon has compactedfollow<strong>in</strong>g removal of vegetation. Ra<strong>in</strong>drop action hasproduced a widespread crusty surface layer. Thelower soil horizon has very poor structure <strong>and</strong> quicklyloses stability when wet (Hexter et al. 1956).Consequently, sheet <strong>and</strong> gully erosion are widespreadon <strong>the</strong> White Elephant Hills. The major problem is<strong>the</strong> extensive tunnel erosion, which <strong>in</strong> places hasdeveloped <strong>in</strong>to gullies up to 5 metres deep (Hexter etal. 1956). These sites provide harbour <strong>for</strong> rabb<strong>its</strong>.Where <strong>the</strong> surface layer of soil has been eroded, <strong>the</strong>ground cover degrades until eventually, only lichenssurvive (Forbes, 1948).3. STRATEGY FOR RABBIT CONTROLWITHIN THE RESERVEThe strategy <strong>for</strong> rabbit <strong>control</strong> started when <strong>the</strong>response of <strong>the</strong> experimental plot to fenc<strong>in</strong>g wasobserved <strong>in</strong> 1982-83 (Section 3.1). This promptedmore fenc<strong>in</strong>g (Section 3.2) <strong>and</strong> poison<strong>in</strong>g (Section3.3). The results lead to development of <strong>the</strong> plan. Theeffects have been monitored by surveys of rabbitnumbers (Section 3.4), <strong>and</strong> by assessment of <strong>the</strong>change <strong>in</strong> biomass follow<strong>in</strong>g rabbit exclusion(Section 3.5).3.1 Reclamation at Western end of WhiteElephant HillsAn experimental plot of 1.6 ha at <strong>the</strong> western end of<strong>the</strong> White Elephant Hills was fenced <strong>for</strong> rabbitexclusion <strong>in</strong> 1958, <strong>and</strong> 344 trees of 19 species wereplanted with tree guards. However, <strong>the</strong> exclusionfence was not ma<strong>in</strong>ta<strong>in</strong>ed, rabb<strong>its</strong> re<strong>in</strong>fested <strong>and</strong> <strong>the</strong>condition of <strong>the</strong> plot deteriorated. By 1975, <strong>the</strong> fencehad been underm<strong>in</strong>ed to a large degree, <strong>and</strong> gave onlym<strong>in</strong>imal protection. A vegetation survey at that timeshowed that <strong>the</strong>re were 250 survivors from <strong>the</strong>orig<strong>in</strong>al plant<strong>in</strong>g. There were 120 additional shrubs ofAcacia pycnantha (Golden Wattle), which regenerateprofusely <strong>and</strong> appear to be less palatable to rabb<strong>its</strong>,but <strong>the</strong>re were no o<strong>the</strong>r species (Soil ConservationAuthority, unpublished data). In 1982, rabb<strong>its</strong> wereexcluded from <strong>the</strong> plot by repair of <strong>the</strong> fence, bypoison<strong>in</strong>g <strong>and</strong> by lack of food caused by <strong>the</strong> 1982-83drought. The effectiveness of attempts at revegetationwas exam<strong>in</strong>ed, <strong>and</strong> <strong>the</strong> importance of ma<strong>in</strong>ta<strong>in</strong><strong>in</strong>g <strong>the</strong>fences was recognised as a key factor <strong>in</strong> exclud<strong>in</strong>grabb<strong>its</strong>. This lead to <strong>the</strong> development of <strong>the</strong> rabbit<strong>control</strong> strategy. By 1984, an estimated 3000seedl<strong>in</strong>gs had germ<strong>in</strong>ated <strong>in</strong> <strong>the</strong> experimental plot,with most of <strong>the</strong> orig<strong>in</strong>al 19 species be<strong>in</strong>g present.S<strong>in</strong>ce 1984, <strong>the</strong>re has also been extensiveregeneration of understorey native grasses <strong>and</strong>shrubs.
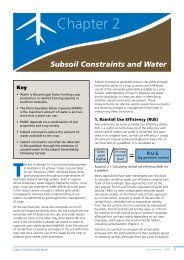
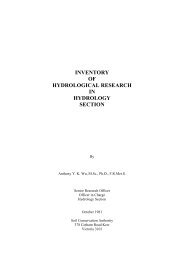
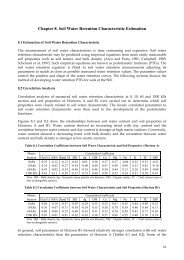
Table 2. Application rates of poisoned carrots on sites of rabbit activityYear 86 87 88 89 90 91 92 93 94Application rate (kg/ha) 7 7 7 7 4 4 4 2 1The complexity of <strong>the</strong> challenge is well illustrated byan example. An eroded area with extensive gullies at<strong>the</strong> west end of <strong>the</strong> White Elephant Hill wasearmarked as a problem area, <strong>and</strong> was fenced off <strong>and</strong>poisoned <strong>in</strong> 1986 (figure 1). At <strong>the</strong> time, <strong>the</strong> Reserveperimeter fence was not <strong>in</strong> good condition, <strong>and</strong>needed repair. <strong>Rabbit</strong>s quickly returned follow<strong>in</strong>g <strong>the</strong>poison<strong>in</strong>g, because <strong>the</strong> fence was low <strong>in</strong> places <strong>and</strong>rabb<strong>its</strong> were able to jump over it. The low sectionsoccurred <strong>for</strong> two reasons. Firstly, cows from <strong>the</strong>adjo<strong>in</strong><strong>in</strong>g farm were push<strong>in</strong>g between <strong>the</strong> rabbit-proofwire <strong>and</strong> <strong>the</strong> barbed wire to graze <strong>the</strong> phalaris, <strong>and</strong>were bend<strong>in</strong>g <strong>the</strong> rabbit-proof wire. Secondly, <strong>the</strong>rewere low spots across an erod<strong>in</strong>g gully. An extraheight of 30 cm of rabbit-proof wire was fitted <strong>in</strong> <strong>the</strong>low sections, which stopped <strong>the</strong> cows but not <strong>the</strong>rabb<strong>its</strong>. A guard of barbed wire 10 cm from <strong>the</strong> top of<strong>the</strong> fence was needed to f<strong>in</strong>ally stop <strong>the</strong> rabb<strong>its</strong>enter<strong>in</strong>g <strong>the</strong> area. Overall, approximately 12 monthselapsed between when <strong>the</strong> area was fenced off <strong>and</strong>when <strong>the</strong>re were visible signs of recovery by <strong>the</strong>vegetation. The condition of <strong>the</strong> area <strong>in</strong> autumn 1989is shown to <strong>the</strong> right of <strong>the</strong> fence <strong>in</strong> Plate 1. The areato <strong>the</strong> left of <strong>the</strong> fence is <strong>the</strong> experimental plotdescribed <strong>in</strong> <strong>the</strong> previous paragraph. The photographwas taken fac<strong>in</strong>g south-east, approximately 10 mfrom <strong>the</strong> fence junction. The site is marked <strong>in</strong> figure1.3.2 The fenc<strong>in</strong>g planWhen <strong>the</strong> Reserve was established <strong>in</strong> <strong>the</strong> 1950s <strong>the</strong>exist<strong>in</strong>g exclusion fence was renewed around <strong>the</strong>perimeter. This fence l<strong>in</strong>ked with <strong>the</strong> boundary fenceof <strong>the</strong> experimental <strong>catchment</strong>s (figure 1). Fencesaround <strong>the</strong> lower slopes section of <strong>the</strong> experimentalarea were ma<strong>in</strong>ta<strong>in</strong>ed from 1975. <strong>Rabbit</strong>s wereexcluded from sub<strong>catchment</strong>s 1 <strong>and</strong> 4 from 1978.Little ma<strong>in</strong>tenance was carried out on <strong>the</strong> Reservefences until 1982, when all fences were repaired byrenew<strong>in</strong>g rusted sections along <strong>the</strong> bottom.The fence around <strong>the</strong> 1.6 ha experimental plot wasrepaired <strong>in</strong> 1982 (figure 2). At <strong>the</strong> time, it was notedthat requirements <strong>for</strong> fenc<strong>in</strong>g ma<strong>in</strong>tenance slowlyreduced after a period of cont<strong>in</strong>ual breaches of <strong>the</strong>nett<strong>in</strong>g fence, which <strong>in</strong>dicated that rabb<strong>its</strong> weredispers<strong>in</strong>g under <strong>the</strong> harsh conditions.fur<strong>the</strong>r areas of <strong>the</strong> White Elephant Hill. In 1985 <strong>and</strong>1986, an additional 14 ha of <strong>the</strong> worst <strong>in</strong>fested siteswere fenced off <strong>in</strong>to exclusion plots. This is marked<strong>in</strong> figure 2. Fenced areas were <strong>the</strong>n <strong>in</strong>corporated <strong>in</strong>todesign <strong>for</strong> detailed poison<strong>in</strong>g described <strong>in</strong> Section3.3.3.3 The development of targetedpoison<strong>in</strong>gPoison<strong>in</strong>g with sodium monofluoroacetate (1080) <strong>in</strong>carrots is <strong>the</strong> preferred method of rabbit <strong>control</strong>. Areview of <strong>the</strong> properties of this compound is given <strong>in</strong>Atzert (1981). Up to 1985, <strong>the</strong> st<strong>and</strong>ard procedure <strong>for</strong>poison<strong>in</strong>g rabb<strong>its</strong> <strong>in</strong> <strong>the</strong> White Elephant Reserve wasto lay a trail along a def<strong>in</strong>ed track us<strong>in</strong>g a bait layer,as shown <strong>in</strong> figure 2. Two poison-free feeds weregiven with a three day <strong>in</strong>terval, <strong>and</strong> <strong>the</strong>n poison waslaid. From 1978 to 1984, an additional trail was laidalong <strong>the</strong> ridge of <strong>the</strong> White Elephant Hill (figure 2),because it was recognised that rabb<strong>its</strong> were us<strong>in</strong>g <strong>the</strong>eroded face of <strong>the</strong> White Elephant Hill to re<strong>in</strong>fest <strong>the</strong>lower slopes. Poison was laid twice along <strong>the</strong> trailover <strong>the</strong> summer of 1982-83. In 1984, <strong>the</strong>re was someadditional poison<strong>in</strong>g by h<strong>and</strong> along <strong>the</strong> gullies. In1985, poison<strong>in</strong>g along <strong>the</strong> st<strong>and</strong>ard trail wasaugmented with aerial poison<strong>in</strong>g, with fur<strong>the</strong>rpoison<strong>in</strong>g by h<strong>and</strong> along some gullies.From 1986 to 1993, <strong>the</strong>re was only h<strong>and</strong> poison<strong>in</strong>g atall sites of rabbit activity (scratches, dung hills <strong>and</strong>feed<strong>in</strong>g sites) throughout <strong>the</strong> Reserve. The <strong>in</strong>tervalbetween h<strong>and</strong> applications was <strong>in</strong>creased to sevendays. Application rates were progressively reduced asrabbit numbers decl<strong>in</strong>ed from levels present prior tofenc<strong>in</strong>g. Application rates on sites of rabbit activityare shown <strong>in</strong> table 2.Fenc<strong>in</strong>g <strong>and</strong> targeted poison<strong>in</strong>g toge<strong>the</strong>r reducedrabbit numbers dramatically while rabb<strong>its</strong> were <strong>in</strong>plague proportions throughout <strong>the</strong> <strong>Parwan</strong> <strong>Valley</strong>.Spotlight surveys made with<strong>in</strong> <strong>the</strong> Reserve oncompletion of targeted poison<strong>in</strong>g <strong>in</strong> 1989 <strong>and</strong> 1990located only two rabb<strong>its</strong>.As noted above, <strong>the</strong> experimental plot regeneratedrapidly follow<strong>in</strong>g repair of <strong>the</strong> fences. This had twoconsequences. Firstly, a high priority was placed onkeep<strong>in</strong>g <strong>the</strong> fences <strong>in</strong> good condition by regularpatroll<strong>in</strong>g <strong>and</strong> ma<strong>in</strong>tenance. Secondly, <strong>the</strong> f<strong>in</strong>d<strong>in</strong>gs<strong>in</strong>dicated what could be expected by fenc<strong>in</strong>g out
Figure 2. White Elephant Reserve show<strong>in</strong>g poison trails
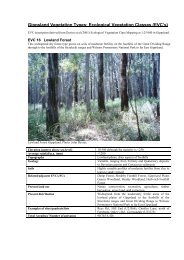
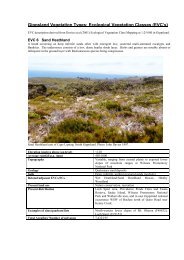
Plate 1 - Photograph taken <strong>in</strong> autumn 1989 illustrat<strong>in</strong>g effects of rabbit exclusion. Full details are given <strong>in</strong> <strong>the</strong> text.3.4 <strong>Rabbit</strong> number surveys <strong>in</strong> <strong>the</strong> <strong>Parwan</strong><strong>Valley</strong><strong>Rabbit</strong> numbers <strong>in</strong> <strong>the</strong> <strong>Parwan</strong> <strong>Valley</strong> have beensurveyed by <strong>the</strong> Department (D. McPhan l ,unpublished data). Thirteen surveys were made <strong>in</strong>different seasons from 1985 to 1989. The data from<strong>the</strong>se rabbit surveys have been used to f<strong>in</strong>d where <strong>the</strong>rabb<strong>its</strong> are located on <strong>the</strong> l<strong>and</strong>scape, <strong>and</strong> <strong>the</strong>irdensity.Surveys were made <strong>in</strong> <strong>the</strong> early even<strong>in</strong>g, start<strong>in</strong>gafter dusk. <strong>Rabbit</strong> numbers were observed byspotlight from a vehicle driv<strong>in</strong>g slowly along a 9 kmtransect <strong>in</strong> <strong>the</strong> <strong>Parwan</strong> valley. Estimated range of <strong>the</strong>spotlight is 50 metres. The location of <strong>the</strong> transect isshown <strong>in</strong> figure 3. <strong>Rabbit</strong>s were counted on bothsides of <strong>the</strong> vehicle path. Counts were recorded at 0.5km <strong>in</strong>tervals from a stationary vehicle. The meannumber of rabb<strong>its</strong> along <strong>the</strong> transect over <strong>the</strong> period1985 to 1989 is shown <strong>in</strong> figure 4. To illustrate <strong>the</strong>extreme situation, results are also shown of <strong>the</strong>survey on 18 January 1988, when rabbit numberswere high. <strong>Rabbit</strong> numbers tend to be higher nearpreferred habitat or where it is difficult to poison,e.g., at <strong>the</strong> foot of steep slopes.<strong>Valley</strong>. Results are shown <strong>in</strong> table 4.3.5 Measurements of biomassTwo sets of plots were studied to quantify <strong>the</strong>changes <strong>in</strong> vegetation follow<strong>in</strong>g rabbit exclusion. Thefirst set was <strong>in</strong> pastured l<strong>and</strong> of <strong>the</strong> ma<strong>in</strong> <strong>catchment</strong>;<strong>the</strong> second on <strong>the</strong> ridge of <strong>the</strong> White Elephant Hill.The site <strong>in</strong> <strong>the</strong> pasture had a north-west aspect <strong>and</strong>was near rabbit activity. Grasses present are mostlyDanthonia species. The site on <strong>the</strong> ridge had littlerabbit activity s<strong>in</strong>ce 1986. Grasses are Danthoniaspecies, with a small amount of Poa labillardieri.The method was <strong>the</strong> same at both sites. An area of 1m 2 was harvested from <strong>the</strong> exclusion plot <strong>and</strong> from<strong>the</strong> adjacent area. Material was dried at 45°C <strong>for</strong> 4hours <strong>and</strong> weighed to determ<strong>in</strong>e biomass. Results aregiven <strong>in</strong> table 5. Because <strong>the</strong> vegetation is mostlynative grasses <strong>and</strong> mosses, <strong>the</strong> overall ground coverhas been subdivided to show <strong>the</strong>ir relativecontributions. These <strong>value</strong>s are <strong>in</strong>cluded <strong>in</strong> table 5.Science Officer, Department of Conservation <strong>and</strong>Natural Resources, Bacchus Marsh Numbers arelower where ma<strong>in</strong>tenance is done <strong>and</strong> conditions areharsher, e.g., near <strong>the</strong> road with <strong>the</strong> rabbit prooffence. Survey po<strong>in</strong>ts 15 to 18 give <strong>the</strong> closestapproximation to <strong>the</strong> l<strong>and</strong>scape with<strong>in</strong> <strong>the</strong>experimental area.<strong>Rabbit</strong> numbers have been averaged along <strong>the</strong> surveytransect <strong>for</strong> a given l<strong>and</strong> use classification, as def<strong>in</strong>ed<strong>in</strong> Hexter et al. (1956). Results are shown <strong>in</strong> table 3.Simple arithmetic <strong>the</strong>n gives <strong>the</strong> expected density ofrabb<strong>its</strong> <strong>for</strong> that l<strong>and</strong> use class throughout <strong>the</strong> <strong>Parwan</strong>
Figure 3. Location of transect <strong>in</strong> <strong>Parwan</strong> <strong>Valley</strong> <strong>for</strong> rabb<strong>its</strong>urveys, <strong>and</strong> survey po<strong>in</strong>ts
Figure 4. Results of rabbit surveys, 1985 to 1989Figure 5. Water Balance Model.Difference between Observed <strong>and</strong> Predicted Values (mm)
Table 3. Mean rabbit numbers observed on homogeneous l<strong>and</strong>scapeL<strong>and</strong>scape unit Basalt plateau Scarp(steep slopes)Paddocks onvalley floorRoad withrabbit prooffencePaddocksaround base ofhillL<strong>and</strong> use class 2A 5 4B 4B 5Mean 11 26 18 9 59Table 4. Mean rabbit density <strong>for</strong> surveyed l<strong>and</strong> class <strong>in</strong> <strong>Parwan</strong> <strong>Valley</strong>L<strong>and</strong> class Area (km 2 ) Number/km 22A 67 7004B 37 4005 42 1500Table 5. Characteristics of biomass at given sitesSite Year established Dry biomass(kg/m 2 )Ground cover(%)Proportion:native grassesProportion:moss <strong>and</strong> litter1954 0.958 100 0.5 0.5Pasture (a) 1991 0.386 90 0.5 0.4No exclusion 0.098 50 0.35 0.15Ridge 1954 0.428 80 0.4 0.4No exclusion (b) 0.133 60 0.3 0.3(a)(b)Note that plant numbers are similar <strong>in</strong> <strong>the</strong> three plots.little rabbit activity was observed at this site.4. RABBIT EXCLUSION ANDHYDROLOGYPrevious sections have shown that <strong>the</strong> rabbit <strong>control</strong>strategy was successful <strong>in</strong> <strong>control</strong>l<strong>in</strong>g rabbit activity,<strong>and</strong> consequently allow<strong>in</strong>g <strong>the</strong> vegetation toregenerate. It would be valuable <strong>for</strong> managementpurposes to know if <strong>the</strong>re has been a detectablechange <strong>in</strong> run-off associated with this rabbitexclusion. The north face of <strong>the</strong> White Elephant Hillis of particular <strong>in</strong>terest, because it is <strong>the</strong>most degraded part of <strong>the</strong> l<strong>and</strong>scape. The estimationof run-off from <strong>the</strong> north face is described <strong>in</strong> section4.1. A simple water balance model is applied to <strong>the</strong>north face <strong>in</strong> section 4.2 to test <strong>for</strong> changes <strong>in</strong> run-off.F<strong>in</strong>d<strong>in</strong>gs are presented <strong>in</strong> section 4.3.4.1 Estimation of surface run-off from <strong>the</strong>north face of <strong>the</strong> White Elephant HillThe stream gauge <strong>in</strong> <strong>the</strong> ma<strong>in</strong> <strong>catchment</strong> (figure 1)measures comb<strong>in</strong>ed dra<strong>in</strong>age from <strong>the</strong> north face of<strong>the</strong> White Elephant Hill <strong>and</strong> from eroded <strong>and</strong>vegetated areas. This can be expressed as -Q mc = Q nf + Q ea + Q ls(I)
Table 6. Components of l<strong>and</strong>scape of <strong>the</strong> vegetated area on <strong>the</strong> lower slopes <strong>in</strong> 1978L<strong>and</strong>scapeRepresentativesub<strong>catchment</strong>Proportion of lowerslopes vegetated area(A)Savannah woodl<strong>and</strong> 1 0.29Native pasture north aspect 3 0.42Native pasture south aspect 6 0.29where,Q mc is run-off from ma<strong>in</strong> <strong>catchment</strong>,Q nf is run-off from <strong>the</strong> north face,Q ea is run-off from <strong>the</strong> eroded areas,Ql s is run-off from <strong>the</strong> lower slopes.Run-off from <strong>the</strong> north face <strong>and</strong> eroded areas isestimated by subtract<strong>in</strong>g <strong>the</strong> contribution due to <strong>the</strong>lower slopes from <strong>the</strong> total run-off, because <strong>the</strong>re isno stream gaug<strong>in</strong>g at <strong>the</strong> break of slope. In turn, <strong>the</strong>contribution from <strong>the</strong> lower slopes is estimated by <strong>the</strong>weighted sum of run-off from <strong>the</strong> <strong>in</strong>dividualreference sub<strong>catchment</strong>s, thus –Ql s = A 1 Q 1 + A 3 Q 3 + A 6 Q 6 (2)where Q i is run-off from sub<strong>catchment</strong> i,A i is proportion of <strong>the</strong> ma<strong>in</strong> <strong>catchment</strong> represented bysub<strong>catchment</strong> i,i = 1, 3, 6. Values of A are given <strong>in</strong> table 6.Equation (2) is evaluated to give <strong>the</strong> estimated run-offfrom <strong>the</strong> lower slopes section. This is substituted <strong>in</strong>equation (1) to give estimated run-off from <strong>the</strong> northface <strong>and</strong> eroded areas by difference. Possible changes<strong>in</strong> runoff due to rabbit exclusion can now be testedus<strong>in</strong>g a water balance model. Details are given <strong>in</strong>Section 4.2.The above derivation assumes that partition<strong>in</strong>g <strong>the</strong>l<strong>and</strong> use of <strong>the</strong> ma<strong>in</strong> <strong>catchment</strong> is valid, <strong>and</strong> thatsummation of <strong>the</strong> surface run-off (weighted <strong>for</strong> area)from <strong>the</strong> sub<strong>catchment</strong>s is a reasonableapproximation of <strong>the</strong> actual processes. Rout<strong>in</strong>g ofsurface run-off <strong>and</strong> channel absorption effectsbetween <strong>the</strong> break of slope <strong>and</strong> <strong>the</strong> gaug<strong>in</strong>g stationare considered to be small <strong>and</strong> have not been <strong>in</strong>cluded<strong>in</strong> <strong>the</strong> analysis. It is also assumed that <strong>the</strong> relationshipof <strong>the</strong> reference sub<strong>catchment</strong>s <strong>and</strong> <strong>the</strong> lower slopessection of <strong>the</strong> ma<strong>in</strong> <strong>catchment</strong> rema<strong>in</strong>s constantdur<strong>in</strong>g <strong>the</strong> course of <strong>the</strong> study. This appearsreasonable as <strong>the</strong> targeted poison<strong>in</strong>g design operatedon both sub<strong>catchment</strong>s <strong>and</strong> <strong>the</strong> ma<strong>in</strong> <strong>catchment</strong>.4.2 Water balance modelA simple water balance model has been applied to <strong>the</strong>north face of <strong>the</strong> White Elephant Hill to quantify anychange <strong>in</strong> surface run-off.The daily water balance is expressed as:P = I + ET + Q (3)where P is ra<strong>in</strong>fall (mm),I is <strong>in</strong>terception (mm),ET is evaporation/transpiration (mm),Q is streamflow (mm).For modell<strong>in</strong>g purposes, this equation has beenrearranged as:Q = P - I - ET (4)Variables on <strong>the</strong> right of equation (4) can beestimated. Interception has been estimatedempirically as <strong>the</strong> loss <strong>in</strong> ra<strong>in</strong>fall be<strong>for</strong>e run-offcommences. Daily <strong>value</strong>s applied <strong>for</strong> a given monthare shown <strong>in</strong> table 7. An empirical surrogate <strong>for</strong> <strong>the</strong>ET term has been developed, def<strong>in</strong>ed as <strong>the</strong> time <strong>in</strong>days needed to dry out <strong>the</strong> <strong>catchment</strong>. Ra<strong>in</strong>fall isdepleted daily by an amount equal to <strong>the</strong> number ofdays s<strong>in</strong>ce ra<strong>in</strong> fell multiplied by 0.64 (un<strong>its</strong>: mm).The depletion cont<strong>in</strong>ues until ei<strong>the</strong>r <strong>the</strong> day <strong>value</strong> <strong>in</strong>table 7 is reached, or ra<strong>in</strong> falls. If <strong>the</strong> day <strong>value</strong> isreached, a daily maximum of 14x0.64 = 8.96 mm issubtracted. When ra<strong>in</strong> falls, <strong>the</strong> day counter restartsfrom unity. Output from <strong>the</strong> model is predictedstreamflow (mm).
Table 7. Empirical model parametersMonth Jan Feb Mar Apr May June July Aug Sept Oct Nov DecInterception loss (mm) 6 6.2 3.5 4 3 2 2 3 4 5 8 6Time to dry <strong>the</strong><strong>catchment</strong> (days)6 6 8 10 10 12 12 10 10 8 8 6The data set consists of daily ra<strong>in</strong>fall <strong>and</strong> run-off recordsfrom January 1978 to December 1993 <strong>for</strong> <strong>the</strong> six referencesub<strong>catchment</strong>s <strong>and</strong> <strong>the</strong> ma<strong>in</strong> <strong>catchment</strong> (figure 1). Dur<strong>in</strong>g<strong>the</strong> calibration period (January 1978 to December 1980),model parameters have been estimated by successiveapproximation to m<strong>in</strong>imise differences between observed<strong>and</strong> predicted run-off. There is a period of no change fromJanuary 1981 to December 1984. Dur<strong>in</strong>g <strong>the</strong> test period(January 1985 to December 1993) parameter <strong>value</strong>s from<strong>the</strong> calibration period have been used <strong>in</strong> <strong>the</strong> model topredict run-off. For a null hypo<strong>the</strong>sis that <strong>the</strong>re is nodifference <strong>in</strong> run-off <strong>in</strong> <strong>the</strong> test period, only smalldifferences between observed <strong>and</strong> predicted run-off areexpected. Differences have been tested <strong>for</strong> statisticalsignificance. Any significant differences are due to <strong>the</strong>effects of rabbit <strong>control</strong>.4.3 ResultsThe difference between estimated run-off <strong>and</strong> <strong>the</strong> <strong>value</strong>predicted by <strong>the</strong> water balance model has been plotted fro<strong>the</strong> length of record considered <strong>in</strong> this study. This isshown <strong>in</strong> figure 5.The aim of <strong>the</strong> analysis is to identify any major changes <strong>in</strong>surface run-off associated with rabbit <strong>control</strong>. With this <strong>in</strong>m<strong>in</strong>d, <strong>the</strong> differences between estimated <strong>and</strong> predictedrun-off have been averaged at monthly <strong>in</strong>tervals over <strong>the</strong>calibration <strong>and</strong> test periods. Specifically, over <strong>the</strong>calibration period, <strong>the</strong> January 1978, 1979 <strong>and</strong> 1980differences have been summed, <strong>and</strong> <strong>the</strong> mean has beenplotted <strong>in</strong> figure 6. This procedure has been applied <strong>for</strong><strong>the</strong> rema<strong>in</strong><strong>in</strong>g months <strong>in</strong> <strong>the</strong> calibration period. Resultsare shown <strong>in</strong> figure 6.The same procedure has been used dur<strong>in</strong>g <strong>the</strong> test period(January 1985 to December 1993). Average monthlydifferences <strong>for</strong> <strong>the</strong> <strong>in</strong>terval with rabb<strong>its</strong> excluded is shown<strong>in</strong> figure 6. Total monthly decrease <strong>in</strong> surface run-off over<strong>the</strong> 9 year test period amounts to 87 mm (figure 6). Theaverage annual decrease is 87/9 ~10 mm, which isapproximately 20% of mean annual run-off. This will bediscussed fur<strong>the</strong>r <strong>in</strong> section 6.5. FINANCIAL ANALYSISThe <strong>in</strong>creased water use by <strong>the</strong> vegetation on site isreflected <strong>in</strong> <strong>in</strong>creased biomass. The objective here is toquantify this change <strong>in</strong> practical f<strong>in</strong>ancial terms. In <strong>the</strong>absence of any firm <strong>in</strong><strong>for</strong>mation, estimates have beenmade of <strong>the</strong> costs <strong>in</strong>volved <strong>and</strong> benef<strong>its</strong> received toidentify <strong>the</strong> major f<strong>in</strong>ancial factors.The analysis has aimed to normalize costs to <strong>the</strong> farmlevel, so that travel times <strong>and</strong> associated costs fromMelbourne to <strong>the</strong> <strong>Parwan</strong> area have been excluded.Similarly, <strong>the</strong> off-site costs of sediment export (<strong>for</strong>example, costs <strong>in</strong>curred <strong>in</strong> removal of silt from MeltonReservoir) have not been considered. Costs of rabb<strong>its</strong>urveys have not been <strong>in</strong>cluded.The only benefit assessed <strong>in</strong> this analysis is that due to<strong>in</strong>creased biomass us<strong>in</strong>g <strong>the</strong> data from <strong>the</strong> exclusion plots(table 5). O<strong>the</strong>r benef<strong>its</strong> which have not been quantified<strong>in</strong>clude ma<strong>in</strong>tenance of productive l<strong>and</strong> due to reducedsoil erosion an improvement <strong>in</strong> native habitat on nonagriculturalsites.5.1 CostsCosts arise <strong>in</strong> allocated time <strong>and</strong> <strong>in</strong> materials. Allocatedtime <strong>in</strong>cludes time spent by personnel <strong>in</strong> <strong>the</strong> field, i.e., <strong>for</strong>surveys, labour <strong>and</strong> supervision. Materials costs occur <strong>in</strong>purchase of fenc<strong>in</strong>g, repair of exist<strong>in</strong>g fences, transport<strong>and</strong> purchase of poisoned carrots.5.1.1 Personnel timeOne day per week is spent <strong>in</strong> <strong>the</strong> Reserve Tasks varydur<strong>in</strong>g <strong>the</strong> year. New fences were <strong>in</strong>stalled over <strong>the</strong>summer months, while repairs are a cont<strong>in</strong>ual task. It isestimated that half <strong>the</strong> work<strong>in</strong>g day is spent on rabbit<strong>control</strong> measures. Time <strong>in</strong>volved is 5 hours per day at$10.00 per hour (<strong>in</strong>clud<strong>in</strong>g on-costs) <strong>for</strong> 40 weeks peryear. Total annual cost <strong>for</strong> personnel is 5 x $10.00 x 40 =$2000.00.
Figure 6 Mean monthly differences between observed run-off <strong>and</strong> <strong>value</strong>s predictedfrom water balance modelTable 8 Costs <strong>for</strong> supply of poisoned carrotsYear 86 87 88 89 90 91 92 93 94Number of 20 kg bags 60 60 60 60 47 47 47 30 18Cost – free feed ($) 260 260 260 260 202 202 202 130 78Cost 1080 feed ($) 180 180 180 180 144 144 144 90 54Total Cost ($) 440 440 440 440 346 346 346 220 132wire, <strong>and</strong> a gate with5.1.2 Cost of poisoned carrotsCarrots were purchased at bulk feed stores <strong>in</strong>20 kg bags at prices vary<strong>in</strong>g from $2.50 to$6.00 per bag depend<strong>in</strong>g on season. Mean costwas $4.00 per bag. The number of 20 kgpurchased are given <strong>in</strong> table 8. TheDepartment charges $2.00 per 20 kg bag <strong>for</strong>1080 poison, plus $0.50 Approximate cost of a100 metre roll of rabbit-proof wire <strong>for</strong> asuitable bag to hold <strong>the</strong> poisoned carrots.There is a cutt<strong>in</strong>g fee of $2.50 per 20 kg bag.All up cost <strong>for</strong> supply of cut <strong>and</strong> poisonedcarrots is $9.00 per 20 kg bag. The cost <strong>for</strong> afree feed is purchase <strong>and</strong> cutt<strong>in</strong>g only; a totalof $6.50 per 20 kg bag. There are two freefeeds given, <strong>and</strong> <strong>the</strong>n poison.Total annual costs <strong>for</strong> supply of carrots aregiven <strong>in</strong> table 8.5.1.3 Cost of new fencesItems <strong>for</strong> new fences are wooden corner posts<strong>and</strong> supports, steel posts at 5 m <strong>in</strong>tervals,rabbit-proof wire, support wire <strong>and</strong> barbedsupport. An approximate all <strong>in</strong>clusive cost <strong>for</strong>new fences <strong>in</strong>clud<strong>in</strong>g labour is $10.00 permetre.Lengths of new fences <strong>and</strong> associated annualcosts are given <strong>in</strong> table 9.5.1.4 Cost <strong>for</strong> repair of exist<strong>in</strong>g fences kgbagsApproximate cost of a 100 metre roll ofrabbit-proof wire is $250.00 <strong>for</strong> st<strong>and</strong>ardwidth (1 m) <strong>and</strong> $80.00 <strong>for</strong> narrow width (30cm). St<strong>and</strong>ard width is used <strong>for</strong> major repairs.Narrow width is used to repair breaches closeto ground level, gaps where cows pushthrough, <strong>and</strong> to <strong>in</strong>crease fence height <strong>in</strong> lowspots. Labour <strong>in</strong>cludes pegg<strong>in</strong>g down <strong>the</strong>wire, <strong>and</strong> <strong>the</strong> cart<strong>in</strong>g of stones <strong>for</strong> use asweights. An approximate all <strong>in</strong>clusive cost <strong>for</strong>repair of These exist<strong>in</strong>g fences <strong>in</strong>clud<strong>in</strong>glabour is $3.00 per metre.Lengths of exist<strong>in</strong>g fences which wererepaired annually <strong>and</strong> associated costs are
given <strong>in</strong> table 9.$16.00/ha. Second, <strong>the</strong>re is <strong>the</strong> currentma<strong>in</strong>tenance strategy, where annual runn<strong>in</strong>gcosts are approximately $2700/300ha =$9.00/ha. The major item is <strong>the</strong> time <strong>and</strong>.ef<strong>for</strong>t made to ensure that rabb<strong>its</strong> areexcluded. costs have been stable <strong>for</strong> sevenyears; <strong>the</strong>re is a slightTable 9 Costs of fenc<strong>in</strong>gOperation 1982 1983 1984 1985 1986 1987 to 1994Repair of exist<strong>in</strong>g fenceLength (km) 2.0 1.0 0.5 0.2 0.1 0.1Cost ($) 6000 3000 1500 600 300 300New fenc<strong>in</strong>gLength (km) 0.3 0.2Cost ($) 3000 2000Table 10 Summary of costsYear Personnel Poisoned carrots Fence repairs New fences Rounded total($) ($) ($) ($) ($)82 2000 n.a. 6000 >800083 2000 n.a. 3000 >500084 2000 n.a. 1500 >350085 2000 n.a. 600 3000 >560086 2000 440 300 2000 470087 2000 440 300 270088 2000 440 300 270089 2000 440 300 270090 2000 346 300 270091 2000 346 300 270092 2000 346 300 270093 2000 220 300 250094 2000 132 300 24005.1.5 Summary of costsThe <strong>in</strong>dividual items described <strong>in</strong> <strong>the</strong> aboveparagraphs have been summarised <strong>in</strong> table 10 togive an <strong>in</strong>dication of overall costs.Prior to 1986, rabbit poison<strong>in</strong>g was done byregional Departmental staff, <strong>and</strong> <strong>in</strong>cluded aerialpoison<strong>in</strong>g. Costs were not available.Table 10 shows two dist<strong>in</strong>ct phases. First, <strong>the</strong>reis an <strong>in</strong>terval of five years with relatively highcosts due to requirements of new fences <strong>and</strong>repairs to exist<strong>in</strong>g fences. Costs <strong>in</strong> this periodare greater than $4800/300ha or $16.00/ha.Second, <strong>the</strong>re is <strong>the</strong> current ma<strong>in</strong>tenancestrategy, where annual runn<strong>in</strong>g costs areapproximately $2700/300 ha = $9.00/ha. Themajor item is <strong>the</strong> time <strong>and</strong> ef<strong>for</strong>tmade to ensure that rabb<strong>its</strong> are excluded. Thesecosts have been stable <strong>for</strong> seven years; <strong>the</strong>re is aslight decrease with time as <strong>the</strong> quantity ofcarrots required <strong>for</strong> rabbit <strong>control</strong> has decreased.5.2 Benef<strong>its</strong>Consider that rabb<strong>its</strong> are <strong>control</strong>led throughout<strong>the</strong> <strong>Parwan</strong> <strong>Valley</strong> <strong>in</strong> one year, <strong>and</strong> that <strong>the</strong>economic benefit becomes available <strong>in</strong> <strong>the</strong> sameyear. It is assumed that <strong>the</strong> <strong>in</strong>crease <strong>in</strong> biomasscorresponds to <strong>the</strong> <strong>value</strong>s <strong>in</strong> table 5, (i.e., 0.386 -0.098 - 300g/m 2 ). This has occurred over a threeyear period, so <strong>the</strong> benefit is -100g/m 2 annually.
In <strong>the</strong> absence of rabbit survey <strong>in</strong><strong>for</strong>mationwith<strong>in</strong> <strong>the</strong> experimental area (l<strong>and</strong> use class 5), itis assumed that graz<strong>in</strong>g pressure is similar to <strong>the</strong><strong>value</strong>s surveyed <strong>in</strong> <strong>the</strong> <strong>Parwan</strong> <strong>Valley</strong> <strong>in</strong> <strong>the</strong>same l<strong>and</strong> use class (i.e., 1500/1= 2 , table 4).Mean graz<strong>in</strong>g pressure on pastures on <strong>the</strong> floorof <strong>the</strong> <strong>Parwan</strong> <strong>Valley</strong> (l<strong>and</strong> use classes 2A <strong>and</strong>4B) has been estimated from table 4 as 550/km 2 .On <strong>the</strong> basis of relative graz<strong>in</strong>g pressure byrabb<strong>its</strong>, an average improvement <strong>in</strong> pasturebiomass would be expected of 550/1500 times<strong>the</strong> results observed <strong>in</strong> <strong>the</strong> exclusion plots, i.e.,37 g/m (= 370kg/ha) <strong>in</strong>crease <strong>in</strong> biomass. For anom<strong>in</strong>al weight of 25 kg <strong>for</strong> a bale of dry feedcost<strong>in</strong>g $4.00, this converts to approximately 14bales/ha of dry feed per annum, or $56.00/ha perannum. The f<strong>in</strong>ancial benefit of this additionalbiomass exceeds <strong>the</strong> total estimated costs($9.00/ha per annum, Section 5.1.5), so <strong>the</strong>method is f<strong>in</strong>ancially feasible.This ga<strong>in</strong> can also be expressed <strong>in</strong> more practicalterms. On <strong>the</strong> assumption that a we<strong>the</strong>r eatsapproximately 1 kg of dry feed per day tosurvive (D Perry, pers. comm.), <strong>its</strong> feedrequirements <strong>for</strong> a year amount to 365 kg. This isapproximately equal to <strong>the</strong> annual improvement<strong>in</strong> biomass determ<strong>in</strong>ed <strong>in</strong> <strong>the</strong> previous paragraph.There<strong>for</strong>e, <strong>the</strong> ga<strong>in</strong> <strong>in</strong> biomass due to rabbit<strong>control</strong> corresponds <strong>in</strong> general terms to animprovement <strong>in</strong> <strong>the</strong> gross marg<strong>in</strong> ofapproximately 1 DSE/ha.This is a broad <strong>in</strong>dication only as no allowancehas been made <strong>for</strong> variations <strong>in</strong> productivity ofdifferent pasture species or <strong>for</strong> vary<strong>in</strong>g siteproductivity. Preferential graz<strong>in</strong>g by rabb<strong>its</strong> hasnot been considered. Never<strong>the</strong>less, <strong>the</strong>se figuresdo <strong>in</strong>dicate <strong>the</strong> <strong>value</strong> of a thorough strategy <strong>for</strong>rabbit <strong>control</strong>. This analysis has ongo<strong>in</strong>gimplications <strong>for</strong> <strong>the</strong> local <strong>in</strong>dustries of lucernehay, dairy farm<strong>in</strong>g, beef <strong>and</strong> f<strong>in</strong>e woolproduction.6. DISCUSSION6.1 The success ofstrategy<strong>the</strong> rabbit <strong>control</strong>There was little vegetation on <strong>the</strong> WhiteElephant Hill when <strong>the</strong> experimental area wasestablished <strong>in</strong> <strong>the</strong> early 1950s. <strong>Rabbit</strong> numberswere high enough to escalate l<strong>and</strong> degradation,<strong>and</strong> <strong>the</strong>ir graz<strong>in</strong>g pressure effectively suppressedregeneration (Section 3.1). The White ElephantHill provided ideal rabbit habitat because <strong>the</strong>soils are highly erodible <strong>and</strong> <strong>the</strong> l<strong>and</strong>scape isbroken. Forbes (1948, page 29) described <strong>the</strong>study area <strong>and</strong> <strong>the</strong> upper <strong>Parwan</strong> <strong>Valley</strong> ashav<strong>in</strong>g "fantastic numbers of <strong>the</strong> verm<strong>in</strong>". <strong>Rabbit</strong>numbers surveyed at this latter site are <strong>in</strong>cluded<strong>in</strong> column 5, table 3.The st<strong>and</strong>ard poison<strong>in</strong>g plan made little impacton <strong>the</strong> source areas of rabb<strong>its</strong> where vehicleaccess was impossible. Short migration distancesfrom <strong>the</strong> deep gullies ensured that any depletion<strong>in</strong> rabbit numbers by <strong>the</strong> st<strong>and</strong>ard poison<strong>in</strong>g planwas only temporary. <strong>Rabbit</strong> migrations were alsoassisted by <strong>the</strong> lack of ma<strong>in</strong>tenance of fences.An attempt was made to keep rabbit numberslow dur<strong>in</strong>g <strong>the</strong> drought of 1982-83 by repair<strong>in</strong>g<strong>the</strong> fences <strong>in</strong> <strong>the</strong> experimental area. The resultsfrom <strong>the</strong> experimental plot (Section 3.1)<strong>in</strong>dicated that rabbit exclusion was an importantfactor <strong>in</strong> regeneration. Consequently, o<strong>the</strong>r areaswere fenced off, <strong>in</strong> particular at <strong>the</strong> western endof <strong>the</strong> White Elephant Hill (figure 2) whereerosion was severe. Fenced areas were <strong>the</strong>n<strong>in</strong>corporated <strong>in</strong>to a poison<strong>in</strong>g strategy which wastargeted at sites of rabbit activity (Section 3.3).The major advantage of this development is <strong>in</strong> <strong>its</strong>effectiveness. Results show that low applicationrates at sites of rabbit activity ma<strong>in</strong>ta<strong>in</strong> adequate<strong>control</strong> (table 2). The benef<strong>its</strong> are that <strong>the</strong>quantity of applied poison is m<strong>in</strong>imised <strong>and</strong> thatcosts are reduced.When this study was <strong>in</strong>itiated, time constra<strong>in</strong>tsdictated that free feed<strong>in</strong>g <strong>and</strong> poison<strong>in</strong>g couldonly be done at 7-day <strong>in</strong>tervals. Results haveshown that this <strong>in</strong>terval was effective; both <strong>the</strong>technique <strong>and</strong> <strong>the</strong> f<strong>in</strong>d<strong>in</strong>gs have been validated <strong>in</strong><strong>the</strong> literature. Cowan et al (1987) studiedpercentage of rabb<strong>its</strong> consum<strong>in</strong>g ba<strong>its</strong> at variousdistances from <strong>the</strong> warren. They found that 90%of rabb<strong>its</strong> consumed ba<strong>its</strong> up to 25 metres fromwarrens up to 8 days after bait<strong>in</strong>g commenced.This shows <strong>the</strong> importance of firstly apply<strong>in</strong>gba<strong>its</strong> close to warrens, <strong>and</strong> secondly of allow<strong>in</strong>gsufficient time <strong>for</strong> all rabb<strong>its</strong> to browse <strong>the</strong> ba<strong>its</strong>.Cowan et al (1987) conducted <strong>the</strong>ir study <strong>in</strong>Engl<strong>and</strong> where <strong>the</strong> climate is cooler than <strong>in</strong>Victoria <strong>and</strong> <strong>the</strong> bait is likely to stay fresh <strong>for</strong> alonger period. In this study, much of <strong>the</strong> h<strong>and</strong>poison<strong>in</strong>g was carried out <strong>in</strong> autumn <strong>and</strong> w<strong>in</strong>terwhen cooler conditions prevail.The overall result of <strong>the</strong> fences <strong>and</strong> targetedpoison<strong>in</strong>g has been that rabbit numbers with<strong>in</strong><strong>the</strong> Reserve have dropped from high <strong>value</strong>s(figure 4) to close to zero. Surveys <strong>in</strong> 1989 <strong>and</strong>1990 gave only two sight<strong>in</strong>gs over a 1.5 kmcourse. This contrasts with numbers surveyed <strong>in</strong><strong>the</strong> surround<strong>in</strong>g <strong>Parwan</strong> <strong>Valley</strong> (table 3). In <strong>the</strong>absence of any <strong>control</strong> measures, rabbit numberssimilar to those <strong>in</strong> <strong>the</strong> valley would be expected,i.e., <strong>in</strong> <strong>the</strong> range 4001500/km 2 (table 4).The ma<strong>in</strong>tenance of decl<strong>in</strong><strong>in</strong>g rabbit numbersfrom this po<strong>in</strong>t <strong>for</strong>wards can be related to <strong>the</strong>improved technique of bait feed<strong>in</strong>g at sites ofactivity with an extended period between baitruns. Poison<strong>in</strong>g complements proper fence
ma<strong>in</strong>tenance as a successful tool <strong>in</strong> rabbit<strong>control</strong>, <strong>in</strong> that <strong>the</strong> fence m<strong>in</strong>imizes <strong>the</strong>dispersion of high rabbit populations <strong>and</strong>ma<strong>in</strong>ta<strong>in</strong>s areas of low rabbit density as lessfavoured sites.6.2 The relationship of rabb<strong>its</strong> <strong>and</strong>run-off, <strong>and</strong> possible mechanismsThe broad scale damage caused by graz<strong>in</strong>grabb<strong>its</strong> <strong>and</strong> <strong>the</strong> consequences has been welldocumented <strong>in</strong> <strong>the</strong> literature (Stead, 1935;Forbes, 1948; Hexter et al. 1956; Hills, 1975;Williams et al. 1995).The native grasses of <strong>the</strong> area (Danthonia, Stipa<strong>and</strong> Poa species) have a tussock habit of growth.As a result of an extended period of high rabbitpopulations <strong>the</strong>se tussocks were closely cropped<strong>and</strong> cont<strong>in</strong>ually harvested. They resembled aseries of pads with low ground cover (30 to 40%)<strong>and</strong> low biomass(-0.1kg/m 2 , table 5).When <strong>the</strong> graz<strong>in</strong>g pressure was removed, treeseedl<strong>in</strong>gs, understorey <strong>and</strong> grasses began toregenerate. The native grasses recovered to atussock <strong>for</strong>mation with 80 to 90% cover, biomass<strong>in</strong>creased by a factor of approximately 4 times <strong>in</strong>3 to 4 years, with <strong>the</strong> prospect of fur<strong>the</strong>r longterm improvement (table 5). It appears that <strong>the</strong>reis m<strong>in</strong>imal <strong>in</strong>crease <strong>in</strong> numbers of native grasses,with <strong>the</strong> emphasis be<strong>in</strong>g <strong>in</strong> growth of exist<strong>in</strong>gplants. As <strong>the</strong> native grasses recover, <strong>in</strong>terception<strong>in</strong>creases <strong>and</strong> <strong>the</strong> microclimate under <strong>the</strong>vegetative canopy becomes less severe. Theseconditions favour growth of mosses, which isshown by an <strong>in</strong>crease <strong>in</strong> ground cover (from 0.15to 0.4, column 6, table 5). The growth of mossesreta<strong>in</strong>s surface moisture on site, <strong>and</strong>consequently <strong>in</strong>creases <strong>in</strong>filtration. The growthpattern of mosses is seasonal, as <strong>the</strong>y dry outover <strong>the</strong> summer months.T he reductions <strong>in</strong> run-off go through a cycle, withmaximum reduction <strong>in</strong> mid-w<strong>in</strong>ter <strong>and</strong> m<strong>in</strong>imumreduction over mid-summer (figure 6). In <strong>the</strong>absence of direct observation, this may be due toa comb<strong>in</strong>ation of <strong>the</strong> <strong>in</strong>crease <strong>in</strong> biomass <strong>and</strong>elevated <strong>in</strong>filtration. This would be consistentwith <strong>the</strong> f<strong>in</strong>d<strong>in</strong>gs of Dun<strong>in</strong> <strong>and</strong> Downes (1962)<strong>and</strong> Dun<strong>in</strong> (1965), when poor native pasture wasconverted to annual improved pasture. May is <strong>the</strong>time of <strong>the</strong> autumn flush of growth, whentemperatures are still elevated. In <strong>the</strong> calibrationperiod, <strong>the</strong> rabb<strong>its</strong> would have cont<strong>in</strong>uallycropped this biomass. However, <strong>the</strong> reduction <strong>in</strong>rabbit numbers has allowed <strong>the</strong> development of<strong>the</strong> understorey <strong>and</strong> a large number of acacias,which were not present <strong>in</strong> <strong>the</strong> exclusion plots.This has <strong>in</strong>creased <strong>in</strong>terception <strong>and</strong> providedshad<strong>in</strong>g <strong>and</strong> w<strong>in</strong>dbreak <strong>for</strong> <strong>the</strong> development ofground cover (table 5). Evaporation rates arereduced <strong>in</strong> <strong>the</strong> shade, <strong>and</strong> consequently surfacesoil moisture tends to be higher (Chow, 1964).These conditions rema<strong>in</strong> favourable over <strong>the</strong>w<strong>in</strong>ter months <strong>for</strong> fur<strong>the</strong>r <strong>in</strong>filtration <strong>and</strong> plantgrowth <strong>in</strong> <strong>the</strong> Spr<strong>in</strong>g. However, conditionschange dramatically over <strong>the</strong> summer months.Low summer ra<strong>in</strong>fall <strong>and</strong> high temperatures putall vegetation under soil water stress, <strong>and</strong>evaporation <strong>and</strong> transpiration are at low levels.High ra<strong>in</strong>fall <strong>in</strong>tensities still tend to compact anyareas of exposed soil surface <strong>and</strong> produce surfacerun-off.Although this explanation describes <strong>the</strong> overallf<strong>in</strong>d<strong>in</strong>gs, <strong>the</strong> details are tentative <strong>and</strong> requirefur<strong>the</strong>r study to clarify <strong>the</strong> underly<strong>in</strong>g processes.In particular, experiments on <strong>the</strong> seasonalvariation of <strong>in</strong>filtration <strong>and</strong> <strong>its</strong> relationship toground cover <strong>and</strong> ra<strong>in</strong>fall <strong>in</strong>tensity wouldprovide fur<strong>the</strong>r <strong>in</strong>sight <strong>in</strong>to best practice.As part of ongo<strong>in</strong>g work, surveys of <strong>the</strong> ma<strong>in</strong><strong>catchment</strong> have shown that <strong>the</strong> sheet erodedareas are rehabilitat<strong>in</strong>g very slowly, so that <strong>the</strong>seareas now yield <strong>the</strong> greater proportion of <strong>the</strong>observed surface run-off. There<strong>for</strong>e, <strong>the</strong> <strong>in</strong>crease<strong>in</strong> <strong>in</strong>terception <strong>and</strong> <strong>in</strong>filtration has occurred <strong>in</strong>areas with higher ground cover (pasture <strong>and</strong>/oracacias), due to exclusion of rabb<strong>its</strong>. Fur<strong>the</strong>rdecreases <strong>in</strong> run-off are expected as <strong>the</strong> sheeteroded areas rehabilitate. The possibility orfeasibility of accelerat<strong>in</strong>g this rehabilitationwarrants fur<strong>the</strong>r <strong>in</strong>vestigation.6.3 Future managementrecommendationsThe l<strong>and</strong>scape of <strong>the</strong> White Elephant Reserve istypical of <strong>the</strong> slopes of <strong>the</strong> <strong>Parwan</strong> valley. Deepgullies <strong>and</strong> sheet erosion on solodic soils occurthroughout <strong>the</strong> Reserve, <strong>in</strong> <strong>the</strong> <strong>Parwan</strong> valley, <strong>in</strong><strong>the</strong> adjacent Werribee River <strong>catchment</strong> <strong>and</strong> nearAnthony’s cutt<strong>in</strong>g. The management practiceswhich have been implemented <strong>in</strong> <strong>the</strong> Reservehave been effective <strong>in</strong> (i) reduc<strong>in</strong>g rabbitnumbers to very low levels, (ii) enabl<strong>in</strong>gregeneration of vegetation to take place <strong>and</strong> (iii)reta<strong>in</strong><strong>in</strong>g water on site <strong>and</strong> reduc<strong>in</strong>g run-off. Asmore areas have been fenced out <strong>and</strong> poisoned,rehabilitation of eroded areas has beencommenced, mostly by extensive tree plant<strong>in</strong>gwith straw mulch to reta<strong>in</strong> moisture.In pr<strong>in</strong>ciple, it should be straight<strong>for</strong>ward toextend <strong>the</strong>se management practices to <strong>the</strong>broader scale. <strong>Rabbit</strong> haven is made unattractive<strong>in</strong> two ways, by fences selected areas <strong>and</strong> bypoison<strong>in</strong>g sites of rabbit activity. The method isf<strong>in</strong>ancially feasible <strong>for</strong> <strong>the</strong> 300 ha reserve. Themajor costs are <strong>in</strong> <strong>the</strong> <strong>in</strong>itial purchase of fencesto exclude rabb<strong>its</strong>, <strong>and</strong> <strong>in</strong> ongo<strong>in</strong>g ma<strong>in</strong>tenance:<strong>the</strong> benef<strong>its</strong> are <strong>in</strong> greatly <strong>in</strong>creased biomass,reduced run-off <strong>and</strong> higher productivity from <strong>the</strong>selected area. These are important considerations
<strong>for</strong> efficient management of low ra<strong>in</strong> fall areas.In <strong>the</strong>se situations, it is advisable to treat water asa resource which should be reta<strong>in</strong>ed on site <strong>for</strong>use at critical times. Suggested measures toreta<strong>in</strong> moisture <strong>in</strong>clude mulch<strong>in</strong>g, grow<strong>in</strong>gspecies which provide litter <strong>and</strong> by provid<strong>in</strong>g <strong>the</strong>environment to facilitate distribution of moisturethrough <strong>the</strong> soil profile.The current practice of rabbit <strong>control</strong> haslimitations because lay<strong>in</strong>g a poison trail does notaddress <strong>the</strong> source areas of re<strong>in</strong>festation. Largekills are made <strong>in</strong> <strong>the</strong> vic<strong>in</strong>ity of <strong>the</strong> trail, butrabb<strong>its</strong> breed <strong>in</strong> unthreatened areas <strong>and</strong> <strong>the</strong>ndisperse back <strong>in</strong>to <strong>the</strong> farml<strong>and</strong>s. A cont<strong>in</strong>ualcycle of depopulation <strong>and</strong> repopulation is almostguaranteed.An alternative practice is to firstly appraise <strong>the</strong>l<strong>and</strong> <strong>and</strong> appreciate that different l<strong>and</strong> classesrequire different <strong>in</strong>tensities of l<strong>and</strong> management.The eroded slopes of <strong>the</strong> White Elephant Hillneed fences to separate <strong>the</strong>m from <strong>the</strong> flatterpastured areas. The preferred poison<strong>in</strong>g scheduleis to poison at sites of rabbit activity with lowapplication rates, <strong>and</strong> to allow sufficient time <strong>for</strong>ba<strong>its</strong> to be accepted.7. CONCLUSIONSThis study has shown that <strong>the</strong> policy ofconstruct<strong>in</strong>g fences around rocky or eroded hills<strong>and</strong> leav<strong>in</strong>g <strong>the</strong>se areas to <strong>the</strong> rabb<strong>its</strong> is noteffective <strong>in</strong> m<strong>in</strong>imis<strong>in</strong>g rabbit numbers, because<strong>the</strong>se areas serve as sources of re<strong>in</strong>festation. Aneffective method of rabbit <strong>control</strong> is to fence out<strong>the</strong> hillslopes from <strong>the</strong> paddocks, <strong>and</strong> ifnecessary, to even fence out critical areas onhillslopes. All areas are <strong>the</strong>n carefully poisonedwith attention be<strong>in</strong>g given to sites of rabbitactivity. It is important to give rabb<strong>its</strong> sufficienttime to take <strong>the</strong> poisoned ba<strong>its</strong>. This studyconfirms f<strong>in</strong>d<strong>in</strong>gs that seven days should beallowed <strong>for</strong> high levels of bait acceptance. <strong>Rabbit</strong>numbers can be kept low only by cont<strong>in</strong>uedfence ma<strong>in</strong>tenance <strong>and</strong> poison<strong>in</strong>g where breachesoccur, so that rabb<strong>its</strong> are prevented fromrecoloniz<strong>in</strong>g a site.In fact, this study has given rise to <strong>the</strong> <strong>in</strong>terest<strong>in</strong>gsituation where low rabbit numbers have beenma<strong>in</strong>ta<strong>in</strong>ed <strong>for</strong> approximately 10 yearsthroughout an area of some 300 ha, <strong>and</strong> this issurrounded by an extensive area of farml<strong>and</strong>where rabb<strong>its</strong> are numerous.The benef<strong>its</strong> of this method of rabbit <strong>control</strong>have lead to a decrease <strong>in</strong> run-off <strong>and</strong> an <strong>in</strong>crease<strong>in</strong> pasture production. The <strong>in</strong>creased pastureproduction corresponds to an approximateimprovement of 1 DSE/ha <strong>in</strong> <strong>the</strong> gross marg<strong>in</strong>.Management to decrease surface run-off is apositive step <strong>in</strong> erosion <strong>control</strong> <strong>and</strong> has specialsignificance <strong>in</strong> low ra<strong>in</strong>fall areas.Simultaneously, <strong>the</strong>se practices <strong>in</strong>crease<strong>in</strong>terception <strong>and</strong> <strong>in</strong>filtration, <strong>and</strong> maximize wateruse on site. This <strong>in</strong>volves <strong>the</strong> completevegetative layer, <strong>in</strong>clud<strong>in</strong>g trees, shrubs, grasses,ground litter, macropores <strong>and</strong> soilmicroorganisms.This study was <strong>in</strong>itiated dur<strong>in</strong>g a drought, whenrabbit numbers were low. Psychologically, this isa stronger start<strong>in</strong>g po<strong>in</strong>t than when rabb<strong>its</strong> are <strong>in</strong>plague proportions. The challenge now is toundertake this strategy at o<strong>the</strong>r sites where rabbitnumbers are high <strong>and</strong> deep gullies <strong>and</strong> sheeterosion occur on solodic soils.The results of this study have clear relevance tol<strong>and</strong> of similar nature, e.g., <strong>the</strong> <strong>Parwan</strong> valley,<strong>the</strong> Werribee River <strong>catchment</strong>, <strong>the</strong> Pentl<strong>and</strong> Hillsarea <strong>and</strong> near Anthony’s cutt<strong>in</strong>g. However, <strong>the</strong>basic pr<strong>in</strong>ciple of exclusion fences where <strong>the</strong>re isready re<strong>in</strong>festation to replace poisonedpopulations holds <strong>in</strong> all parts of Victoria, while<strong>the</strong> relationship between streamflow, plantgrowth <strong>and</strong> rabbit <strong>control</strong> should hold <strong>for</strong> at leastall dry (up to 800 mm annual ra<strong>in</strong>fall)environments where <strong>the</strong>re is significant surfacerun-off.8. ACKNOWLEDGEMENTSFenc<strong>in</strong>g repairs, upgrad<strong>in</strong>g <strong>and</strong> ma<strong>in</strong>tenancefrom 1990 to 1993 were funded by <strong>the</strong> NationalSoil Conservation Program. Devan McPhan was<strong>in</strong>volved <strong>in</strong> <strong>the</strong> Departmental rabbit poison<strong>in</strong>gplan <strong>and</strong> contributed enthusiasm <strong>for</strong> <strong>the</strong> study<strong>and</strong> <strong>in</strong><strong>for</strong>mation on rabbit numbers. CraigClifton, David Cumm<strong>in</strong>gs <strong>and</strong> Les Russellprovided valuable comments on drafts of thisreport.9. REFERENCESAtzert, S.P., 1981. A Review of SodiumMonoflouroacetate (Compound 1080), <strong>its</strong> Properties,Toxicology <strong>and</strong> Use <strong>in</strong> Predator <strong>and</strong> Rodent Control.U.S. Fish <strong>and</strong> Wildlife Service Special ScientificReport - Wildlife No. 146.Chow, V.T., 1964. H<strong>and</strong>book of Applied Hydrology.McGraw-Hill Book Company. New York.Cowan, D.P., Vaughan, J.A. <strong>and</strong> Christer, W.G., 1987.Bait consumption by <strong>the</strong> European rabbit <strong>in</strong> sou<strong>the</strong>rnEngl<strong>and</strong>. Journal of Wildlife Management 51, 386-92.Dun<strong>in</strong>, F.X., <strong>and</strong> Downes, R.G., 1962. The effect ofSubterranean Clover <strong>and</strong> Wimmera Ryegrass <strong>in</strong><strong>control</strong>l<strong>in</strong>g surface run-off from four-acre <strong>catchment</strong>snear Bacchus Marsh, Victoria. Jour. Exp. Agr. <strong>and</strong>Anim. Husb. 2(6), 148-152.
Dun<strong>in</strong>, F.X., 1965. The effect of vegetative changes onparameters <strong>for</strong> estimat<strong>in</strong>g run-off near Bacchus Marsh,Victoria. Civil Eng. Trans. Inst. Eng. Aust., 7, 16-22.Forbes, LG., 1948. Erosion <strong>in</strong> <strong>the</strong> Melton ReservoirCatchment. State Rivers <strong>and</strong> Water SupplyCommission., Victoria.Hexter, G.W., Leslie, T.I. <strong>and</strong> Pels, S., 1956. A L<strong>and</strong>Use Survey of <strong>the</strong> <strong>Parwan</strong> <strong>Valley</strong>, Victoria. SoilConservation Authority, Victoria.Hills, E.S., 1975.Physiography of Victoria: an<strong>in</strong>troduction to geomorphology. Whitcombe & TombsPty. Ltd., Australia. 5th edition.Stead, D.G., 1935. The rabbit <strong>in</strong> Australia. W<strong>in</strong>n <strong>and</strong>Co. Sydney.Williams, K. , Parer, I., Coman, B., Burley, J <strong>and</strong>Braysher, M, 1995. Manag<strong>in</strong>g Vertebrate Pests:<strong>Rabbit</strong>s. Australian Government Publish<strong>in</strong>g Service.Canberra.Wu, A.Y.K., 1980. <strong>Parwan</strong> Hydrological ExperimentalArea. Soil Conservation Authority, Victoria.Wu, A.Y.K., Hartl<strong>and</strong>, R. <strong>and</strong> Papworth, M. P., 1986.<strong>Parwan</strong> Hydrological Experimental Area. L<strong>and</strong>Protection Division. Department of Conservation,Forests <strong>and</strong> L<strong>and</strong>s, Victoria.