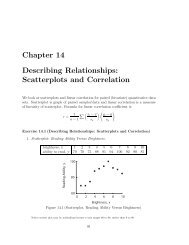
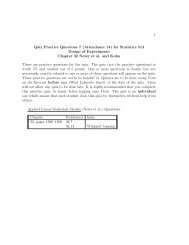
<strong>Practice</strong> <strong>Quiz</strong> <strong>Questions</strong> 4 (<strong>Attendance</strong> 6), 9-2, pp 499–506 2(9-2) Small run chart or standardized DNOM: qz4-9-2-part-DNOMX chartFrom SAS, the standardized DNOM ¯x chart <strong>for</strong> the three parts is out ofstatistical control <strong>for</strong> ?R chartThe standardized DNOM R chart <strong>for</strong> the three parts is(choose one) in / out of statistical control.
<strong>Practice</strong> <strong>Quiz</strong> <strong>Questions</strong> 4 (<strong>Attendance</strong> 6), 9-6, pp 499–506 3(9-6) Multiple stream process: qz4-9-6-heads-groupOriginal dataFrom SAS, the ¯x chart <strong>for</strong> the maximum of the four heads is out of statisticalcontrol, although it is not possible to tell from the charts whether any particularhead is out of statistical control. That all heads, together, seem out of control,is confirmed by looking carefully at the data itself.Also, the both ¯x chart and corresponding listed data <strong>for</strong> the minimumof the four heads is out of statistical control, although, again, it does not seemto be the case that any particular head is out of statistical control.The R chart, on the other hand, appears to be in statistical control.New dataFrom SAS, it appears the new data is, if anything, more out of statisticalcontrol than the original data. In particular, the ¯x chart <strong>for</strong> the maximum ofthe four heads looks further out of statistical control (above UCL) than be<strong>for</strong>e.Looking carefully at the data itself, it looks like head ?, in particular, is themain cause of being out of statistical control.The R chart now appears to be out of statistical control because all ofthe data falls above the centerline.