1 Quiz Practice Questions 4 (Attendance 8) for Statistics 513 ...
1 Quiz Practice Questions 4 (Attendance 8) for Statistics 513 ...
1 Quiz Practice Questions 4 (Attendance 8) for Statistics 513 ...

You also want an ePaper? Increase the reach of your titles
YUMPU automatically turns print PDFs into web optimized ePapers that Google loves.
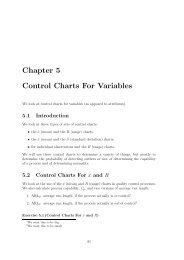
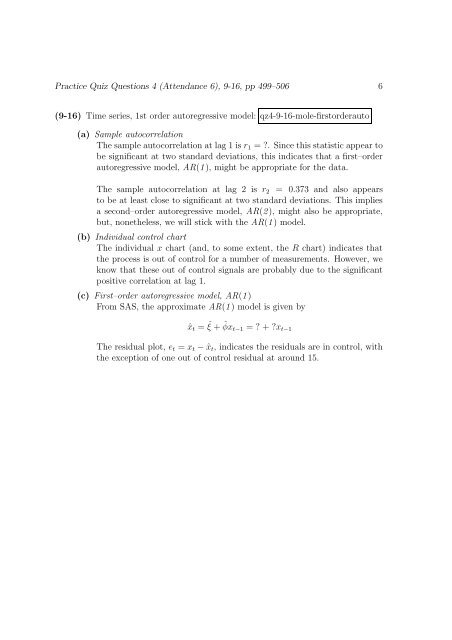
<strong>Practice</strong> <strong>Quiz</strong> <strong>Questions</strong> 4 (<strong>Attendance</strong> 6), 9-16, pp 499–506 6(9-16) Time series, 1st order autoregressive model: qz4-9-16-mole-firstorderauto(a) Sample autocorrelationThe sample autocorrelation at lag 1 is r 1 = ?. Since this statistic appear tobe significant at two standard deviations, this indicates that a first–orderautoregressive model, AR(1 ), might be appropriate <strong>for</strong> the data.The sample autocorrelation at lag 2 is r 2 = 0.373 and also appearsto be at least close to significant at two standard deviations. This impliesa second–order autoregressive model, AR(2 ), might also be appropriate,but, nonetheless, we will stick with the AR(1 ) model.(b) Individual control chartThe individual x chart (and, to some extent, the R chart) indicates thatthe process is out of control <strong>for</strong> a number of measurements. However, weknow that these out of control signals are probably due to the significantpositive correlation at lag 1.(c) First–order autoregressive model, AR(1 )From SAS, the approximate AR(1 ) model is given byˆx t = ˆξ + ˆφx t−1 = ? + ?x t−1The residual plot, e t = x t − ˆx t , indicates the residuals are in control, withthe exception of one out of control residual at around 15.