Validation of PON1 enzyme activity assays for longitudinal studies
Validation of PON1 enzyme activity assays for longitudinal studies
Validation of PON1 enzyme activity assays for longitudinal studies

Create successful ePaper yourself
Turn your PDF publications into a flip-book with our unique Google optimized e-Paper software.
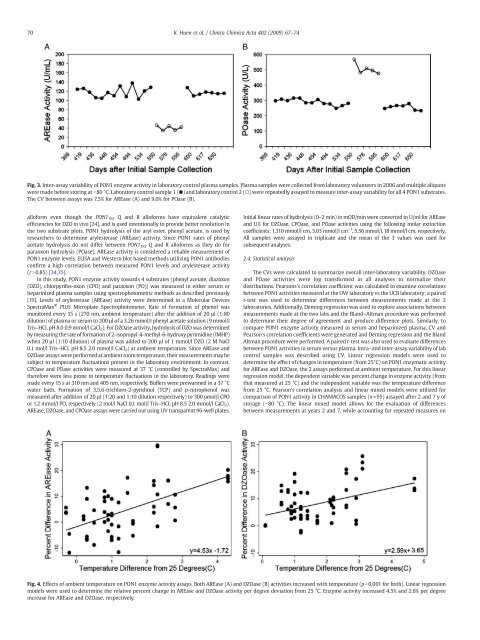
70 K. Huen et al. / Clinica Chimica Acta 402 (2009) 67–74Fig. 3. Inter-assay variability <strong>of</strong> <strong>PON1</strong> <strong>enzyme</strong> <strong>activity</strong> in laboratory control plasma samples. Plasma samples were collected from laboratory volunteers in 2006 and multiple aliquotswere made be<strong>for</strong>e storing at −80 °C. Laboratory control sample 1 (●) and laboratory control 2 (○) were repeatedly assayed to measure inter-assay variability <strong>for</strong> all 4 <strong>PON1</strong> substrates.The CV between <strong>assays</strong> was 7.5% <strong>for</strong> AREase (A) and 9.0% <strong>for</strong> POase (B).all<strong>of</strong>orm even though the <strong>PON1</strong> 192 Q and R all<strong>of</strong>orms have equivalent catalyticefficiencies <strong>for</strong> DZO in vivo [24], and is used intentionally to provide better resolution inthe two substrate plots. <strong>PON1</strong> hydrolysis <strong>of</strong> the aryl ester, phenyl acetate, is used byresearchers to determine arylesterase (AREase) <strong>activity</strong>. Since <strong>PON1</strong> rates <strong>of</strong> phenylacetate hydrolysis do not differ between <strong>PON1</strong> 192 Q and R all<strong>of</strong>orms as they do <strong>for</strong>paraoxon hydrolysis (POase), AREase <strong>activity</strong> is considered a reliable measurement <strong>of</strong><strong>PON1</strong> <strong>enzyme</strong> levels. ELISA and Western blot based methods utilizing <strong>PON1</strong> antibodiesconfirm a high correlation between measured <strong>PON1</strong> levels and arylesterase <strong>activity</strong>(rN0.85) [34,35].In this study, <strong>PON1</strong> <strong>enzyme</strong> <strong>activity</strong> towards 4 substrates (phenyl acetate, diazoxon(DZO), chlorpyrifos-oxon (CPO) and paraoxon (PO)) was measured in either serum orheparinized plasma samples using spectrophotometric methods as described previously[19]. Levels <strong>of</strong> arylesterase (AREase) <strong>activity</strong> were determined in a Molecular DevicesSpectraMax ® PLUS Microplate Spectrophotometer. Rate <strong>of</strong> <strong>for</strong>mation <strong>of</strong> phenol wasmonitored every 15 s (270 nm, ambient temperature) after the addition <strong>of</strong> 20 µl (1:80dilution) <strong>of</strong> plasma or serum to 200 µl <strong>of</strong> a 3.26 mmol/l phenyl acetate solution (9 mmol/lTris–HCL pH 8.0 0.9 mmol/l CaCl 2 ). For DZOase <strong>activity</strong>, hydrolysis <strong>of</strong> DZO was determinedby measuring the rate <strong>of</strong> <strong>for</strong>mation <strong>of</strong> 2-isopropyl-4-methyl-6-hydroxy pyrimidine (IMHP)when 20 µl (1:10 dilution) <strong>of</strong> plasma was added to 200 µl <strong>of</strong> 1 mmol/l DZO (2 M NaCl0.1 mol/l Tris–HCL pH 8.5 2.0 mmol/l CaCl 2 ) at ambient temperature. Since AREase andDZOase <strong>assays</strong> were per<strong>for</strong>med at ambient room temperature, their measurements may besubject to temperature fluctuations present in the laboratory environment. In contrast,CPOase and POase activities were measured at 37 °C (controlled by SpectraMax) andthere<strong>for</strong>e were less prone to temperature fluctuations in the laboratory. Readings weremade every 15 s at 310 nm and 405 nm, respectively. Buffers were prewarmed in a 37 °Cwater bath. Formation <strong>of</strong> 3,5,6-trichloro-2-pyridinol (TCP) and p-nitrophenol wasmeasured after addition <strong>of</strong> 20 µl (1:20 and 1:10 dilution respectively) to 300 μmol/l CPOor 1.2 mmol/l PO, respectively (2 mol/l NaCl 0.1 mol/l Tris–HCL pH 8.5 2.0 mmol/l CaCl 2 ).AREase, DZOase, and CPOase <strong>assays</strong> were carried out using UV transparent 96-well plates.Initial linear rates <strong>of</strong> hydrolysis (0–2 min) in mOD/min were converted to U/ml <strong>for</strong> AREaseand U/l <strong>for</strong> DZOase, CPOase, and POase activities using the following molar extinctioncoefficients: 1.310 mmol/l cm, 3.03 mmol/l cm −1 , 5.56 mmol/l, 18 mmol/l cm, respectively.All samples were assayed in triplicate and the mean <strong>of</strong> the 3 values was used <strong>for</strong>subsequent analyses.2.4. Statistical analysisThe CVs were calculated to summarize overall inter-laboratory variability. DZOaseand POase activities were log trans<strong>for</strong>med in all analyses to normalize theirdistributions. Pearsons's correlation coefficient was calculated to examine correlationsbetween <strong>PON1</strong> activities measured at the UW laboratory vs the UCB laboratory; a pairedt-test was used to determine differences between measurements made at the 2laboratories. Additionally, Deming regression was used to explore associations betweenmeasurements made at the two labs and the Bland–Altman procedure was per<strong>for</strong>medto determine their degree <strong>of</strong> agreement and produce difference plots. Similarly, tocompare <strong>PON1</strong> <strong>enzyme</strong> <strong>activity</strong> measured in serum and heparinized plasma, CV andPearson's correlation coefficients were generated and Deming regression and the BlandAltman procedure were per<strong>for</strong>med. A paired t-test was also used to evaluate differencesbetween <strong>PON1</strong> activities in serum versus plasma. Intra- and inter-assay variability <strong>of</strong> labcontrol samples was described using CV. Linear regression models were used todetermine the effect <strong>of</strong> changes in temperature (from 25°C) on <strong>PON1</strong> enzymatic <strong>activity</strong><strong>for</strong> AREase and DZOase, the 2 <strong>assays</strong> per<strong>for</strong>med at ambient temperature. For this linearregression model, the dependent variable was percent change in <strong>enzyme</strong> <strong>activity</strong> (fromthat measured at 25 °C) and the independent variable was the temperature differencefrom 25 °C. Pearson's correlation analysis and linear mixed models were utilized <strong>for</strong>comparison <strong>of</strong> <strong>PON1</strong> <strong>activity</strong> in CHAMACOS samples (n=95) assayed after 2 and 7 y <strong>of</strong>storage (−80 °C). The linear mixed model allows <strong>for</strong> the evaluation <strong>of</strong> differencesbetween measurements at years 2 and 7, while accounting <strong>for</strong> repeated measures onFig. 4. Effects <strong>of</strong> ambient temperature on <strong>PON1</strong> <strong>enzyme</strong> <strong>activity</strong> <strong>assays</strong>. Both AREase (A) and DZOase (B) activities increased with temperature (pb0.001 <strong>for</strong> both). Linear regressionmodels were used to determine the relative percent change in AREase and DZOase <strong>activity</strong> per degree deviation from 25 °C. Enzyme <strong>activity</strong> increased 4.5% and 2.6% per degreeincrease <strong>for</strong> AREase and DZOase, respectively.