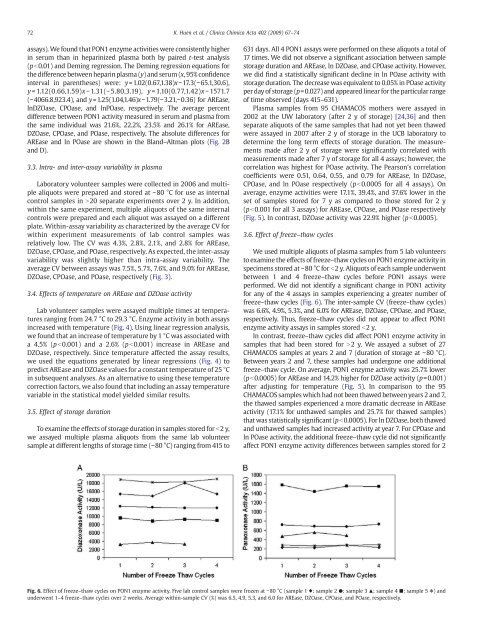
72 K. Huen et al. / Clinica Chimica Acta 402 (2009) 67–74<strong>assays</strong>). We found that <strong>PON1</strong> <strong>enzyme</strong> activities were consistently higherin serum than in heparinized plasma both by paired t-test analysis(pb0.01) and Deming regression. The Deming regression equations <strong>for</strong>the difference between heparin plasma (y)andserum(x, 95% confidenceinterval in parentheses) were: y=1.02(0.67,1.38)x−17.3(−65.1,30.6),y =1.12(0.66,1.59)x − 1.31(− 5.80,3.19), y =1.10(0.77,1.42)x − 1571.7(−4066.8,923.4), and y=1.25(1.04,1.46)x−1.79(−3.21,−0.36) <strong>for</strong> AREase,lnDZOase, CPOase, and lnPOase, respectively. The average percentdifference between <strong>PON1</strong> <strong>activity</strong> measured in serum and plasma fromthe same individual was 21.6%, 22.2%, 23.5% and 26.1% <strong>for</strong> AREase,DZOase, CPOase, and POase, respectively. The absolute differences <strong>for</strong>AREase and ln POase are shown in the Bland–Altman plots (Fig. 2Band D).3.3. Intra- and inter-assay variability in plasmaLaboratory volunteer samples were collected in 2006 and multiplealiquots were prepared and stored at −80 °C <strong>for</strong> use as internalcontrol samples in N20 separate experiments over 2 y. In addition,within the same experiment, multiple aliquots <strong>of</strong> the same internalcontrols were prepared and each aliquot was assayed on a differentplate. Within-assay variability as characterized by the average CV <strong>for</strong>within experiment measurements <strong>of</strong> lab control samples wasrelatively low. The CV was 4.3%, 2.8%, 2.1%, and 2.8% <strong>for</strong> AREase,DZOase, CPOase, and POase, respectively. As expected, the inter-assayvariability was slightly higher than intra-assay variability. Theaverage CV between <strong>assays</strong> was 7.5%, 5.7%, 7.6%, and 9.0% <strong>for</strong> AREase,DZOase, CPOase, and POase, respectively (Fig. 3).3.4. Effects <strong>of</strong> temperature on AREase and DZOase <strong>activity</strong>Lab volunteer samples were assayed multiple times at temperaturesranging from 24.7 °C to 29.3 °C. Enzyme <strong>activity</strong> in both <strong>assays</strong>increased with temperature (Fig. 4). Using linear regression analysis,we found that an increase <strong>of</strong> temperature by 1 °C was associated witha 4.5% (p b0.001) and a 2.6% (p b0.001) increase in AREase andDZOase, respectively. Since temperature affected the assay results,we used the equations generated by linear regressions (Fig. 4) topredict AREase and DZOase values <strong>for</strong> a constant temperature <strong>of</strong> 25 °Cin subsequent analyses. As an alternative to using these temperaturecorrection factors, we also found that including an assay temperaturevariable in the statistical model yielded similar results.3.5. Effect <strong>of</strong> storage durationTo examine the effects <strong>of</strong> storage duration in samples stored <strong>for</strong> b2y,we assayed multiple plasma aliquots from the same lab volunteersample at different lengths <strong>of</strong> storage time (−80 °C) ranging from 415 to631 days. All 4 <strong>PON1</strong> <strong>assays</strong> were per<strong>for</strong>med on these aliquots a total <strong>of</strong>17 times. We did not observe a significant association between samplestorage duration and AREase, ln DZOase, and CPOase <strong>activity</strong>. However,we did find a statistically significant decline in ln POase <strong>activity</strong> withstorage duration. The decrease was equivalent to 0.05% in POase <strong>activity</strong>per day <strong>of</strong> storage (p=0.027) and appeared linear <strong>for</strong> the particular range<strong>of</strong> time observed (days 415–631).Plasma samples from 95 CHAMACOS mothers were assayed in2002 at the UW laboratory (after 2 y <strong>of</strong> storage) [24,36] and thenseparate aliquots <strong>of</strong> the same samples that had not yet been thawedwere assayed in 2007 after 2 y <strong>of</strong> storage in the UCB laboratory todetermine the long term effects <strong>of</strong> storage duration. The measurementsmade after 2 y <strong>of</strong> storage were significantly correlated withmeasurements made after 7 y <strong>of</strong> storage <strong>for</strong> all 4 <strong>assays</strong>; however, thecorrelation was highest <strong>for</strong> POase <strong>activity</strong>. The Pearson's correlationcoefficients were 0.51, 0.64, 0.55, and 0.79 <strong>for</strong> AREase, ln DZOase,CPOase, and ln POase respectively (pb0.0005 <strong>for</strong> all 4 <strong>assays</strong>). Onaverage, <strong>enzyme</strong> activities were 17.1%, 39.4%, and 37.6% lower in theset <strong>of</strong> samples stored <strong>for</strong> 7 y as compared to those stored <strong>for</strong> 2 y(pb0.001 <strong>for</strong> all 3 <strong>assays</strong>) <strong>for</strong> AREase, CPOase, and POase respectively(Fig. 5). In contrast, DZOase <strong>activity</strong> was 22.9% higher (pb0.0005).3.6. Effect <strong>of</strong> freeze–thaw cyclesWe used multiple aliquots <strong>of</strong> plasma samples from 5 lab volunteersto examine the effects <strong>of</strong> freeze–thaw cycles on <strong>PON1</strong> <strong>enzyme</strong> <strong>activity</strong> inspecimens stored at −80 °C <strong>for</strong> b2y.Aliquots<strong>of</strong>eachsampleunderwentbetween 1 and 4 freeze–thaw cycles be<strong>for</strong>e <strong>PON1</strong> <strong>assays</strong> wereper<strong>for</strong>med. We did not identify a significant change in <strong>PON1</strong> <strong>activity</strong><strong>for</strong> any <strong>of</strong> the 4 <strong>assays</strong> in samples experiencing a greater number <strong>of</strong>freeze–thaw cycles (Fig. 6). The inter-sample CV (freeze–thaw cycles)was 6.6%, 4.9%, 5.3%, and 6.0% <strong>for</strong> AREase, DZOase, CPOase, and POase,respectively. Thus, freeze–thaw cycles did not appear to affect <strong>PON1</strong><strong>enzyme</strong> <strong>activity</strong> <strong>assays</strong> in samples stored b2 y.In contrast, freeze–thaw cycles did affect <strong>PON1</strong> <strong>enzyme</strong> <strong>activity</strong> insamples that had been stored <strong>for</strong> N2 y. We assayed a subset <strong>of</strong> 27CHAMACOS samples at years 2 and 7 (duration <strong>of</strong> storage at −80 °C).Between years 2 and 7, these samples had undergone one additionalfreeze–thaw cycle. On average, <strong>PON1</strong> <strong>enzyme</strong> <strong>activity</strong> was 25.7% lower(pb0.0005) <strong>for</strong> AREase and 14.2% higher <strong>for</strong> DZOase <strong>activity</strong> (p=0.001)after adjusting <strong>for</strong> temperature (Fig. 5). In comparison to the 95CHAMACOS samples which had not been thawed between years 2 and 7,the thawed samples experienced a more dramatic decrease in AREase<strong>activity</strong> (17.1% <strong>for</strong> unthawed samples and 25.7% <strong>for</strong> thawed samples)that was statistically significant (pb0.0005). For ln DZOase, both thawedand unthawed samples had increased <strong>activity</strong> at year 7. For CPOase andln POase <strong>activity</strong>, the additional freeze–thaw cycle did not significantlyaffect <strong>PON1</strong> <strong>enzyme</strong> <strong>activity</strong> differences between samples stored <strong>for</strong> 2Fig. 6. Effect <strong>of</strong> freeze–thaw cycles on <strong>PON1</strong> <strong>enzyme</strong> <strong>activity</strong>. Five lab control samples were frozen at −80 °C (sample 1 ♦; sample 2 ●; sample 3 ▲; sample 4 ■; sample 5 ✱) andunderwent 1–4 freeze–thaw cycles over 2 weeks. Average within-sample CV (%) was 6.5, 4.9, 5.3, and 6.0 <strong>for</strong> AREase, DZOase, CPOase, and POase, respectively.
K. Huen et al. / Clinica Chimica Acta 402 (2009) 67–7473and 7 y(p=0.39 and p=0.87, respectively) and the decrease in <strong>activity</strong>was comparable to unthawed samples (36.2% and 33.5%, respectively).4. DiscussionIn this study, we sought to characterize sources <strong>of</strong> technicalvariability <strong>for</strong> <strong>PON1</strong> substrate-specific <strong>enzyme</strong> <strong>activity</strong> <strong>assays</strong>. Wefocused particularly on <strong>longitudinal</strong> <strong>studies</strong>, which can generatethousands <strong>of</strong> banked samples that are <strong>of</strong>ten analyzed after differentperiods <strong>of</strong> time have elapsed. We observed differences in measurable<strong>PON1</strong> <strong>enzyme</strong> <strong>activity</strong> due to several sources: (1) use <strong>of</strong> heparinizedplasma versus serum, (2) assay temperature, (3) duration <strong>of</strong> storage, and(4) freeze–thaw cycles; <strong>of</strong> these sources, duration <strong>of</strong> storage had thegreatest impact on <strong>PON1</strong> <strong>activity</strong>, particularly in samples stored <strong>for</strong> morethan two years. We found relatively low intra- and inter- assay CVs(b10%) <strong>for</strong> control samples; intra- and inter-assay CV <strong>for</strong> POase werecomparable to those previously reported in serum (3.5% and 2.7%,respectively) [22]. Additionally, we observed low inter-laboratoryvariability <strong>for</strong> samples run in parallel using identical reagents, s<strong>of</strong>tware,and protocols at UCB and UW. These results establish good reproducibility<strong>of</strong> the <strong>PON1</strong> enzymatic <strong>assays</strong> and support their suitability <strong>for</strong> usein epidemiologic <strong>studies</strong>. However, these sources <strong>of</strong> technical variabilityshould be carefully considered in study design, subsequent statisticalanalysis, and interpretation <strong>of</strong> findings.While a previous study <strong>of</strong> storage time on serum stored at −20 °Creported no significant change in AREase <strong>activity</strong> over the course <strong>of</strong>6months[28], we observed lower <strong>activity</strong> in all <strong>assays</strong> except DZOase insamples stored <strong>for</strong> 7 y at −80 °C. Similar results were reported in one study,which described a gradual decrease in serum POase <strong>activity</strong> in samplesstored up to 4 y at −20 °C [29] and in another which found that AREase,DZOase, and POase <strong>activity</strong> in plasma samples stored up to 6 y at −20 °Cdecreased over time [37]. In <strong>longitudinal</strong> <strong>studies</strong>, it will be important toconsider the effects <strong>of</strong> storage duration on <strong>PON1</strong> <strong>activity</strong>, especially whencomparing measurements from samples stored <strong>for</strong> varying lengths <strong>of</strong>time. Stenzel et al. [37] calculated a half-life <strong>of</strong> 9.5 y <strong>for</strong> POase <strong>activity</strong>stored at −20 °C by fitting an exponential function to their data; thus it maybe possible to adjust <strong>for</strong> storage duration in <strong>longitudinal</strong> <strong>studies</strong> by fitting asimilar model.Our analysis <strong>of</strong> long term storage duration compared <strong>PON1</strong> <strong>enzyme</strong><strong>activity</strong> measurements made in the UW laboratory to measurementsmade on the same samples 5 y later at the UCB laboratory. We mustacknowledge that storage duration could not be isolated as the onlysource <strong>of</strong> variation since factors that may have differed between the 2laboratories (i.e., possible changes over time with respect to reagents,equipment, or procedures) may have also affected <strong>PON1</strong> measurements.However, our inter-laboratory exercise established good comparabilitybetween the two laboratories <strong>for</strong> concurrent experiments (using thesame protocols and reagents).We did not observe any effect <strong>of</strong> multiple freeze–thaw cycles (up to4) on <strong>PON1</strong> <strong>enzyme</strong> <strong>activity</strong> in the UCB volunteer samples (storageduration up to 2 y). However, in samples stored up to 7 y (−80 °C),freeze–thaw cycles resulted in decreased AREase and slightly increasedDZOase <strong>activity</strong>. Similar to storage duration, multiple freeze–thaw cyclesdo not seem to impact <strong>PON1</strong> <strong>enzyme</strong> <strong>activity</strong> as dramatically in one totwo year old samples as compared to 7 y old samples. It is also importantto note that the impact <strong>of</strong> freeze–thaw cycles was not consistent <strong>for</strong> all 4substrate-specific <strong>assays</strong>, but mostly affected decreased AREase <strong>activity</strong>.One possible explanation is that unlike the 3 other substrate-specific<strong>PON1</strong> <strong>assays</strong>, AREase assay uses an aryl ester substrate (phenyl acetate)rather than a phosphotriester (DZO, CPO, and PO). A site-directedmutagenesis study <strong>of</strong> <strong>PON1</strong> demonstrated that the active sites <strong>for</strong> arylesters and phosphotriesters are different [38]. Thus, it is not unexpectedthat the rates <strong>of</strong> hydrolysis <strong>of</strong> the different substrates could bedifferentially affected by storage conditions.Temperature was positively correlated with AREase and DZOase<strong>activity</strong>. These two <strong>assays</strong> are <strong>of</strong>ten per<strong>for</strong>med at ambient roomtemperature and thus may be affected when temperature fluctuationscannot be avoided in the laboratory environment. To minimize theseeffects, one could (1) adjust <strong>for</strong> temperature variation using statisticalmodeling or (2) ensure temperature stabilization by setting the microplatespectrophotometer temperature to some level slightly higher than typicalroom temperature.Specimen type is another source <strong>of</strong> variability <strong>for</strong> <strong>PON1</strong> <strong>enzyme</strong><strong>activity</strong>. Some <strong>studies</strong> may only have certain specimens available <strong>for</strong>analyses; there<strong>for</strong>e it is important to determine what potentialdifferences may arise when per<strong>for</strong>ming <strong>assays</strong> in varying specimentypes such as serum or heparinized plasma. In our study, <strong>PON1</strong> <strong>activity</strong>was higher in serum than plasma. However, <strong>enzyme</strong> <strong>activity</strong> in serumand heparinized plasma samples were highly correlated. Our resultscorroborated those reported by Brackley et al. [29], who also reportedhigher <strong>PON1</strong> <strong>enzyme</strong> <strong>activity</strong> in serum versus plasma. They suggest thatfibrin clots retain water, resulting in slightly higher serum concentrations.These differences between serum and plasma <strong>PON1</strong> <strong>activity</strong>should be taken into account when designing a study and comparingvalues to those reported in other <strong>studies</strong>.This study provided an opportunity to carefully examine challengesthat may exist when using <strong>PON1</strong> <strong>assays</strong> in <strong>longitudinal</strong> and pediatricdisease <strong>studies</strong>. Utilizing samples from 2 pediatric cohorts, we were ableto explore a comprehensive set <strong>of</strong> variability factors. Additionally,samples from these cohorts had been stored <strong>for</strong> long periods <strong>of</strong> time,allowing us to determine the effects <strong>of</strong> storage time over much greaterdurations than most previous <strong>studies</strong>.<strong>PON1</strong> has been implicated in many important pathways affectinghealth, including OP sensitivity and oxidative stress, and the number <strong>of</strong><strong>studies</strong> <strong>of</strong> PON genotypes and <strong>activity</strong> is growing quickly [1,39–41].Measurement <strong>of</strong> <strong>PON1</strong> levels as determined by enzymatic <strong>assays</strong> isessential <strong>for</strong> determination <strong>of</strong> <strong>PON1</strong> status and provides more in<strong>for</strong>mationthan <strong>PON1</strong> genotype alone. Thus, the use <strong>of</strong> <strong>PON1</strong> enzymatic <strong>assays</strong> tocharacterize host variability may help clarify potential susceptibilities tomajor health endpoints. Our study demonstrates that results are relativelyreproducible within and between <strong>assays</strong> and also between laboratorieswhen using a standardized protocol. Sources <strong>of</strong> technical variabilityincluding temperature, storage duration, and freeze–thaw cycles shouldbe monitored and minimized either via study design or through statisticaladjustment. It is <strong>of</strong> particular concern <strong>for</strong> <strong>longitudinal</strong> <strong>studies</strong>, where longterm specimen handling and storage are more likely to affect results.AcknowledgementsWe are grateful to the laboratory and clinical staff and participants<strong>of</strong> the CHAMACOS study and the Pediatric IBD consortium <strong>for</strong> theircontributions. This publication was made possible by grant numberR03 DK60617 from the National Institutes <strong>of</strong> Health (NIH), R826886and R82670901 from the U.S. Environmental Protection Agency(EPA), R01ESO12503-03, PO1 ES009605, ES09883, ES09601, andES04696 from the National Institute <strong>of</strong> Environmental Health Science(NIEHS). Its contents are solely the responsibility <strong>of</strong> the authors anddo not necessarily represent the <strong>of</strong>ficial views <strong>of</strong> the NIEHS, NIH andthe EPA.References[1] Li HL, Liu DP, Liang CC. Paraoxonase gene polymorphisms, oxidative stress, anddiseases. J Mol Med 2003;81:766–79.[2] Costa LG, Cole TB, Vitalone A, Furlong CE. Measurement <strong>of</strong> paraoxonase (<strong>PON1</strong>)status as a potential biomarker <strong>of</strong> susceptibility to organophosphate toxicity. ClinChim Acta 2005;352:37–47.[3] DPR, Pesticide Use Report, Annual. Sacramento, CA: Department <strong>of</strong> PesticideRegulation, Cali<strong>for</strong>nia Environmental Protection Agency, 2005; 2005.[4] Rosamond W, Flegal K, Friday G, et al. Heart disease and stroke statistics—2007update: a report from the American Heart Association Statistics Committee andStroke Statistics Subcommittee. Circulation 2007;115:e69–e171.[5] Aviram M, Rosenblat M. Paraoxonases 1, 2, and 3, oxidative stress, and macrophagefoam cell <strong>for</strong>mation during atherosclerosis development. Free Radic Biol Med2004;37:1304–16.