Transportation Equity and Access to Jobs in ... - UW-Milwaukee
Transportation Equity and Access to Jobs in ... - UW-Milwaukee
Transportation Equity and Access to Jobs in ... - UW-Milwaukee

Create successful ePaper yourself
Turn your PDF publications into a flip-book with our unique Google optimized e-Paper software.
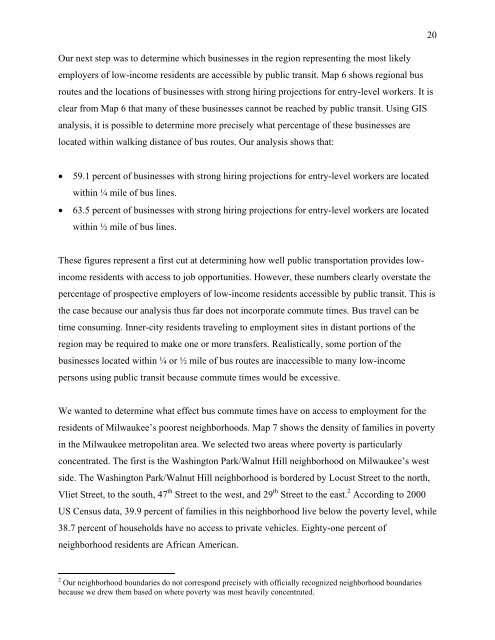
20Our next step was <strong>to</strong> determ<strong>in</strong>e which bus<strong>in</strong>esses <strong>in</strong> the region represent<strong>in</strong>g the most likelyemployers of low-<strong>in</strong>come residents are accessible by public transit. Map 6 shows regional busroutes <strong>and</strong> the locations of bus<strong>in</strong>esses with strong hir<strong>in</strong>g projections for entry-level workers. It isclear from Map 6 that many of these bus<strong>in</strong>esses cannot be reached by public transit. Us<strong>in</strong>g GISanalysis, it is possible <strong>to</strong> determ<strong>in</strong>e more precisely what percentage of these bus<strong>in</strong>esses arelocated with<strong>in</strong> walk<strong>in</strong>g distance of bus routes. Our analysis shows that:• 59.1 percent of bus<strong>in</strong>esses with strong hir<strong>in</strong>g projections for entry-level workers are locatedwith<strong>in</strong> ¼ mile of bus l<strong>in</strong>es.• 63.5 percent of bus<strong>in</strong>esses with strong hir<strong>in</strong>g projections for entry-level workers are locatedwith<strong>in</strong> ½ mile of bus l<strong>in</strong>es.These figures represent a first cut at determ<strong>in</strong><strong>in</strong>g how well public transportation provides low<strong>in</strong>comeresidents with access <strong>to</strong> job opportunities. However, these numbers clearly overstate thepercentage of prospective employers of low-<strong>in</strong>come residents accessible by public transit. This isthe case because our analysis thus far does not <strong>in</strong>corporate commute times. Bus travel can betime consum<strong>in</strong>g. Inner-city residents travel<strong>in</strong>g <strong>to</strong> employment sites <strong>in</strong> distant portions of theregion may be required <strong>to</strong> make one or more transfers. Realistically, some portion of thebus<strong>in</strong>esses located with<strong>in</strong> ¼ or ½ mile of bus routes are <strong>in</strong>accessible <strong>to</strong> many low-<strong>in</strong>comepersons us<strong>in</strong>g public transit because commute times would be excessive.We wanted <strong>to</strong> determ<strong>in</strong>e what effect bus commute times have on access <strong>to</strong> employment for theresidents of <strong>Milwaukee</strong>’s poorest neighborhoods. Map 7 shows the density of families <strong>in</strong> poverty<strong>in</strong> the <strong>Milwaukee</strong> metropolitan area. We selected two areas where poverty is particularlyconcentrated. The first is the Wash<strong>in</strong>g<strong>to</strong>n Park/Walnut Hill neighborhood on <strong>Milwaukee</strong>’s westside. The Wash<strong>in</strong>g<strong>to</strong>n Park/Walnut Hill neighborhood is bordered by Locust Street <strong>to</strong> the north,Vliet Street, <strong>to</strong> the south, 47 th Street <strong>to</strong> the west, <strong>and</strong> 29 th Street <strong>to</strong> the east. 2 Accord<strong>in</strong>g <strong>to</strong> 2000US Census data, 39.9 percent of families <strong>in</strong> this neighborhood live below the poverty level, while38.7 percent of households have no access <strong>to</strong> private vehicles. Eighty-one percent ofneighborhood residents are African American.2 Our neighborhood boundaries do not correspond precisely with officially recognized neighborhood boundariesbecause we drew them based on where poverty was most heavily concentrated.