POTENTIAL BIOGAS PRODUCTION FROM FISH WASTE AND ...
POTENTIAL BIOGAS PRODUCTION FROM FISH WASTE AND ...
POTENTIAL BIOGAS PRODUCTION FROM FISH WASTE AND ...

You also want an ePaper? Increase the reach of your titles
YUMPU automatically turns print PDFs into web optimized ePapers that Google loves.
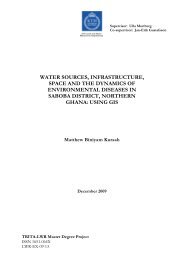
Potential Biogas Production from Fish Waste and Sludgecollected in this group was 0.406 Nm 3 CH 4/kg VS from B2, whichincluded 16.5 % cod meat with 33.5 % cod intestines. The value of thelowest biogas production was 0.285 Nm 3 CH 4/kg VS produced from B4containing 33.5 % cod meat (Fig. 15).The daily MP in Group B (Fig. 16) was shown similar to it in Group A,which had two peaks, i.e. higher peak happened in the 3 rd day and lowerpeak appeared in the 9 th day. The stronger adaptability of microorganismsaccelerated the speed of digestion. The highest daily MP wasobtained, i.e. 0.106 Nm 3 CH 4/kg VS, at the 3 rd day from the 16.5 % codmeat mixed with 33.5 % cod intestine.In Group B, it was clear to observe that less content of cod meat, i.e.large content of cod intestines, mixed with 50 % sludge could improvethe CH 4 production (Fig. 17). However, in the comparison of the highestproduction in Group B, the extremely lower cod meat led to thereduction of CH 4 yield by 16 %, and the overabundance of cod meatwould cut more CH 4 yield down up to 30 %. Therefore, the content ofcod meat was kept around 16.5 % that could be the best proportion forsubstrates mixed with 50 % sludge.4.3. The effect of sludge on co-digestion processThe purpose of mixing with sludge was to adjust the alkalinity conditionin the range of pH value between 7.0 and 8.0, due to high concentrationof ammonia produced from cod meat and intestine. There were twodifferent sludge contents mixed with cod meat and intestine that wereanalyzed, i.e. Group A contained 33 % sludge content and Group Bcontained 50 % sludge content separately. The comparison of additivesludge effects on the CH 4 production in both groups was based on thesame proportion of cod meat and cod intestine themselves except sludgecontent, such as A2 compared with B2, which both had the same ratio ofcod meat and cod intestine as 1:2. All the mixtures in Group A hadhigher MP than the corresponding mixtures in Group B after 13 days(Fig. 18). Moreover, A4 had the highest MP (0.533 Nm 3 CH 4/kg VS)among all the mixtures which still had the trend to increase the CH 4 yieldlater.Fig. 15 Methane potential of Group B (containing 50% sludge) based onaccumulated gas volume.23