CONSOLIDATED FINANCIAL STATEMENTS - Lukoil
CONSOLIDATED FINANCIAL STATEMENTS - Lukoil
CONSOLIDATED FINANCIAL STATEMENTS - Lukoil

Create successful ePaper yourself
Turn your PDF publications into a flip-book with our unique Google optimized e-Paper software.
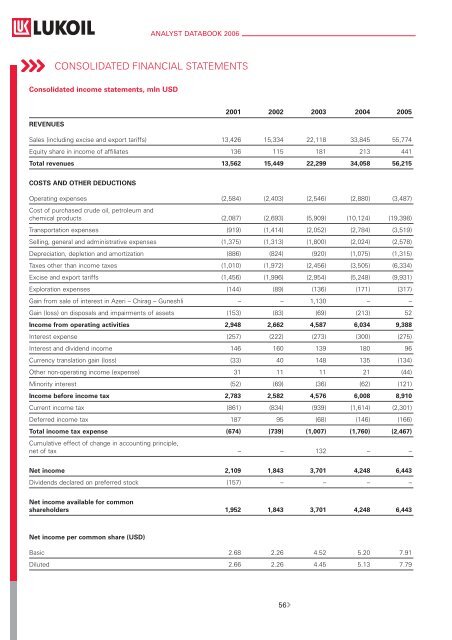
ANALYST DATABOOK 2006<strong>CONSOLIDATED</strong> <strong>FINANCIAL</strong> <strong>STATEMENTS</strong>Consolidated income statements, mln USD2001 2002 2003 2004 2005REVENUESSales (including excise and export tariffs) 13,426 15,334 22,118 33,845 55,774Equity share in income of affiliates 136 115 181 213 441Total revenues 13,562 15,449 22,299 34,058 56,215COSTS AND OTHER DEDUCTIONSOperating expenses (2,584) (2,403) (2,546) (2,880) (3,487)Cost of purchased crude oil, petroleum andchemical products (2,087) (2,693) (5,909) (10,124) (19,398)Transportation expenses (919) (1,414) (2,052) (2,784) (3,519)Selling, general and administrative expenses (1,375) (1,313) (1,800) (2,024) (2,578)Depreciation, depletion and amortization (886) (824) (920) (1,075) (1,315)Taxes other than income taxes (1,010) (1,972) (2,456) (3,505) (6,334)Excise and export tariffs (1,456) (1,996) (2,954) (5,248) (9,931)Exploration expenses (144) (89) (136) (171) (317)Gain from sale of interest in Azeri – Chirag – Guneshli – – 1,130 – –Gain (loss) on disposals and impairments of assets (153) (83) (69) (213) 52Income from operating activities 2,948 2,662 4,587 6,034 9,388Interest expense (257) (222) (273) (300) (275)Interest and dividend income 146 160 139 180 96Currency translation gain (loss) (33) 40 148 135 (134)Other non-operating income (expense) 31 11 11 21 (44)Minority interest (52) (69) (36) (62) (121)Income before income tax 2,783 2,582 4,576 6,008 8,910Current income tax (861) (834) (939) (1,614) (2,301)Deferred income tax 187 95 (68) (146) (166)Total income tax expense (674) (739) (1,007) (1,760) (2,467)Cumulative effect of change in accounting principle,net of tax – – 132 – –Net income 2,109 1,843 3,701 4,248 6,443Dividends declared on preferred stock (157) – – – –Net income available for commonshareholders 1,952 1,843 3,701 4,248 6,443Net income per common share (USD)Basic 2.68 2.26 4.52 5.20 7.91Diluted 2.66 2.26 4.45 5.13 7.7956
FINANCESConsolidated balance sheet (as of December 31), mln USD2000 2001 2002 2003 2004 2005ASSETSCurrent assetsCash and cash equivalents 1,137 1,170 1,252 1,435 1,257 1,650Short-term investments 253 218 278 251 149 111Accounts and notes receivable, net 2,948 2,230 2,511 3,790 3,867 5,533Inventories 719 829 1,063 1,243 1,759 2,619Prepaid taxes and other expenses 675 889 736 897 1,242 2,107Other current assets 362 340 356 255 300 287Assets held for sale – – 279 52 – 190Total current assets 6,094 5,676 6,475 7,923 8,574 12,497Investments 423 770 934 594 779 1,110Property, plant and equipment 9,906 12,296 13,499 16,859 19,329 25,464Deferred income tax assets 201 291 206 117 138 181Goodwill and other intangible assets 278 485 399 523 610 680Other non-current assets 207 424 488 558 331 413Total assets 17,109 19,942 22,001 26,574 29,761 40,345LIABILITIES AND STOCKHOLDERS’ EQUITYCurrent liabilitiesAccounts payable 2,221 1,402 1,293 1,564 1,787 2,167Short-term borrowings and currentportion of long-term debt 829 1,031 1,772 1,412 1,265 853Customer deposits and other borrowingsof banking subsidiaries – 449 755 1,007 3 –Taxes payable 404 522 640 943 1,238 2,087Other current liabilities 238 421 337 345 252 729Total current liabilities 3,692 3,825 4,797 5,271 4,545 5,836Long-term debt 1,483 1,948 1,666 2,392 2,609 4,137Deferred income tax liabilities 284 390 261 497 698 1,830Asset retirement obligations – – – 210 307 387Other long-term liabilities 147 463 397 249 338 332Minority interest in subsidiary companies 984 931 880 483 453 1,019Total liabilities 6,590 7,557 8,001 9,102 8,950 13,541Stockholders’ equityCommon stock 14 15 15 15 15 15Preferred stock 1 – – – – –Treasury stock, at cost (376) (403) (428) (435) (706) (527)Additional paid-in capital 2,895 3,044 3,229 3,522 3,564 3,730Retained earnings 7,994 9,738 11,186 14,371 17,938 23,586Accumulated other comprehensive loss (9) (9) (2) (1) – –Total stockholders’ equity 10,519 12,385 14,000 17,472 20,811 26,804Total liabilities and stockholders’ equity 17,109 19,942 22,001 26,574 29,761 40,34557
ANALYST DATABOOK 2006Consolidated statements of cash flows, mln USDCASH FLOWS FROM OPERATING ACTIVITIES2001 2002 2003 2004 2005Net income 2,109 1,843 3,701 4,248 6,443Adjustments for non-cash items:Cumulative effect of change in accounting principle – – (132) – –Depreciation, depletion and amortization 886 824 920 1,075 1,315Equity share in income of affiliates (136) (100) (122) (169) (397)Gain from sale of interest in Azeri – Chirag – Guneshli – – (1,130) – –Dry hole costs 68 26 48 42 170(Gain) loss on disposals and impairments of assets 153 83 69 213 (52)Deferred income taxes (187) (95) 68 146 166Non-cash currency translation (gain) loss 24 (21) 17 (4) (26)Non-cash investment activities (96) (72) (64) (123) (133)All other items – net 113 52 32 97 151Changes in operating assets and liabilities:Accounts and notes receivable 931 (125) (797) (694) (1,314)Short-term loans receivable of a banking subsidiary (95) 39 (223) (101) (23)Customer deposits placed in a banking subsidiary 208 171 341 (90) 49Inventories (56) (201) (153) (571) (735)Accounts payable (1,077) (273) 186 306 245Taxes payable 109 30 284 310 705Other current assets and liabilities (281) 215 (109) (505) (467)Net cash provided by operating activities 2,673 2,396 2,936 4,180 6,097CASH FLOWS FROM INVESTMENT ACTIVITIESCapital expenditures (2,521) (2,072) (2,881) (3,248) (3,982)Proceeds from sale of property, plant and equipment 45 34 62 99 51Purchases of investments (314) (302) (459) (540) (242)Proceeds from sale of investments 228 118 374 242 234Proceeds from sale of interest in Azeri – Chirag – Guneshli – – 1,337 – –Sale of interests in subsidiaries and affiliated companies – – – 183 588Acquisitions of subsidiaries and minority shareholding interest(including advances related to these acquisitions), net of cashacquired (499) (168) (1,225) (477) (2,874)Net cash used in investment activities (3,061) (2,390) (2,792) (3,741) (6,225)CASH FLOWS FROM FINANCING ACTIVITIESNet movements of short-term borrowings 121 203 220 (170) (638)Proceeds from issuance of long-term debt 938 879 1,445 1,191 2,474Principal repayments of long-term debt (349) (579) (1,124) (778) (704)Dividends paid (244) (423) (467) (661) (746)Financing from related party – – – – 101Proceeds from issuance of common stock – 18 – – –Purchase of treasury stock (185) (326) (368) (502) –Proceeds from sale of treasury stock 158 316 290 273 46Other – net 32 8 – (3) 6Net cash provided by (used in) financing activities 471 96 (4) (650) 539Effect of exchange rate changes on cashand cash equivalents (50) (20) 43 33 (18)Net increase (decrease) in cash and cash equivalents 33 82 183 (178) 393Cash and cash equivalents at beginning of year 1,137 1,170 1,252 1,435 1,257Cash and cash equivalents at end of year 1,170 1,252 1,435 1,257 1,65058
FINANCESConsolidated statements of stockholders’ equity and comprehensive income, mln USD2001 2002 2003 2004 2005Common stockBalance as of January 1 14 15 15 15 15Conversion of preferred stock into common stock 1 – – – –Outstanding as of December 31 15 15 15 15 15Preferred StockBalance as of January 1 1 – – – –Conversion of preferred stock into common stock (1) – – – –Outstanding as of December 31 – – – – –Treasury stockBalance as of January 1 (376) (403) (428) (435) (706)Stock purchased (185) (326) (368) (502) –Stock sold 158 301 361 231 179Outstanding as of December 31 (403) (428) (435) (706) (527)Additional paid-in capitalBalance as of January 1 2,895 3,044 3,229 3,522 3,564Premium on non-outstanding shares issued 147 170 38 – 47Proceeds from sale of treasury stock in excessof carrying amount 2 15 255 42 119Outstanding as of December 31 3,044 3,229 3,522 3,564 3,730Retained earningsBalance as of January 1 7,994 9,738 11,186 14,371 17,938Net income (comprehensive income) 2,109 1,843 3,701 4,248 6,443Net income (stockholders’ equity) 2,109 1,843 3,701 4,248 6,443Dividends on preferred stock (157) – – – –Dividends on common stock (208) (395) (516) (681) (795)Outstanding as of December 31 9,738 11,186 14,371 17,938 23,586Accumulated other comprehensive loss, net of taxBalance as of January 1 (9) (9) (2) (1) –Foreign currency translation adjustment(comprehensive income) 14 (7) 1 1 –Foreign currency translation adjustment(stockholders’ equity) 14 (7) 1 1 –Minimum pension liability adjustment(comprehensive income) (14) 14 – – –Minimum pension liability adjustment(stockholders’ equity) (14) 14 – – –Outstanding as of December 31 (9) (2) (1) – –Total comprehensive income for the year 2,109 1,850 3,702 4,249 6,443Total stockholders’ equity as of December 31 12,385 14,000 17,472 20,811 26,80459
ANALYST DATABOOK 2006Share activity, mln shares2001 2002 2003 2004 2005Common stock, issuedBalance as of January 1 738 850 850 850 850Issuance of common stock 35 – – – –Conversion of preferred stock into common stock 77 – – – –Balance as of December 31 850 850 850 850 850Preferred sharesBalance as of January 1 77 – – – –Conversion of preferred stock into common stock (77) – – – –Balance as of December 31 – – – – –Treasury stockBalance as of January 1 (23) (26) (27) (26) (34)Purchase of treasury stock (17) (21) (19) (18) –Sales of treasury stock 14 20 20 10 12Balance as of December 31 (26) (27) (26) (34) (22)Capital expenditures * , mln USD2001 ** 2002 ** 2003 2004 2005Capital expendituresExploration and production 1,789 1,411 1,784 2,289 2,918Russia 1,543 1,078 1,537 2,100 2,487International 246 333 247 189 431Refining, marketing and distribution 828 793 1,175 1,070 1,129Russia 645 683 911 677 654International 183 110 264 393 475Petrochemicals n/a n/a 39 71 77Russia n/a n/a 28 55 59International n/a n/a 11 16 18Other n/a n/a 20 17 53Total capital expenditures * 2,617 2,204 3,018 3,447 4,177Acquisitions of companies and Group investments ***Exploration and production 467 67 989 166 2,737Russia 467 67 989 23 778International – – – 143 1,959Refining, marketing and distribution 94 110 280 306 256Russia 35 53 23 1 27International 59 57 257 305 229Petrochemicals n/a n/a – – –Other n/a n/a – 5 –Less cash acquired (62) (4) (44) – (119)Total 499 173 1,225 477 2,874* Including non-cash transactions.** Capital expenditures and acquisitions for “petrochemicals” and “other” are included into “Refining, marketing and distribution”.*** Including prepayments related to acquisitions of subsidiaries and buyout of minorities.60
FINANCES<strong>FINANCIAL</strong> RATIOSSpecific financial ratios2001 2002 2003 * 2004 2005Sales per boe of production, USD per barrel 23.5 25.9 35.4 50.3 78.7Income from operating activities perboe of production, USD per barrel 5.2 4.5 5.5 9.0 13.2Net income per boe of production, USD per barrel 3.7 3.1 4.1 6.3 9.1Capital expenditures in exploration and productionper boe of production, USD per barrel 3.1 2.4 2.9 3.4 4.1Capitalization per boe of reserves, USD per barrel 0.6 0.7 1.0 1.3 2.5Capitalization per boe of production, USD per barrel 18.2 22.1 31.6 38.4 71.3Profitability and efficiency ratiosIncome marginIncome margin =IncomeSales2001 2002 2003 * 2004 2005Sales, mln USD 13,426 15,334 22,118 33,845 55,774Income from operating activities, mln USD 2,948 2,662 3,457 6,034 9,388Income before tax, mln USD 2,783 2,582 3,446 6,008 8,910Net income, mln USD 2,109 1,843 2,571 4,248 6,443Operating margin, % 22.0 17.4 15.6 17.8 16.8Pretax margin, % 20.7 16.8 15.6 17.8 16.0Net margin, % 15.7 12.0 11.6 12.6 11.6EBIT and EBITDAEBIT = Income before income tax + Interest expense – Interest and dividend incomeEBITDA = EBIT + Depreciation, depletion and amortization2001 2002 2003 * 2004 2005Income before tax, mln USD 2,783 2,582 3,446 6,008 8,910Interest expense, mln USD 257 222 273 300 275Interest and dividend income, mln USD (146) (160) (139) (180) (96)EBIT, mln USD 2,894 2,644 3,580 6,128 9,089Depreciation, depletion and amortization, mln USD 886 824 920 1,075 1,315EBITDA, mln USD 3,780 3,468 4,500 7,203 10,404EBIT margin, % 21.6 17.2 16.2 18.1 16.3EBITDA margin, % 28.2 22.6 20.3 21.3 18.7* Excluding gain from sale of interest in Azeri – Chirag – Guneshli.Market capitalization to provedhydrocarbon reserves, USD per boe321Net income to production,USD per boe10864Net margin, %161514131202001 2002 2003 2004 200522001 2002 2003 2004 2005112001 2002 2003 2004 200561
ANALYST DATABOOK 2006Return on equityReturn on equity =Net incomeAverage equity for the year2000 2001 2002 2003 * 2004 2005Equity, mln USD 10,519 12,385 14,000 17,472 20,811 26,804Net income, mln USD 2,109 1,843 2,571 4,248 6,443Return on equity, % 18.4 14.0 16.3 22.2 27.1Return on assetsReturn on assets =Net incomeAverage assets for the year2000 2001 2002 2003 * 2004 2005Assets, mln USD 17,109 19,942 22,001 26,574 29,761 40,345Net income, mln USD 2,109 1,843 2,571 4,248 6,443Return on assets, % 11.4 8.8 10.6 15.1 18.4Return on non-current assetsNet incomeReturn on non-current assets = Average non-current assets for the year2000 2001 2002 2003 * 2004 2005Non-current assets, mln USD 11,015 14,266 15,526 18,651 21,187 27,848Net income, mln USD 2,109 1,843 2,571 4,248 6,443Return on non-current assets, % 16.7 12.4 15.0 21.3 26.3* Excluding gain from sale of interest in Azeri – Chirag – Guneshli.Return on equity, %30Return on assets, %20Return on non-current assets, %302520151510252015102001 2002 2003 2004 200552001 2002 2003 2004 2005102001 2002 2003 2004 2005Turnover of accounts receivableand accounts payable, days70Assets turnover, days600ROACE, %255550020402540030015102001 2002 2003 2004 20052002001 2002 2003 2004 2005102001 2002 2003 2004 2005Accounts receivableAccounts payable62
FINANCESROACENet income + Interest expense х (1 – Effective income tax rate) + Minority interestROACE = Average for the year (Equity + Long-term debt + Short-term debt + Minority interest)2000 2001 2002 2003 * 2004 2005Equity, mln USD 10,519 12,385 14,000 17,472 20,811 26,804Long-term debt, mln USD 1,483 1,948 1,666 2,392 2,609 4,137Short-term debt, mln USD 829 1,031 1,772 1,412 1,265 853Minority interest in subsidiarycompanies, mln USD 984 931 880 483 453 1,019Net income, mln USD 2,109 1,843 2,571 4,248 6,443Interest expense, mln USD 257 222 273 300 275Minority interest, mln USD 52 69 36 62 121Effective income tax rate, % 24.2 28.6 29.2 29.3 27.7ROACE, % 15.6 12.0 14.0 19.3 23.3Assets turnover (as of December 31)Asset turnover =Assets х 365 daysSales2001 2002 2003 2004 2005Sales, mln USD 13,426 15,334 22,118 33,845 55,774Assets, mln USD 19,942 22,001 26,574 29,761 40,345Assets turnover, days 542 524 439 321 264Accounts payable turnover (as of December 31)Accounts payable turnover =Accounts payable х 365 daysSales2001 2002 2003 2004 2005Sales, mln USD 13,426 15,334 22,118 33,845 55,774Accounts payable, mln USD 1,402 1,293 1,564 1,787 2,167Accounts payable turnover, days 38 31 26 19 14Accounts receivable turnover (as of December 31)Accounts receivable turnover =Accounts receivable х 365 daysSales2001 2002 2003 2004 2005Sales, mln USD 13,426 15,334 22,118 33,845 55,774Accounts receivable, mln USD 2,230 2,511 3,790 3,867 5,533Accounts receivable turnover, days 61 60 63 42 36* Excluding gain from sale of interest in Azeri – Chirag – Guneshli.63
ANALYST DATABOOK 2006Gearing ratiosTotal debt to total capital (as of December 31)2001 2002 2003 2004 2005Total debt, mln USD 3,428 4,193 4,811 3,877 4,990Equity, mln USD 12,385 14,000 17,472 20,811 26,804Total capital, mln USD 15,813 18,193 22,283 24,688 31,794Total debt to total capital, % 21.7 23.0 21.6 15.7 15.7Total debt to equity (as of December 31)2001 2002 2003 2004 2005Total debt, mln USD 3,428 4,193 4,811 3,877 4,990Equity, mln USD 12,385 14,000 17,472 20,811 26,804Total debt to equity, % 27.7 30.0 27.5 18.6 18.6Total debt to EBITDA (as of December 31)2001 2002 2003 2004 2005Total debt, mln USD 3,428 4,193 4,811 3,877 4,990EBITDA, mln USD 3,780 3,468 4,500 7,203 10,404Total debt to EBITDA, % 90.7 120.9 106.9 53.8 48.0Financial guarantees, mln USD 534 667 781 642 473Adjusted total debt,mln USD 3,962 4,860 5,592 4,519 5,463Adjusted total debtto EBITDA, % 104.8 140.1 124.3 62.7 52.5Short-term debt to total debt (as of December 31)2001 2002 2003 2004 2005Short-term debt, mln USD 1,031 1,772 1,412 1,265 853Total debt, mln USD 3,428 4,193 4,811 3,877 4,990Short-term debtto total debt, % 30.1 42.3 29.3 32.6 17.1Secured debt to total debt (as of December 31)2001 2002 2003 2004 2005Secured debt, mln USD n/a 1,702 2,175 2,171 1,672Total debt, mln USD n/a 4,193 4,811 3,877 4,990Secured debt to totaldebt, % n/a 40.6 45.2 56.0 33.5Total debt to total capital, %35302520Adjusted total debt to EBITDA, %350300250200150100Short-term debt to total debt, %453525152001 2002 2003 2004 2005502001 2002 2003 2004 2005152001 2002 2003 2004 200564
FINANCESFinancial guarantees to total debt (as of December 31)2001 2002 2003 2004 2005Financial guarantees, mln USD 534 667 781 642 473Total debt, mln USD 3,428 4,193 4,811 3,877 4,990Financial guarantees tototal debt, % 15.6 15.9 16.2 16.6 9.5Fixed debt to total debt * (as of December 31)2001 2002 2003 2004 2005Fixed debt, mln USD n/a 918 761 1,074 907Total debt, mln USD n/a 3,438 3,804 3,874 4,990Fixed debt tototal debt, % n/a 26.7 20.0 27.7 18.2* Excluding liabilities of banking subsidiaries.Net debt (as of December 31)Net debt = Long-term debt + Customer deposits of banking subsidiaries + Short-term debt – Cash2001 2002 2003 2004 2005Long-term debt, mln USD 1,948 1,666 2,392 2,609 4,137Short-term debt, mln USD 1,031 1,772 1,412 1,265 853Customer deposits and otherborrowings of banking subsidiaries, mln USD 449 755 1 007 3 0Cash and cash equivalents,mln USD 1,170 1,252 1,435 1,257 1,650Net debt, mln USD 2,258 2,941 3,376 2,620 3,340Cash of banking subsidiaries in roublesand other currencies, mln USD 365 436 667 176 102Financial guarantees, mln USD 534 667 781 642 473Adjusted net debt, mln USD 3,157 4,044 4,824 3,438 3,915Net debt to equity (as of December 31)2001 2002 2003 2004 2005Net debt, mln USD 2,258 2,941 3,376 2,620 3,340Equity, mln USD 12,385 14,000 17,472 20,811 26,804Net debt to equity, % 18.2 21.0 19.3 12.6 12.5Adjusted net debt, mln USD 3,157 4,044 4,824 3,438 3,915Adjusted net debt to equity, % 25.5 28.9 27.6 16.5 14.6Secured debt to total debt, %605040Fixed debt to total debt, %4035302520Financial guarantees to total debt, %201510302002 2003 2004 2005152002 2003 2004 2005520012002 2003 2004 200565
ANALYST DATABOOK 2006Net debt to cash flow from operating activities (as of December 31)2001 2002 2003 2004 2005Net debt, mln USD 2,258 2,941 3,376 2,620 3,340Cash flow from operatingactivities, mln USD 2,673 2,396 2,936 4,180 6,097Net debt to cash flowfrom operating activities, % 84,5 122,7 115,0 62,7 54,8Adjusted net debt, mln USD 3,157 4,044 4,824 3,438 3,915Adjusted net debt to cash flowfrom operating activities, % 118.1 168.8 164.3 82.2 64.2EBITDA interest coverage2001 2002 2003 * 2004 2005EBITDA, mln USD 3,780 3,468 4,500 7,203 10,404Interest expense, mln USD 257 222 273 300 275EBITDA interest coverage 14.7 15.6 16.5 24.0 37.8Free cash flow2001 2002 2003 2004 2005Capital expenditures in explorationand production, mln USD 1,789 1,411 1,784 2,289 2,918Capital expenditures in refining, marketingand distribution, petrochemicals andother, mln USD 828 793 1,234 1,158 1,259Cash flow from operating activities, mln USD 2,673 2,396 2,936 4,180 6,097Free cash flow, mln USD 56 192 (82) 733 1,920* Excluding gain from sale of interest in Azeri – Chirag – Guneshli.Net debt, bln USD3.53.02.52.0Net debt to cash flow fromoperating activities, %130100702001 2002 2003 2004 2005Adjusted net debt to equity, %6050403020102001 2002 2003 2004 2005EBITDA interest coverage5040302010Structure of cash flow fromoperating activities, bln USD6.55.23.92.61.30.02001 2002 2003 2004Free cash flow2005Capital expenditures in refining & marketingCapital expenditures in exploration & production402001 2002 2003 2004 200502001 2002 2003 2004 200566
FINANCESLiquidity ratiosCash ratio (as of December 31)Cash ratio =Cash and cash equivalentsCurrent liabilities2001 2002 2003 2004 2005Cash and cash equivalents,mln USD 1,170 1,252 1,435 1,257 1,650Current liabilities, mln USD 3,825 4,797 5,271 4,545 5,836Cash ratio 0.31 0.26 0.27 0.28 0.28Quick ratio (as of December 31)Quick ratio =Cash + Short-term investments + Accounts and notes receivableCurrent liabilities2001 2002 2003 2004 2005Cash and cash equivalents,mln USD 1,170 1,252 1,435 1,257 1,650Short-term investments,mln USD 218 278 251 149 111Accounts receivable,mln USD 2,230 2,511 3,790 3,867 5,533Current liabilities, mln USD 3,825 4,797 5,271 4,545 5,836Quick ratio 0.95 0.84 1.04 1.16 1.25Current ratio (as of December 31)Current ratio =Current assetsCurrent liabilities2001 2002 2003 2004 2005Current assets, mln USD 5,676 6,475 7,923 8,574 12,497Current liabilities, mln USD 3,825 4,797 5,271 4,545 5,836Current ratio 1.48 1.35 1.50 1.89 2.14Assets to equity (as of December 31)2001 2002 2003 2004 2005Assets, mln USD 19,942 22,001 26,574 29,761 40,345Equity, mln USD 12,385 14,000 17,472 20,811 26,804Assets to equity 1.61 1.57 1.52 1.43 1.51Cash ratio0.33Current ratio2.2Assets to equity1.640.310.290.272.01.81.61.41.581.521.460.252001 2002 2003 2004 20051.22001 2002 2003 2004 20051.402001 2002 2003 2004 200567
ANALYST DATABOOK 2006Market valuation of the CompanyEnterprise value (EV) (as of December 31)EV = Market capitalization + Long-term debt + Short-term debt – Cash2001 2002 2003 2004 2005Market capitalization, mln USD 10,402 13,116 19,776 25,815 50,523Long-term debt, mln USD 1,948 1,666 2,392 2,609 4,137Short-term debt, mln USD 1,031 1,772 1,412 1,265 853Cash and cash equivalents,mln USD 1,170 1,252 1,435 1,257 1,650EV, mln USD 12,211 15,302 22,145 28,432 53,863EV/EBITDA (as of December 31)2001 2002 2003 * 2004 2005EV, mln USD 12,211 15,302 22,145 28,432 53,863EBITDA, mln USD 3,780 3,468 4,500 7,203 10,404EV/EBITDA 3.23 4.41 4.92 3.95 5.18* Excluding gain from sale of interest in Azeri – Chirag – Guneshli.EV/DACF (as of December 31)EV/DACF =EVCash flow from operating activities + Interest expense adjusted for income tax2001 2002 2003 2004 2005EV, mln USD 12,211 15,302 22,145 28,432 53,863Cash flow from operatingactivities, mln USD 2,673 2,396 2,936 4,180 6,097Interest expense, mln USD 257 222 273 300 275Interest expense adjusted by effectiveincome tax rate, mln USD 195 159 193 212 199DACF, mln USD 2,868 2,555 3,129 4,392 6,296EV/DACF 4.3 6.0 7.0 6.5 8.5EV, bln USD6050403020EV/EBITDA5.55.04.54.03.5EV/DACF98765102001 2002 2003 2004 20053.02001 2002 2003 2004 200542001 2002 2003 2004 200568
FINANCESPrice to earnings (P/E) (as of December 31)2001 2002 2003 2004 2005Share price, USD 12.23 15.42 23.25 30.35 59.40Basic earnings per share, USD 2.68 2.26 4.52 5.20 7.91Р/E 4.56 6.82 5.14 5.84 7.51Price to sales (P/S) (as of December 31)2001 2002 2003 2004 2005Market capitalization, mln USD 10,402 13,116 19,776 25,815 50,523Sales, mln USD 13,426 15,334 22,118 33,845 55,774Price to sales 0.77 0.86 0.89 0.76 0.91Price to assets (as of December 31)2001 2002 2003 2004 2005Market capitalization, mln USD 10,402 13,116 19,776 25,815 50,523Assets, mln USD 19,942 22,001 26,574 29,761 40,345Price to assets 0.52 0.60 0.74 0.87 1.25Price to book (as of December 31)2001 2002 2003 2004 2005Market capitalization, mln USD 10,402 13,116 19,776 25,815 50,523Equity, mln USD 12,385 14,000 17,472 20,811 26,804Price to book 0.84 0.94 1.13 1.24 1.88Р/Е8Market capitalization to sales0.95Market capitalization to equity1.97650.900.850.801.51.142001 2002 2003 2004 20050.752001 2002 2003 2004 20050.72001 2002 2003 2004 200569