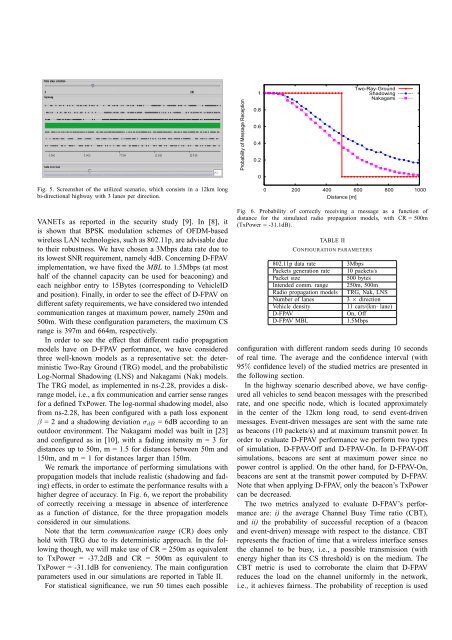
u 1 u 2 u 3 u 4 u 5 u 6 u 7 u 8u 1 150 150 150 150 150u 2 50 50 50 50 50 50u 3 50 50 50 50 50 50 50u 4 50 50 50 50 50 50 50u 5 50 50 50 50 50 50 50 50u 6 50 50 50 50 50 50 50u 7 50 50 50 50 50 50u 8 150 150 150 150TABLE ISUMMARIZATION OF D-FPAV EXECUTION. ENTRIES REPRESENT INMETERS THE MAXIMUM ALLOWED VALUE OF THE CS RANGE PER NODE.the entries is the value of the CS range, which is defined by acorrespondent transmit power level) as computed by node u i<strong>for</strong> all the nodes within its maximum CS range. For instance,the first row of the matrix represents the fact that node u 1computes maximum allowed CS range equal to 150m <strong>for</strong> allthe nodes within its maximum CS range, i.e. nodes u 1 ,...,u 5 .On the other hand, columns represent all the values of theallowed CS range that a node receives from the nodes withinits CS range. For instance, the first column represents thefact that node u 1 receives a power setting <strong>for</strong> itself by nodesu 2 ,...,u 5 . Then, the final power setting <strong>for</strong> every node inthe network as computed by D-FPAV corresponds to takingthe minimum over the values in its column. In our example,every node will end up D-FPAV execution setting the transmitpower to a value such that the corresponding CS range is 50m.B. Estimation of status in<strong>for</strong>mationLet us now discuss how node u i can collect the statusin<strong>for</strong>mation of all its surrounding nodes in order to computethe appropriate power level.The only option to acquire status in<strong>for</strong>mation from allnodes in CS MAX (i), which includes nodes located outsideof the transmission range, is making use of a strategy whereintermediate nodes re-transmit the status of their neighbors.Clearly, in a dynamic scenario only an estimation of theactual status in<strong>for</strong>mation will be available at the time D-FPAVhas to adjust the transmission power of a beacon, i.e., thelast received in<strong>for</strong>mation from neighboring nodes. There<strong>for</strong>e,the accuracy of D-FPAV will depend on the frequency thateach node transmits both its own and its neighbors statusin<strong>for</strong>mation. Furthermore, our algorithm requires the P i valuesfrom all nodes in CS MAX (i).We propose that each node aggregates the P i values withthe status in<strong>for</strong>mation of the corresponding nodes insideCS MAX (i) and then, to improve efficiency, piggyback thisaggregated in<strong>for</strong>mation in beacon messages.Now, decisions must be done with respect to what fractionof beacons should be piggybacked, and which transmit powershould be used to send beacons containing this additional in<strong>for</strong>mation.In making these choices there is a trade off betweenamount of load offered to the channel and accuracy of theneighbors status in<strong>for</strong>mation available at the nodes. Utilizing ahigher transmission power and piggybacking a higher numberof beacons could provide a higher accuracy of the requiredin<strong>for</strong>mation and, there<strong>for</strong>e, of D-FPAV per<strong>for</strong>mance. However,this additional amount of load have to be, in turn, controlleddue to D-FPAV’s purpose of limiting the load on the channel.In order to select the better option, we have per<strong>for</strong>med apreliminary set of ns-2 based simulations, using five differentconfigurations:1) piggyback the aggregated status in<strong>for</strong>mation to eachbeacon and transmit it with power PA(i) (the transmitpower value as computed by D-FPAV).2) piggyback the in<strong>for</strong>mation every 5 beacons and usepower P max <strong>for</strong> sending the augmented beacon.3) piggyback the in<strong>for</strong>mation every 5 beacons and usepower PA(i) <strong>for</strong> sending the augmented beacon.4) piggyback the in<strong>for</strong>mation every 10 beacons and usepower P max <strong>for</strong> sending the augmented beacon.5) piggyback the in<strong>for</strong>mation every 10 beacons and usepower PA(i) <strong>for</strong> sending the augmented beacon.We considered that sending piggybacked beacons with a lowerfrequency than one every 10 beacons would cause D-FPAV todeal with too outdated in<strong>for</strong>mation.Simulation results, which are not shown due to lack ofspace, showed that option 5) (send the status every 10 beaconswith power PA(i)) offers the best tradeoff between updatedstatus in<strong>for</strong>mation and additional overhead on the medium. Forthis reason, in the following we assume that neighbor statusin<strong>for</strong>mation is updated according to strategy 5) above.A. Simulation SetupV. SIMULATION STUDYThe version of the network simulator utilized in our experimentsis ns-2.28 [21], although several improvements havebeen included to the downloadable version. First, several bugshave been fixed in the MAC layer [22]. Second, the physicallayer has been adjusted to the IEEE 802.11p technology [7]with the values provided in [10]. Third, the Nakagami radiopropagation model, whose parameters were adjusted to matchactual measurements reported in [23], has been used.In order to have a realistic scenario with a dynamic networktopology, we employed the publicly available German highwaypatterns described in [24]. The chosen set <strong>for</strong> our evaluationis the most critical <strong>for</strong> safety: fast moving, ‘heavy’ traffic.In particular, we considered a 12km long road with hightraffic density, where vehicles travel at an average speed of121.86km/h. This straight portion of highway is composed of6 lanes, 3 in each direction, with an average vehicle densityof 11 vehicles per kilometer and lane (see a screenshot of thevisualization tool HWGui [24] in Fig. 5).There are several other parameters that have to be configuredto run reasonable simulation scenarios. We selected apacket generation rate <strong>for</strong> beacons of 10packets/s, which isconsidered an acceptable value to provide accurate enoughin<strong>for</strong>mation to the safety system [11]. The packet size of allbeacons have been fixed to 500Bytes, which is approximatelyin the middle of the interval of reasonable packet sizes in
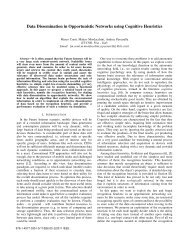
Probability of Message Reception10.80.60.40.20Two-Ray-GroundShadowingNakagamiFig. 5. Screenshot of the utilized scenario, which consists in a 12km longbi-directional highway with 3 lanes per direction.VANETs as reported in the security study [9]. In [8], itis shown that BPSK modulation schemes of OFDM-basedwireless LAN technologies, such as 802.11p, are advisable dueto their robustness. We have chosen a 3Mbps data rate due toits lowest SNR requirement, namely 4dB. Concerning D-FPAVimplementation, we have fixed the MBL to 1.5Mbps (at mosthalf of the channel capacity can be used <strong>for</strong> beaconing) andeach neighbor entry to 15Bytes (corresponding to VehicleIDand position). Finally, in order to see the effect of D-FPAV ondifferent safety requirements, we have considered two intendedcommunication ranges at maximum power, namely 250m and500m. With these configuration parameters, the maximum CSrange is 397m and 664m, respectively.In order to see the effect that different radio propagationmodels have on D-FPAV per<strong>for</strong>mance, we have consideredthree well-known models as a representative set: the deterministicTwo-Ray Ground (TRG) model, and the probabilisticLog-Normal Shadowing (LNS) and Nakagami (Nak) models.The TRG model, as implemented in ns-2.28, provides a diskrangemodel, i.e., a fix communication and carrier sense ranges<strong>for</strong> a defined Tx<strong>Power</strong>. The log-normal shadowing model, alsofrom ns-2.28, has been configured with a path loss exponentβ = 2 and a shadowing deviation σ dB = 6dB according to anoutdoor environment. The Nakagami model was built in [23]and configured as in [10], with a fading intensity m = 3 <strong>for</strong>distances up to 50m, m = 1.5 <strong>for</strong> distances between 50m and150m, and m = 1 <strong>for</strong> distances larger than 150m.We remark the importance of per<strong>for</strong>ming simulations withpropagation models that include realistic (shadowing and fading)effects, in order to estimate the per<strong>for</strong>mance results with ahigher degree of accuracy. In Fig. 6, we report the probabilityof correctly receiving a message in absence of interferenceas a function of distance, <strong>for</strong> the three propagation modelsconsidered in our simulations.Note that the term communication range (CR) does onlyhold with TRG due to its deterministic approach. In the followingthough, we will make use of CR = 250m as equivalentto Tx<strong>Power</strong> = -37.2dB and CR = 500m as equivalent toTx<strong>Power</strong> = -31.1dB <strong>for</strong> conveniency. The main configurationparameters used in our simulations are reported in Table II.For statistical significance, we run 50 times each possible0 200 400 600 800 1000Distance [m]Fig. 6. Probability of correctly receiving a message as a function ofdistance <strong>for</strong> the simulated radio propagation models, with CR = 500m(Tx<strong>Power</strong> = -31.1dB).TABLE IICONFIGURATION PARAMETERS802.11p data rate 3MbpsPackets generation rate 10 packets/sPacket size500 bytesIntended comm. range 250m, 500mRadio propagation models TRG, Nak, LNSNumber of lanes3 × directionVehicle density11 cars/(km· lane)D-FPAVOn, OffD-FPAV MBL1.5Mbpsconfiguration with different random seeds during 10 secondsof real time. The average and the confidence interval (with95% confidence level) of the studied metrics are presented inthe following section.In the highway scenario described above, we have configuredall vehicles to send beacon messages with the prescribedrate, and one specific node, which is located approximatelyin the center of the 12km long road, to send event-drivenmessages. Event-driven messages are sent with the same rateas beacons (10 packets/s) and at maximum transmit power. Inorder to evaluate D-FPAV per<strong>for</strong>mance we per<strong>for</strong>m two typesof simulation, D-FPAV-Off and D-FPAV-On. In D-FPAV-Offsimulations, beacons are sent at maximum power since nopower control is applied. On the other hand, <strong>for</strong> D-FPAV-On,beacons are sent at the transmit power computed by D-FPAV.Note that when applying D-FPAV, only the beacon’s Tx<strong>Power</strong>can be decreased.The two metrics analyzed to evaluate D-FPAV’s per<strong>for</strong>manceare: i) the average Channel Busy Time ratio (CBT),and ii) the probability of successful reception of a (beaconand event-driven) message with respect to the distance. CBTrepresents the fraction of time that a wireless interface sensesthe channel to be busy, i.e., a possible transmission (withenergy higher than its CS threshold) is on the medium. TheCBT metric is used to corroborate the claim that D-FPAVreduces the load on the channel uni<strong>for</strong>mly in the network,i.e., it achieves fairness. The probability of reception is used